STUDY ON LIPID ABNORMALITIES IN
CHRONIC RENAL FAILURE
CROSS SECTIONAL STUDY
Dissertation Submitted for
MD Degree (Branch I) General Medicine
March 2009
The Tamilnadu Dr.M.G.R.Medical University
Chennai – 600 032.
CERTIFICATE
This is to certify that this dissertation titled “STUDY ON LIPID
ABNORMALITIES IN CHRONIC RENAL FAILURE” submitted by
DR.C.SEKAR. to the faculty of General Medicine, The Tamil Nadu
Dr.M.G.R. Medical University, Chennai in partial fulfillment of the requirement for the award of MD degree branch I General Medicine, is a
bonafide research work carried out by him under our direct supervision
and guidance
DR. M.KAMARAJ. M.D., DR.A.AYYAPPAN, M.D.,
Professor of Medicine, Professor and Head
Chief, II Medical Unit, Department of Medicine,
Department of Medicine, Madurai Medical College,
Madurai Medical College, Madurai.
DECLARATION
I, Dr.C.SEKAR solemnly declare that the dissertation titled
“Study on lipid abnormalities in Chronic Renal Failure” has been
prepared by me. This is submitted to The Tamil Nadu Dr. M.G.R.
Medical University, Chennai, in partial fulfillment of the regulations for the award of MD degree (branch I) General Medicine.
Place: Madurai
ACKNOWLEDGEMENT
At the outset, I wish to thank our Dean in charge
Dr.S.M.Sivakumar, MS, for permitting me to use the facilities of
Madurai Medical College and Government Rajaji Hospital to conduct this
study.
I wish to express my due respect and gratitude to Dr.A.Ayyappan,
MD, Professor & HOD, Department of Medicine,Madurai Medical
College, Madurai for his generous support and encouragement for this
study.
My beloved unit chief and guide Dr.M.Kamaraj, MD, Professor
of Medicine was instrumental in guiding me through the entire period of
my study and helping me complete my work. I owe my sincere thanks to
him.
I sincerely thank my beloved teachers Dr.Moses.
K.Daniel MD, Dr.Vadivel Murugan, MD, Dr.D.D.Venkataraman MD,
Dr.M.Muthiah,MD, Dr.T.PremKumar,MD, Dr. P.Thirumalai
kolundusubramanian,M.D, Dr.Nalini Ganesh M.D, Dr.Selvaraj,M.D., for their valuable advice and guidance throughout my post graduate
I thank the Head of Nephrology Department Dr. Shanmugha
perumal MD,DM for making me successful in completing my work
through their valuable advices and guidance.
I offer my heartfelt thanks to my Assistant Professors Dr.Sooriya
Kumar MD, Dr.Manimekalai MD, Dr.C.Dharmaraj MD,DCH,
Dr.J.Sangumani MD for their constant encouragement, timely help and critical suggestions through out the study and also for making my stay in
the unit both informative and pleasurable.
I extent my love and gratitude to my family and friends who were
with me in times of need.
My patients, who formed the most integral part of the work were
kind and cooperative. They have lent themselves for this study with out
CONTENTS
Page No
1 .INTRODUCTION 1
2. REVIEW OF LITERATURE 4
3. AIMS AND OBJECTIVES 38
4. MATERIALS AND METHODS 39
5. RESULTS 45
6. DISCUSSION 50
7. CONCLUSIONS 54
8. SUMMARY 55
BIBLIOGRAPHY
PROFORMA
GLOSSARY
MASTER CHARTS
KEY TO MASTER CHART
INTRODUCTION
Chronic kidney disease results when a disease process affects the
structural or functional integrity of the kidneys. Chronic kidney failure is
the result of chronic kidney disease.
Chronic renal disease features various abnormalities of lipid
metabolism, which results in an exceedingly atherogenic profile.
Although most striking lipid abnormalities are seen in nephrotic
syndrome, hyperlipidemia characterizes renal disease of every cause.
Lipid abnormalities in Chronic renal failure are very important,
because atherosclerotic heart disease is the foremost cause of morbidity
and mortality in patients with end stage renal disease
Cardiovascular diseases are the leading causes of death in end
stage renal disease largely as the result of progressively increasing age of
ESRD patients and the broad constellation of uremia associated features .
When the kidney function has deteriorated and is no longer
adequate to sustain life, renal replacement therapy (RRT), dialysis or
transplantation becomes necessary to maintain life. Hence, it is important
progression to ESRD. Unfortunately kidney disease in its early stages in
generally asymptomatic. Early identification of patients at risk for chronic
kidney disease is essential. Major risk factors for the development and
progression of chronic kidney disease include diabetes, high blood
pressure, protein barrier, family history of kidney disease and increasing
age. The progression of kidney disease to end stage can be slowed by
glycemic control (in diabetes), blood pressure control for the patients
with high blood pressure and use of angiotension converting enzyme
(ACE) inhibitors.
Cardiovascular disease is the major cause of death among patients
with chronic renal failure and ESRD (end stage renal disease). In addition
to impairing the microcirculation hypertension may contribute to the
development of atherosclerotic coronary artery disease particularly in the
presence of many lipid abnormalities observed in end stage renal disease.
The patients have reduced HDL-cholesterol and increased plasma
triglyceride concentrations and there is defect in the cholesterol transport.
Other factors that may contribute to atherosclerotic coronary artery
disease in end stage renal disease are reduced HDL-cholesterol synthesis
Also, a growing amount of clinical experience data suggests that
lipids may be important in the development and progression of chronic
renal disease. Potentially injurious lipid abnormalities are invariably
present in these patients more likely to progress to end stage renal disease.
So, the analysis of lipoprotein subclass in chronic renal failure
REVIEW OF LITERATURE
LIPOPROTEIN METABOLISM
Lipoproteins are large, mostly spherical complexes that transport
lipids (primarily triglycerides, cholesteryl esters), and fat-soluble
vitamins through body fluids (plasma, intestinal fluid, and lymph) to and
from tissues. They play an essential role in the absorption of dietary
cholesterol, long chain fatty acids, and fat-soluble vitamins from the liver
to peripheral tissues; and the transport of cholesterol from peripheral
tissues to the liver.
Lipoproteins contain a core of hydrophobic lipids (triglycerides and
cholesteryl esters) surrounded by hydrophilic lipids (phospholipids,
unesterified cholesterol) and proteins that interact with body fluids. The
plasma lipoproteins are divided into five major classes based on their
relative densities: chylomicrons, very low-density lipoproteins (VLDL),
intermediate-density lipoproteins (IDL), low-density lipoproteins (LDL),
and high-density lipoproteins (HDL).
Each lipoprotein class comprises a family of particulars that vary
composition. The density of a lipoprotein is determined by the amount of
lipid and protein per particle. HDL is the smallest and most dense
lipoprotein, whereas chylomicrons and VLDL are the largest and least
dense lipoprotein particles. Most triglyceride is transported in
chylomicrons or VLDL, and most cholesterol is carried as cholesteryl
esters in LDL and HDL.
The apolipoproteins are required for the assembly and structure of
lipoproteins. Apolipoproteins also serve to activate enzymes important in
lipoprotein metabolism and to mediate the binding of lipoproteins to cell
surface receptors. ApoA-I, which is synthesized in the liver and intestine,
is found on virtually all HDL1 particles. ApoA-II is the second most
abundant HDL apolipoprotein and is found on approximately two-thirds
of all HDL particles.
ApoB is the major structural protein of chylomicrons, VLDL, IDL,
and LDL. One molecule of ApoB, either ApoB-48 (chylomicrons) or
apoB-100 (VLDL, IDL, or LDL), is present on each lipoprotein particle.
The human liver makes only apoB-100, and the intestine makes apoB-48.
ApoE is present in multiple copies on chylomicrons, VLDL, and IDL
particles. Three apolipoproteins of the C-series (apoC-I, -II and -III) also
participate in the metabolism of triglyceride-rich lipoproteins.
TRANSPORT OF DIETARY LIPIDS (EXOGENOUS PATHWAY)
Dietary triglycerides are hydrolyzed by pancreatic lipases within
the intestinal lumen and are emulsified with bile acids to form micelles.
Dietary cholesterol and retinol are esterified (by the addition of a fatty
acid) in the enterocyte to form cholesteryl esters, respectively.
Longer-chain fatty acids (>12 carbons) are incorporated into
triglycerides and packaged with apoB-48, cholesteryl esters, retinyl esters,
phospholipids, and cholesterol to from chylomicrons. Nascent
chylomicrons are secreted into the intestinal lymph and delivered directly
to the systemic circulation, where they are extensively processed by
peripheral tissues before reaching the liver. The particles encounter
lipoprotein lipase (LPL), which is anchored to proteoglycans that
decorate the capillary endothelial surfaces of adipose tissue, heart, and
skeletal muscle. The triglycerides of chylomicrons are hydrolyzed by
LPL, and free fatty acids are released; apoC-II, which is transferred to
released free fatty acids are taken up by adjacent myocytes or adipocytes
and either oxidized or re esterified and stored as triglyceride. Some free
fatty acids bind albumin and are transported to other tissues, especially
the liver.
The chylomicrons particle progressively shrinks in size as the
hydrophobic core is hydrolyzed and hydrophilic lipids (cholesterol and
phospholipids) on the particle surface are transferred to HDL. The
resultant smaller, more cholesterol ester-rich particles are referred to as
chylomicrons remnants. The remnants particles are rapidly removed from
the circulation by the liver in a process that requires apoE.1.
TRANSPORT OF HEPATIC LIPIDS (ENDOGENOUS
PATHWAY)
This one refers to the hepatic secretion and metabolism of VLDL
to IDL and LDL. VLDL particles resemble chylomicrons in protein
composition but contain apoB-100 rather than apoB-48 and have a higher
ratio of cholesterol to triglyceride (~1 mg of cholesterol for every 5 mg of
triglyceride). The triglycerides of VLDL are derived predominantly from
The packing of hepatic triglycerides with the other major
components of the nascent VLDL particle (apoB-100, cholesteryl esters,
phospholipids, and vitamin E) requires the action of the enzyme
microsomal transfer protein (MTP). After secretion into the plasma,
VLDL acquires multiple copies of apoE and apolipoproteins of the C
series. The triglycerides of VLDL are hydrolyzed by LPL, especially in
muscle and adipose tissues.1
As VLDL remnants undergo further hydrolysis, they continue to
shrink in size and become IDL, which contain similar amounts of
cholesterol and triglyceride. The liver removes approximately 40 to 60 %
of VLDL remnants and IDL by LDL receptor-mediated endocytosis via
binding to apoE. The reminder of IDL is remodeled by hepatic lipase
(HL) to form LDL; during this process, most of the triglyceride in the
particle is hydrolyzed and all apolipoproteins except apoB-100 are
transferred to other lipoproteins.
The cholesterol in LDL amounts for ~70 % of the plasma
cholesterol in most individuals. Approximately 70 % of circulating LDLs
are cleared by LDL receptor-mediated endocytosis in the liver.
Lipoprotein (a) [Lp(a)] is a lipoprotein similar to LDL in lipid and protein
(a) [apo (a)]. Apo (a) is synthesized in the liver and is attached to
apoB-100 by a disulfide linkage. The mechanism by which Lp (a) is removed
from the circulation is not known.
HDL METABOLISM AND REVERSE CHOLESTEROL
TRANSPORT
All nucleated cells synthesize cholesterol but only hepatocytes can
efficiently metabolize and excrete cholesterol from the body. The
predominant route of cholesterol elimination is by excretion into the bile,
either directly or after conversion to bile acids. Cholesterol in peripheral
cells is transported from the plasma membranes of peripheral cells to the
liver by an HDL mediated process termed Reverse Cholesterol Transport1.
Nascent HDL particles are synthesized by the intestine and the
liver. The newly formed discodial HDL particles contain apoA-I and
phospholipids (mainly lecithin) but rapidly acquire unesterified
cholesterol and additional phospholipids from peripheral tissues via
transport by the membrane protein ATP-binding cassette protein A
(ABCA). Once incorporated in the HDL particle, cholesterol is esterified
by lecithin-cholesterol acyltransferase (LCAT), a plasma enzyme
spherical, and additional apolipoproteins and lipids are transferred to the
particles from the surfaces of chylomicrons and VLDL during lipolysis.
HDL cholesterol is transported to hepatocytes by both an indirect
and a direct pathway. HDL cholesteryl esters are transferred to
apoB-containing lipoproteins in exchange for triglyceride by the cholesteryl
ester transfer protein (CETP). The cholesteryl esters are then removed
from the circulation by LDL receptor-mediated endocytosis. HDL
cholesterol can also be taken up directly by hepatocytes via the scavenger
receptor class BI (SR-BI), a cell surface receptor that mediates the
selective transfer to cells.
HDL particles undergo extensive remodeling within the plasma
compartment as they transfer lipids and proteins to lipoproteins and cells.
For example, after CETP-mediated lipid exchange, the
triglyceride-enriched HDL becomes a substrate for LPL, which hydrolyzed the
triglycerides and phospholipids to generate smaller HDL particles.
Transport of endogenous hepatic lipids via VLDL, IDL, and LDL.
Note the relative and absolute changes in apoproteins, other than
apoB100, as VLDL is converted to IDL and LDL. The sites of action of
Transport of exogenously derived lipids from the intestine to
peripheral tissues and liver via the chylomicrons system.HDL metabolism
and the role of HDL in reverse cholesterol transport. Free cholesterol is
accepted from peripheral tissues by HDL3 and, after esterification, may be
transferred to apoB100 lipoproteins.
Physical-Chemical Characteristics of the Major Lipoprotein Classes Lipid %
Lipoprotein Density, g/dl Molecular
Mass, kDa
Diameter nm
TG Chol PL
Chylomicrons 0.95 400 x 103 75-1200 80-95 2-7 3-9
VLDL 0.95-1.006 10-80x103 30-80 55-80 5-15 10-20
IDL 1.006-1.019 5-10x103 25-35 20-50 20-40 15-25
LDL 1.019-1.063 2.3x10³ 18-25 5-15 40-50 20-25
HDL 1.063-1.210 1.7-3.6x10² 5-12 5-10 15-25 20-30
The remaining percent composition is made up of the apoproteins.
Note: TG, triglyceride; Chol, the sum of free and esterified
cholesterol; PL, phospholipids; VLDL, very low density lipoprotein; IDL,
intermediate density lipoprotein; LDL, low density lipoprotein; HDL,
Pathophysiology of Dyslipidemia in CKD and Dialysis:
The spectrum of dyslipidemia in patients with CKD and dialysis
patients is distinct from that of the general population. It involves all
lipoprotein classes and shows considerable variations depending on the
stage of CKD5. There seems to be a gradual shift to the uremic lipid
profile as kidney function deteriorates, which is further modified by
concurrent illnesses such as diabetes16 and nephrotic syndrome17. Apart
from quantitative differences major qualitative changes in lipoproteins
can be observed, such as oxidization and modification to sdLDL, which
render the particles more atherogenic.
Hypertriglyceridemia:
Plasma triglycerides start to increase in early stages of CKD and
show the highest concentrations in nephrotic syndrome and in dialysis
patients, especially those who are treated with peritoneal dialysis (PD).
Plasma triglycerides are predominantly found in two types of lipoproteins
in normal individuals. These are chylomicrons, which are assembled in
the intestine for the transport of dietary fatty acids,18-20 and VLDL which
are produced in the liver for the transport of endogenous fatty acids. The
accumulation of triglycerides is the consequence of both a high
production of triglyceride rich lipoproteins is possibly a consequence of
impaired carbohydrate tolerance and enhanced hepatic VLDL synthesis21.
The reduced fractional catabolic rate is likely due to the decreased
activity of two endothelium associated lipases, namely, LPL and hepatic
triglyceride lipase, which have the primary physiologic function of
cleaving triglycerides into FFA for energy production or storage. The
cause of the decreased lipase activities in uremia is thought to be
depletion of the enzyme pool induced by frequent hyalinization in
hemodialysis (HD) patients22, an increase in the plasma apoC-III/apoC-II
ratio, and the presence of other lipase inhibitors in plasma. ApoC-II is an
activator of LPL, whereas apoC-III is an inhibitor of LPL. The increased
apoC-III/apoC-II ratio is usually due to a disproportionate increase in
plasma apoC-III23. The impaired lipase activities in uremic plasma may
also be caused by a decrease in LPL synthesis as a result of secondary
hyperparathyroidism or suppressed insulin level 24.
Incomplete catabolism result in the accumulation of remnant
particles (chylomicrons remnants and IDL) that contribute to the
heterogeneity of the plasma pool of triglyceride-rich lipoproteins with
different sites of origin, sizes, compositions25, and degrees of
for the removal of the particles from the circulation by binding to LPR
and perhaps other receptor on the vascular wall27. The arterial wall
therefore is exposed to high plasma levels of remnant lipoproteins for
prolonged durations, which may predispose to atherogenesis.
High Density Lipoprotein:
Patients with CKD generally have reduced plasma HDL cholesterol
concentrations compared with nonuremic individuals. Furthermore, the
distribution of HDL subfractions are different. Because of the low apo-AI
level and decreased LCAT activity8 the esterification of free cholesterol
and hence the conversion of HDL3 to HDL2 are diminished in uremia.
This decreased ability of the HDL particles to carry cholesterol leads to
an impairment in the reverse cholesterol transport from peripheral cells to
the liver, thereby burdening the vasculature with cholesterol and
promoting atherosclerosis28-30.
Another important component of HDL is paraoxonase, an enzyme
that inhibits the oxidation of LDL. Plasma paraoxonase activity is
reduced in patients with CKD31, thereby predisposing the LDL and
possibly also HDL particles to oxidation. Furthermore infection
an antioxidant into a pro-oxidant particle32,33. All of these may contribute
to atherogenesis in CKD.
Apolipoprotein A-IV:
ApoA-IV is a 46-kDa glycoprotein that is synthesized primarily in
enterocytes of the small intestine. In vitro studies suggest that apoA-IV
might protect against atherosclerosis by promoting several steps in the
reverse cholesterol transport pathway, which removes cholesterol from
peripheral cells and directs the cholesterol to liver and steroidogenic
organs for metabolism34-36. Specifically apoA-IV activates LCAT37,38 and
modulates the activation of LPL 39 as well as the protein-mediated
transfer of cholesteryl esters from HDL to LDL40. Cross sectional studies
have shown an inverse relationship between plasma apoA-IV levels and
presence of coronary artery disease in the general population41,42 as well
as in patients with CKD.
ApoA-IV has also been identified as a marker of primary CKD,
and its plasma levels are already increased when glomerular filtration rate
(GFR) is still normal. Furthermore, high plasma apoA-IV concentrations
predicted, independent of baseline GFR, the progression of primary
nondiabetic kidney disease, defined as doubling of serum creatinine or
follow-up study43. These findings were unexpected, given the physiologic
functions in reverse cholesterol transport and the antioxidative properties
of apoA-IV. The high apoA-IV levels44 that were caused by the
impairment of GFR are further modulated by nephrotic syndrome.
Specifically, a tubular type of proteinuria cause a decrease in plasma
apoA-IV levels. These observations suggest that the human kidney is
involved in apoA-IV metabolism, a hypothesis that is further supported
by the presence of apoA-IV in kidney tubular cells45. In dialysis patients,
apoA-IV levels are twice as high as in the general population46-49.
Low-Density Lipoprotein:
Elevated plasma LDL cholesterol concentration is common in
nephritic syndrome but is not a typical feature of patients with advanced
CKD, especially those who are on HD. There are, however, qualitative
changes in LDL in patients with CKD and dialysis patients. The
proportions of sdLDL and IDL, which are considered to be highly
atherogenic, are increased sdLDL is a subtype, of LDL that has high
propensity to penetrate the vessel wall, becomes oxidized, and triggers
the atherosclerotic process. IDL is an intermediate metabolite of VLDL
that is normally further degraded to LDL with the cleavage of
activities in HD patients, the conversion of IDL to LDL is impaired and
IDL accumulates 50 in plasma. IDL and sdLDL have high affinity for
macrophages, which theoretically promote their entry into the vascular
wall to participate in the formation of foam cells and atherosclerotic
plaques51-54. The plasma levels of apoB, which is the major
apolipoprotein of LDL an IDL, are strongly correlated with levels of
these lipoproteins.
A vicious cycle has been suggested in uremia in which the
decreased catabolism of IDL and LDL leads to their increased plasma
residence time and further modification of the apoB contained in these
lipoproteins by oxidation, carbamylation, and glycation. These
modifications lead to the reduced recognition and binding of these
lipoproteins to LDL receptors and LRP in the liver and hence further
reduction in plasma clearance by this physiologic pathway. Using stable
isotope techniques, it was shown recently that the plasma residence time
of LDL and IDL is more than twice as long in HD patients as in
nonuremic individuals. This reduced catabolism, however, is masked by
the decreased production of LDL, resulting in near normal plasma levels
of LDL55. In contrast to the decreased clearance by the liver, there is an
pathway. Modified LDL particles, such as ox-LDL and
malonodialdehyde-modified LDL, are taken up by macrophages via
binding to several cell surface scavenger receptors. The accumulation of
cholesterol leads to the transformation of macrophages into foam cells in
the vascular wall and contributes to atherogenesis51-54,56.
Kinetic parameters of apolipoprotein B (apoB) in LDL, apoB in
IDL and apolipoprotein(a) [apo(a) in Lp(a). The concentration,
production rate, and residence time in plasma are presented for control
subjects (light green) and HD patients (dark green). Each bar represents
mean + SEM. Data for LDL and IDL are derived from reference; data for
Lp(a) are derived from reference. Despite differences in the production
rate and residence time, there were no statistically significant differences
in plasma concentration of the three lipoprotein particles between HD
patients and nonuremic control subjects.
Lipoprotein(a):
There is strong evidence that lipoprotein(a) [Lp(a) is a risk factor
for CVD in the general population57,58. Lp(a) is an LDL-like lipoprotein
that consists of apo(a) that is covalently bound to an LDL particle. Apo(a)
for binding to Plasminogen receptors, fibrinogen, and fibrin59. Plasma
Lp(a) concentrations are strongly genetically determined by the apo(a)
gene, which contains a heritable number of kringle-IV (K-IV) repeats.
The number of K-IV repeats is the basis for the apo(a) K-IV repeat
polymorphism60. The molecular weight of apo(a) increases with the
number of K-IV repeats ranging from 300 to >800 kDa, and is inversely
related to the plasma Lp(a) concentration. Thus, individuals with high
molecular weight or large apo(a) isoforms have on average low plasma
Lp(a) concentrations, whereas those with low molecular weight or small
isoforms usually exhibit high plasma Lp(a) concentrations. Depending on
the population under investigation, this association explains between 30
and 70% of the variability in plasma Lp(a) levels.
In kidney disease, plasma Lp(a) levels are also influenced by GFR.
In patients with large apo(a) isoforms but not those with small apo(a)
isoforms, plasma Lp(a) levels begin to increase in stage 1 CKD before
GFR starts to decrease. This isoform specific increase in plasma Lp(a)
levels was observed in several but not all studies in non-nephrotic
patients with CKD and HD patients49,61-64. In contrast, in patients with
nephrotic syndrome and PD patients65,66, increase in plasma Lp(a) levels
pronounced protein loss and a subsequently increased production in the
liver67. After successful kidney transplantation, a decrease in plasma
Lp(a) can be regularly observed in HD patients with large apo(a)
isoforms and in PD patients with all apo(a) isoform groups68,69. Thus, the
elevation of Lp(a) in CKD is an acquired abnormality, mostly influenced
by the degree of proteinuria and less by the cause of kidney disease49.
In vivo turnover studies using stable isotope techniques recently
elucidated the mechanism for the increased plasma Lp(a) levels in HD
patients. The production rates of apo(a) and apoB, the two
apolipoproteins that are contained in Lp(a), were normal when compared
with control subjects with similar plasma Lp(a) concentrations. The
fractional catabolic rate of these apolipoproteins, however, was
significantly reduced compared with control subjects. This resulted in a
much longer residence time in plasma of almost 9 days for apo(a),
compared with only 4.4 days in control subjects. This decreased clearance
is likely the result of loss in kidney function in HD patients71.
Malnutrition and inflammation have also been associated with high
plasma Lp(a) levels in HD patients63,64,72,73. The elevation of plasma Lp(a),
however, can even be observed in patients with normal plasma C-reactive
inflammation only modifies Lp(a) concentrations but fails to explain the
apo(a) phenotype-specific elevation of plasma Lp(a).
In summary, the hallmarks of uremic dyslipidemia are
hypertriglyceridemia; increased remnant lipoproteins (chylomicron
remnants and IDL); reduced HDL cholesterol; and increased sdLDL,
Lp(a), and apoA-IV. Elevated plasma LDL cholesterol level is not typical
but can mostly be observed in patients with nephrotic syndrome and PD
patients.
Epidemiologic Association between Dyslipidemia and CV Outcome in
CKD:
In the general population, high plasma concentrations of LDL
cholesterol, low concentrations of HDL cholesterol, and to some extent
high total triglyceride concentrations are associated with increased
atherosclerotic CV risk3,4,74. In the dialysis populations, the
preponderance of the literature, including cross-sectional75-77 and
longitudinal studies78-85, does not support a strong association between
dyslipidemia and CVD. This seemingly aberrant relationship may be due,
in part, to the approaches of dyslipidemia assessment. The precise
longitudinally using multiple measurements overtime, because the plasma
lipid patterns change substantially as kidney disease progresses, as
illustrated by the decline of plasma LDL levels from the nephrotic stage
to the HD stage. Furthermore, the atherogenic potential of dyslipidemia in
CKD may depend more on the apolipoprotein than on lipid abnormalities
and may not always be recognized by measurement of plasma lipids
alone, as suggested by Attman and Alaupovic75. An additional caveat is
that, in many dialysis patients, CVD is caused or accentuated by other
risk factors, such as volume overload, medial calcification, and
arrhythmogenicity, and may not necessarily be related to atherosclerosis.
Total Cholesterol:
In large administrative databases, the relationship between plasma
total cholesterol and mortality in HD patient has been found to be
U-shaped87,88. The group with total cholesterol between 200 and 250mg/l
had the lowest risk for death, whereas those with levels >350mg/dl had a
relative risk of 1.3 fold and those with levels <10mg/dl had a relative risk
of 4.2-fold. The association between low total cholesterol and increased
mortality, however, was reduced after statistical adjustment for plasma
albumin levels. Subgroup analysis provides further insights into the
recent study of 1167 HD patients found that among those with low
plasma albumin level (3.5 to 3.9g/dl), low plasma total cholesterol levels
were also associated with increased all cause mortality. Among those
with plasma albumin >4.5g/dl, however, high plasma total cholesterol
levels were associated with increased mortality (10, as observed in the
general population. This dichotomous relationship was confirmed in the
Choices for Healthy Outcomes in Caring for ESRD (CHOICE) study,
which showed a nonsignificant negative association of cardiovascular
mortality with plasma total as well as non-HDL cholesterol levels in the
presence of inflammation and/or malnutrition; in contrast, there was a
positive association between total and non-HDL cholesterol and mortality
in the absence of inflammation or malnutrition. These observations are
compatible with the hypothesis that the inverse association of total
cholesterol levels with mortality in dialysis patients is mediated by the
cholesterol lowering effect of malnutrition and/or systemic inflammation
and not due to a protective effect of high cholesterol concentrations.
IDL Cholesterol:
In observational studies, high plasma IDL cholesterol levels have
been shown to be a risk factor independent of LDL cholesterol for
predictor for aortic atherosclerosis in HD patients90. As discussed, IDL
cholesterol is often elevated in uremia. Unfortunately, the current clinical
assays do not differentiate between LDL cholesterol and IDL cholesterol.
Therefore, current clinical assays may not accurately asses the
atherosclerotic burden of plasma cholesterol in uremia.
Lp(a) Concentrations and Apo(a) Polymorphism:
The association of Lp(a) with atherosclerotic complications has
been investigated in numerous studies in dialysis patients. The results
were inconsistent in prospective as well as in retrospective studies. This
inconsistency might have been due, at least in pat, to the
nonstrandardized assay method for Lp(a) in the past. When apo(a)
phenotyping was performed in conjunction with plasma Lp(a)
concentrations, however, an association between the apo(a) K-IV repeat
polymorphism and CV complications was consistently observed. A cross
sectional study in 607 HD patients showed an association between low
molecular weight apo(a) phenotype with history of coronary events. Two
large prospective studies also found a clear association of the apo(a)
polymorphism with coronary events and total mortality, respectively.
Kronenberg et al. followed 440 HD patients for 5 yr and found a strong
association between the low molecular weight apo(a) phenotype and
events showed only a trend toward elevated levels and did not reach
statistical significance. Similarly, the CHOICE Study recently reported
small apo(a) isoforms to be associated with total mortality in an inception
cohort of >800 incident dialysis patients who were followed for a median
of 33.7 mo. In that study, Lp(a) concentrations were associated with CV
events but not with total mortality.
Apolipoproteins:
In the general population, plasma apoA-IV was reported to be
lower in patients with CVD compared with control subjects, and this
association was independent of HDL cholesterol and triglyceride
concentrations. Similarly, participants in the Mild to Moderate Kidney
Disease Study with CVD complications also had lower apoA-IV levels
than those without. More data in various stages of CKD are required to
confirm these findings.
Hyperlipidaemia and Progression of Kidney Disease:
It has long been suggested that hyperlipidaemia could cause renal
injury and contribute to the progression of renal disease7,110. There have
been a number of observational studies showing that lipid abnormalities
population. It is uncertain if it is the lipid abnormalities that cause the
reduction in kidney function or if impaired renal function or proteinuria
itself cause both the lipid abnormalities and reduction in renal
function13,14. Most studies have been small and a meta-analysis of these
studies to assess the effect of lipid reduction on the progression of renal
disease has shown than lipid reduction may preserve GFR and reduce
proteinuria. More recent studies have shown that HMG-CoA reductase
inhibitors (statins) can reduce proteinuria and slow the decline in renal
function. The effect of statins in reducing the decline in GFR was more
significant in patients with proteinuria91-94.
Furthermore, it has been well established that proteinuria
contributes to the progression of renal disease91,95. Despite optimal
medical management with interventions to achieve tight blood pressure96
and blood glucose control97, the use of angiotension converting enzyme
(ACE) inhibitor98 and angiotension II99 receptor blocker (ARB) or
combined therapy100, patients with renal failure are at risk for progressive
deterioration of their renal function. Statins have been shown to reduce
proteinuria and delay the rate of progression of renal disease in patients
with proteinuria and hypercholesterolaemia92,93. These benefits are in
have suggested that statins have effects beyond lipid reduction and may
have a beneficial anti-inflammatory effect in patients with normal or low
cholesterol levels101,102. In addition to their lipid-lowering effects, statins
can influence important pathways that are involved in the inflammatory
and fibrogenic responses, which are commonly associated with many
forms of progressive renal injury such as reduction in TGF-β production
and inhibition of the proliferative actions of platelet-derived growth
factor103,104.
Finally, statins can decrease coronary events in patients without
cardiovascular disease105,106 and also reduce the mortality rates in patients
with pre-existing coronary artery disease. Even for those with serum
cholesterol levels as low as 3.5mmol/L and in diabetics without coronary
artery disease or high cholesterol, statins have been demonstrated to be
beneficial107,108. In patients with moderate CKD (GFR of 30 to
59.99mL/min per 1.73m2) statins have been demonstrated to reduce the
incidence of cardiovascular events109.
Lipids in Nephrotic Syndrome:
Disturbed lipoprotein metabolism is a consistent feature of the
dyslipidemia appears to be independent of the underlying renal disease
and may substantially contribute to the increased cardiovascular risk that
has been observed in these individuals as well as to the progression of
renal failure. The most common lipid abnormalities in patients with NS
are elevated concentrations of total and LDL-cholesterol as well as a
predominance of cholesterol depleted small, dense LDL particles.
However, in a considerable number of cases, elevated concentrations of
triglycerides (due to accumulation of VLDL and remnant lipoproteins
such as intermediate density lipoprotein (IDL)) can also be observed. In
addition, individuals with nephrotic range proteinuria exhibit increased
concentrations of Lp(a) that, in contrast to what is usually noticed in
CKD patients without proteinuria, is not phenotype-specific. This means
that most patients with the NS have Lp(a) concentrations that are
substantially elevated compared with controls of the same apo(a) isoform.
Finally, HDL-cholesterol levels have variously been reported to be
increased, decreased, or normal in subjects with nephrosis.
The degree of hyperlipidaemia corrates directly with severity of the
proteinuria and inversely with the serum albumin. As reduced GFR is by
itself associated with hyperlipidaemia the strong and independent
of hyperlipidaemia and proteinuria. Conversely, proteineria has an
inverse correlation with the level of HDL, cholesterol. These risk factors
likely predispose patients with nephrotic syndrome to an increased risck
or coronary artery disease.
Among nephrotic patients, lipoprotein abnormalities were similar
between diabetics and non-diabetic patients in a small study and both
groups have elevated (TG), LDL and VLDL cholesterol and low HDL
cholesterol. However, patients with diabetic CKD have lipoprotein
abnormalities that are a reflection of renal insufficiency similar to that of
patients with renal insufficiency due to other causes. These abnormalities
however may be further accentuated by the diabetes and the abnormal
metabolic control.
Lipids in Hemodialysis and Peritoneal Dialysis:
Dialysis is very effective for the amelioration of uremic symptoms
and certain features of uremic toxicity. The initiation of renal replacement
therapy as well as the choice of dialysis modality may also influence the
phenotypic characteristics of uremic dyslipidemia in patients with ESRD.
however, the lipid and apolipoprotein profile that characterizes
hemodialysis (HD). Thus, HD patients usually display increased
concentrations of intact or partially metabolized triglyceride rich
lipoproteins, reduced serum levels of HDL cholesterol and elevated
concentrations of Lp(a). Total and LDL cholesterol values are within
normal limits or reduced in this patient population, whereas the
subfractionation of apolipoprotein B-containing lipoproteins usually
reveals a predominance of small, dense LDL particles. The
pathophysiological mechanisms that underlie the alterations in lipoprotein
metabolism in HD patients are generally similar with those described in
predialysis renal failure individuals. However, the dialysis procedure may
result in additional defects in lipid homeostasis (such as increased
catabolic rate of apolipoprotein AI) that reinforce the clinical expression
of these mechanisms.
Dyslipidemia in kidney transplants:
Dyslipidemia, alone or as part of the metabolic syndrome, is an
established risk factor for CVD mortality in kidney transplant recipients.
The main causes are thought to be steroids, calcineurin inhibitors9-12,
About 60 % of kidney transplant recipients have total cholesterol
level greater than 240 mg/dL (6.21 mmol/L); about 35 % have
hypertriglyceridemia. Low level of high density lipoprotein cholesterol
(<35 mg/dL [0.91 mmol/L]) occur in about 15 % kidney transplant15
recipients- - a percentage similar to that in the general population. The
concentrations of lipoprotein (a) and small, dense LDL-C, which are
atherogenic, is increased.
Lipid Management in CKD Patients Stages 3 to 4 (GFR 15 to
50 ml/min/1.73 m2)
The NKF and National Cholesterol Education Program Adult
Treatment Panel (ATP) III offer similar guidelines for the management of
dyslipidemia in patients with CKD; however, significant differences
exist.In the NKF recommendations, CKD is regarded as a CHD risk
equivalent and an annual lipid panel is recommended. As with any
dyslipidemic patient, a comprehensive search for secondary causes of
dyslipidemia should be conducted, including a search for endocrine
disorders such as hypothyroidism and diabetes and medications such as
corticosteroids, protease inhibitors, beta-blockers, diuretics, and estrogen.
Although patients with CKD frequently have multiple
abnormalities in their lipid profile, LDL-C reduction is the primary goal
of therapy. The NKF recommends LDL-C < 100 mg/dl for patients with
CKD. Currently the NKF does not recommend a more aggressive LDL
goal for patients with CKD and symptomatic atherosclerotic disease.
Based on the amended ATP III guidelines, it might be prudent to treat to
an LDL goal of < 70 mg/dl in patients with CKD with atherosclerotic
disease. As in the general population, statins are the cornerstone of
therapy for dyslipidemia. Treatment with a statin in conjunction with
therapeutic lifestyle changes is usually required to obtain these goals. All
statins can be used safely in patients with CKD; however, differences in
the pharmacokinetic properties give some statins a safety advantage in
patients with advanced CKD (GFR < 30 ml/min/1.73 m2). Because the
excretion of atorvastatin in the kidneys is negligible, no dose adjustment
for reduced GFR or hemodialysis is required. If combination therapy with
a gemfibrozil is likely, then fluvastatin may be the safest choice. Other
statins require dose adjustments as CKD becomes more advanced.
In patients not at their LDL goal on atorvastatin or fluvastatin,
ezetimibe or bile acid sequestrants can be added safely. Bile acid
sequestrants' safety may be limited by their tendency to increase
sequestrants may be limited by their tendency to bind to other
medications and reduce their absorption.
Mixed Dyslipidemia
Most patients with CKD have triglyceride as well as HDL
abnormalities along with elevated LDL (mixed dyslipidemia). After LDL
goal attainment, non-HDL should be the primary goal in the management
of patients with CKD with mixed dyslipidemia. Non-HDL is the only
lipid measurement that correlates positively with cardiovascular mortality
in hemodialysis patients. Very-low-density lipoprotein and
intermediate-density lipoprotein are both known to be elevated in patients with CKD
with mixed dyslipidemia, and therefore non-HDL may be a better marker
of atherogenic cholesterol levels. Based on NKF recommendations,
patients with CKD should be treated to an LDL-C < 100 mg/dl and a
non–HDL-C < 130 mg/dl.
Patients with mixed dyslipidemia frequently require combination
therapy with a statin plus additional lipid-lowering drugs that could
include ezetimibe, a fibrate, niacin, or omega-3 fatty acids. Although
ezetimibe has a negligible effect on HDL and triglycerides, the addition
of ezetimibe to a statin results in a significant additional reduction in
dyslipidemia . The combination of ezetimibe and a statin is relatively safe
and well tolerated in patients with CKD
The omega-3 fatty acids may also be used in combination with a
statin. Although published data on this combination in patients with CKD
is limited, omega-3 fatty acids do not have significant interactions with
statins and do not require dose reductions for impaired renal function.
Although fibrates can be used to treat mixed dyslipidemia, they
need to be used carefully, because they are predominantly metabolized by
the kidneys. According to the NKF guidelines, gemfibrozil is the fibrate
of choice in patients with CKD. There is still controversy concerning the
safety of fenofibrate in patients with CKD, because of its propensity for
increasing serum creatinine and homocysteine to a greater degree than
gemfibrozil. Due to the increased risk of rhabdomyolysis with fibrate and
statin therapy in patients with CKD, the combination requires more
vigilant monitoring, and patients need to report muscle symptoms
immediately. Combined with a statin, fenofibrate clearly has advantages
due to its lack of pharmacokinetic interactions with statins and lower
propensity for rhabdomyolysis.] When gemfibrozil is selected for
combination treatment with a statin, consideration should be given to
interaction and fewer cases of rhabdomyolysis have been reported
compared with other statins. Because of fluvastatin's lower efficacy in
LDL reduction, the addition of a third drug, ezetimibe, may be necessary .
Because CKD alone is a risk factor for rhabdomyolysis, the combination
of a statin with any fibrate still needs to be weighed carefully from a
risk-benefit perspective.
Niacin is also an option for the treatment of mixed dyslipidemia.
Niacin has been shown to increase HDL-C, and reduce both lipoprotein
(a) and triglycerides, which are elevated in patients with CKD, but its use
is limited due to poor tolerability. The NKF clinical practice guidelines
recommend reducing niacin dosing by 50% for GFR < 15 mg/ml/1.73 m2.
Bile acid sequestrants are usually not an option in mixed hyperlipidemia,
due to their tendency to increase triglycerides.
Very High Triglycerides (> 500 mg/dl)
The first goal for patients with fasting triglycerides > 500 mg/dl is
to prevent pancreatitis. Fibrates are frequently started in this scenario,
because they are better tolerated than niacin and are more efficacious
triglyceride-lowering drugs than the statins. Currently, because of safety
concerns, gemfibrozil would be recommended over fenofibrate .
to be reduced in severe renal failure, the NLA Safety Task Force on
Lipid-Lowering Drugs recommends that the gemfibrozil dose should be
reduced to 600 mg/day for patients with a GFR < 60 ml/min/1.73 m2 and
avoided in patients with a GFR < 15 ml/min/1.73 m2. Finally, if
fenofibrate must be used, the dose should not exceed 48 mg/day and
creatinine levels should be monitored carefully.
Another option for very high triglycerides is to treat with omega-3
fatty acids derived from fish oil. The main active ingredients in fish oil
are eicosapentaenoic acid (EPA) and docosahexaenoic (DHA). Four
grams of omega-3 fatty acids per day, in the form of fish oil capsules,
have been shown to reduce triglycerides 35% to 45%. The omega-3 fatty
acids are safe in patients with CKD and have minimal drug interactions.
Until recently, a major limitation was that over-the-counter preparations
had only 200 to 300 mg omega-3 fatty acids per capsule, requiring the
consumption of 12 to 16 capsules/day. The only available
prescription-brand omega-3 fatty acid contains almost 900 mg omega-3 fatty acids,
requiring only 4 capsules/day.
Lipid Management in Hemodialysis Patients (CKD Stage 5; GFR < 15 ml/min/1.73 m2)
The options for hemodialysis CKD stage 5 patients are more
elevated LDL-C, choosing statins with limited renal excretion, such as
atorvastatin or fluvastatin, may be more important . In mixed
dyslipidemia, omega-3 fatty acids may have a more prominent role,
because the NLA recommends avoiding fibrate use in patients with a
GFR < 15 ml/min/1.73 m2. In patients with very high triglycerides,
clinicians can treat with 3 to 4 g/day omega-3 fatty acids, or if a fibrate
must be used then gemfibrozil can be given at a reduced dose of
600 mg/day.
Proposed Treatment Algorithm for Lipid Management in Patients
With CKD (Stage 3 to 5)
Lipid Disorder Therapeutic Option
Moderate to severe CKD, stages 3 to 4 (GFR 15–59 ml/min/1.73 m2)
Elevated LDL-C 1. Atorvastatin, add ezetimibe if not at LDL-C goal
2. Fluvastatin, add ezetimibe if not at LDL-C goal
Mixed dyslipidemia* (not at non-HDL† goal)
1. Atorvastatin or fluvastatin + ezetimibe
2. Fluvastatin + gemfibrozil 600 mg/day +
ezetimibe if not at non-HDL goal
3. Statin + omega-3 fatty acids, add ezetimibe if not
at non-HDL goal
4. Statin + fenofibrate 48 mg/day, add ezetimibe if
not at non-HDL goal
Very high triglycerides (triglyceride
≥500 mg/dl)
1. Gemfibrozil 600 mg/day
2. Omega-3 fatty acids 3–4 g/day
CKD stage 5 (hemodialysis or GFR <15 ml/min/1.73 m2) Elevated
LDL-C
Atorvastatin (10–80 mg/day) or fluvastatin 40 mg/day, add ezetimibe if not at LDL-C goal
Mixed dyslipidemia
Atorvastatin or fluvastatin 40 mg/day, add ezetimibe 10 mg/day or omega-3 fatty acids 3–4 g/day if not at non-HDL goal
Very high
triglycerides Omega-3 fatty acids 3–4 g/day or gemfibrozil 600 mg/day
AIMS AND OBJECTIVES
¾ To study the Lipid abnormalities in patients with Chronic renal
MATERIALS AND METHODS
Setting:-
Chronic renal failure patients admitted in medical wards of Govt.
Rajaji Hospital, Madurai.
Collaborating departments
1. Department of Nephrology
Madurai Medical College, Madurai.
2.Department of Bio Chemistry
MMC, Madurai.
Design of the Study : Cross sectional Study
Period of Study : From February 2008 to July 2008
Sample Size : 25- controls
Definitions:
Chronic Kidney disease:
It is defined by the presence of kidney damage or decrease in
kidney function (Glomerular filtration ratio < 60 ml/mt/1.73m2) for the
three months or more, irrespective of the etiology.
Kidney damage:
It is defined as structural or functional abnormalities of kidney,
initially without decreased GFR. Kidney damage can be diagnosed by
any abnormalities in the blood (elevated blood urea and creatinine) urine
(proteinuria, granular casts), imaging study or by biopsy.
Kidney Failure:
It is defined as either level of GFR decreased to <15ml/min, which
is accompanied in most cases by signs and symptoms of uremia or a need
for initiation of kidney replacement therapy (dialysis or transplantation)
for treatment for complications of decreased GFR, which would
End stage renal failure (ESRD) is defined as a level of GFR to <5ml/min where survival is not possible without renal replacement
therapy.
GFR is the best estimate of kidney function. The serum creatinine
alone is not at accurate measure of the glomerular filtration rate.
Creatinine is secreted by the renal tubules and as the renal function
worsens the amount secreted increases.
GFR can be estimated using the cockcroft – Gault formula2
140-age x weight (kg) CrCL (ml/mt) =
72 x S.creatine (mg/dl) x 0.85 (for women)
Dyslipidemia:
Any abnormality in plasma lipoprotein concentration or
composition that is associated with an increased risk for atherosclerotic
cardiovascular disease.
Lipid profile:
Plasma level of total cholesterol, low density lipoprotein
cholesterol, high density lipoprotein cholesterol and triglycerides.
Inclusion criteria:
Anaemia of chronic renal failure
Hypertension
Uremic symptoms – Three months duration
2. Biochemical
a. Elevated blood urea & serum creatinine
3. Ultra sonographic
a. Contracted kidney
b. Increased cortical echogenicity
c. Loss of cortico medullary differentiation
Exclusion criteria:
Patients with chronic renal failure with the following conditions
were excluded from this study.
1. Diabetes mellitus
2. Nephrotic syndrome
3. Obesity BMI >30
4. Liver disease
5. Alcohol abuse / smokers
6. Thyroid dysfunction
7. Taking steroids, diuretics (Thiazides), beta blockers.
9. Lipid lowering drugs.
These patients were evaluated on the basis of the proforma on the
following guidelines
¾ Clinical history and physical examination
¾ Routine investigations like blood HB%, total count,
differential count, blood sugar, urine analysis.
¾ Renal parameters inducting blood urea, serum creatinine.
¾ Fasting lipid profile
¾ ultrasonogram abdomen .
All specimens were analyzed within 4 to 6 hours of collection.
Total cholesterol and triglycerides in the plasma were measured
enzymatically and then the cholesterol in the supernatant is measured
after precipitation of APO-B containing lipoprotein to determine the HDL
cholesterol. LDL cholesterol is estimated by using the friedewald formula.
FRIEDEWALD FORMULA appears to be the most practical &
reliable method for determining LDL-cholesterol in clinical practice.
VLDL is estimated by dividing the plasma triglycerides by 5
reflecting the ratio of cholesterol to triglyceride in VLDL particles. This
formula is reasonably accurate if test resolution is obtained on fasting
plasma and if the triglyceride level is less than 350mg/dl. The accurate
determination of LDL-C level in conditions with triglyceride levels
greater than this requires application of ultra centrifugation techniques
(BETA QUANTIFICATION)
Ethical Committee approval : Obtained
Consent : Informed consent was obtained
Financial support : Nil
Conflict of interest : Nil
Statistical Tools
The information collected regarding all the selected cases were
recorded in a Master Chart. Data analysis was done with the help of
computer using Epidemiological Information Package (EPI 2002).
Using this software, range, frequencies, percentages, means,
standard deviations, chi square and 'p' values were calculated. Kruskul
between quantitative variables. A 'p' value less than 0.05 is taken to
RESULTS
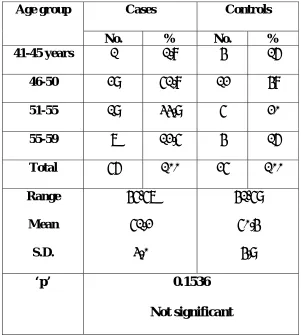
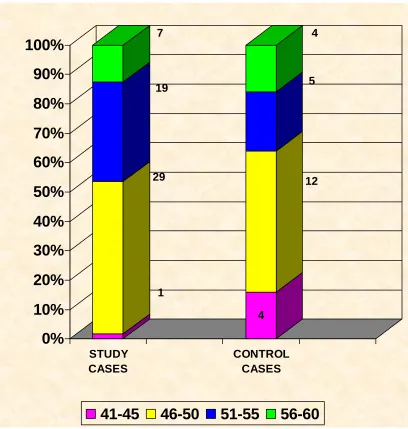
Table 1 : Age distribution
Cases Controls Age group
No. % No. %
41-45 years 1 1.8 4 16
46-50 29 51.8 12 48
51-55 19 33.9 5 20
55-59 7 12.5 4 16
Total 56 100 25 100
Range
Mean
S.D.
45-57
51.2
3.0
41-59
50.4
4.9
‘p’ 0.1536
Not significant
The mean age of the patients were 51.2 years and maen age of the
controls were 50.4 years.There was no significant difference between the
study cases and controls in the age(p value 0.153).Hence they are
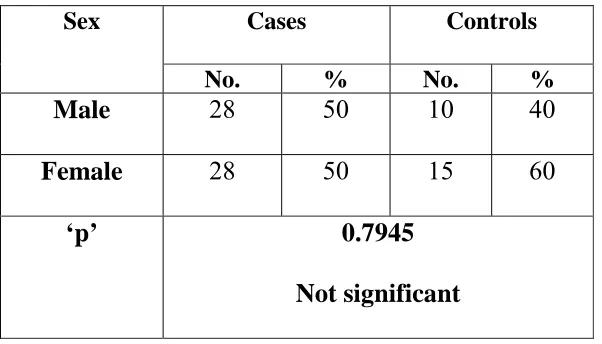
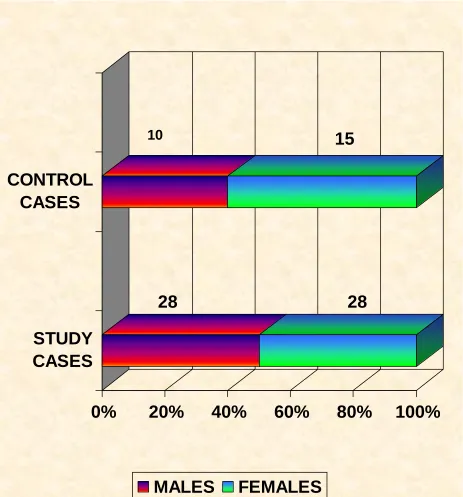
[image:53.612.176.477.158.493.2]Table 2 : Sex distribution
Cases Controls Sex
No. % No. %
Male 28 50 10 40
Female 28 50 15 60
‘p’ 0.7945
Not significant
There was no significant difference between study group and
controls regarding the sex distribution ( p value0.7945).Hence they are
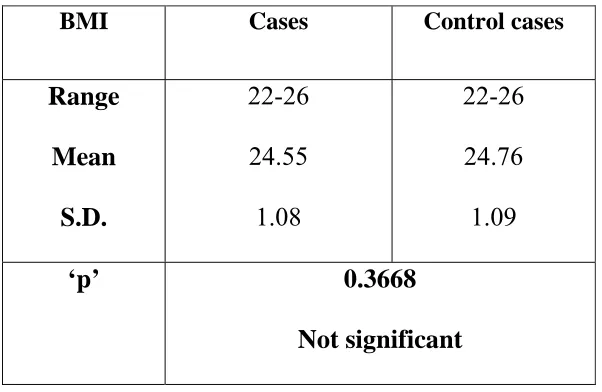
[image:54.612.178.479.169.341.2]Table 3 :
BMI
BMI Cases Control cases
Range
Mean
S.D.
22-26
24.55
1.08
22-26
24.76
1.09
‘p’ 0.3668
Not significant
The mean BMI of study cases was 24.55 Kg/m2 and that of controls
was 24.76 Kg/m2 .There was no significant difference between the study
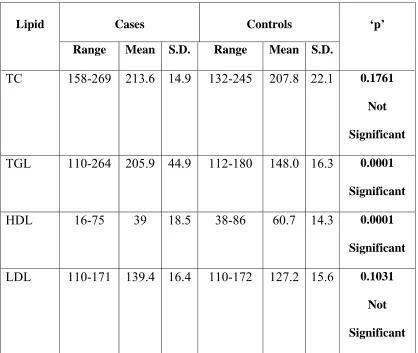
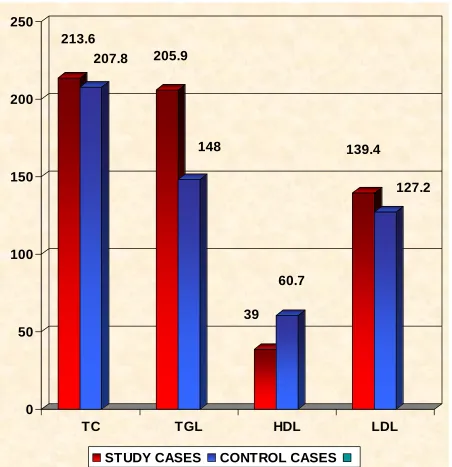
[image:55.612.177.478.197.393.2]Table 4 :
Lipid Profile
Cases Controls
Lipid
Range Mean S.D. Range Mean S.D.
‘p’
TC 158-269 213.6 14.9 132-245 207.8 22.1 0.1761
Not
Significant
TGL 110-264 205.9 44.9 112-180 148.0 16.3 0.0001
Significant
HDL 16-75 39 18.5 38-86 60.7 14.3 0.0001
Significant
LDL 110-171 139.4 16.4 110-172 127.2 15.6 0.1031
Not
TOTAL CHOLESTEROL
The mean total cholesterol in the study population was 213.6 mg/dl
and in the control group it was 207.8 mg/dl. There is no statistically
significant difference between the serum cholesterol levels of cases and
controls.( p value 0.1761).
TRIGLYC ERIDES
The mean triglyceride in study group was 205.9 mg/dl and 148
mg/dl in control group. There is significant difference between the two
groups as suggested by the p value 0.0001.
HDL CHOLESTEROL
HDL in our study showed a significant reduction in CRF cases
compared with controls. The mean HDL in cases were 39 mg/dl and 60.7
mg/dl in controls. The difference was statistically significant with a p
value of 0.0001.
LDL CHOLESTEROL
LDL Cholesterol was high in cases compared to controls, but the
difference was not significant statistically. The mean LDL in cases was
139.4 mg/dl and 127.2 mg/dl in controls. The p value was 0.1031( Not
DISCUSSION
Chronic kidney disease results when a disease process affects the
structural or functional integrity of the kidneys. Chronic kidney failure is
the result of chronic kidney disease. Cardiovascular disease is a major
cause of mortality in patients with mild to moderate chronic kidney
disease and end stage renal disease. Dyslipidemia has been established as
a well known traditional risk factor for cardiovascular disease in general
population and it is well known that patient with CKD exhibit significant
alterations in lipoprotein metabolism, which in their most advanced form
may result in the development of severe dyslipdemia.
This study was done to identify the lipid abnormalities that occur
in CRF patients admitted in Govt. Rajaji Hospital, Madurai.
A total of 56 cases who fulfilled the diagnostic criteria for CRF
were included in the study. 25 age, sex and BMI matched healthy controls
who fulfilled the inclusion and exclusion criteria were taken for
comparing the lipid profile.
Among 56 cases the mean age was 51.2 yrs with the range of 45 –
There was no significant difference between cases and controls with
regard to the age. ( P value – 0.1536 ). So they can be compared.
There were equal number of males and females in the study group,
28 males and 28 females. Among the 25 controls, 10 were males and 15
were females. There was no significant difference between cases and
controls as far as sex is concerned. ( P value – 0.7945 )
The mean BMI of the cases was 24.55 kg / m2 .The mean BMI
of the controls was 24.76 kg / m2. There was no significant difference
between cases and controls with respect to BMI.
On analyzing the lipid profile and comparing the CRF cases with
controls we found that there is significant increase in triglycerides and
significant decrease in HDL–cholesterol. The change in total cholesterol
and LDL-C between cases and controls was not significant.
TOTAL CHOLESTEROL:
The mean total cholesterol in the CRF cases was 213.6 mg/dl
and that of the controls was 207.8 mg/dl. There was no statistically
significant difference in this parameter. (P value – 0.1761).This
coworkers in their work on plasma lipoproteins in CRF patients. They
also concluded that total cholesterol is not increased significantly in
patients with CRF114.
TRIGLYCERIDES:
Significant increase in serum triglycerides was seen in cases
when compared with controls. Mean triglycerides was 205.9 mg in cases
and 148 mg / dl in controls.( P value is 0.0001). This result was in
concordance with the work done by E.Kimak and team, in which they
demonstrated significant increase in Triglycerides, LDL and Apo-B
concentrations114.In another study, done by Bhagwat.R , Joshi S P and
team, they concluded that CRF patients were having marked
triglyceridemia of 232 mg / dl as compared to controls.(P value less than
0.01) 111.Another Indian study on dyslipidemia in patients with CRF and
renal transplantation by B.Shah, S.Nair and coworkers they demonstrated
that triglycerides was elevated significantly in CRF patients on
conservative management117.These results shows that
hypertriglyceridemia is an important lipid abnormality in patients with
CRF.
Our study demonstrated an increase in LDL cholesterol
between cases and controls. (139.4 mg/dl vs 127.2 mg / dl ). This was not
significant statistically.p value(0.1031). This was similar to the study by
Bhagwat R and Joshi S P where they found that LDL cholesterol in CRF
patients showed an increase compared to controls which is not
statistically significant111. Study by E.Kimak and team showed results
not comparable to our study. LDL cholesterol showed significant increase
among CRF patients compared with controls in their study114. Although
the total concentrations of LDL are not significantly increased there is
predominance of small dense particles which are particularly susceptible
to oxidation in CRF. These small particles are thought to be more
atherogenic than larger LDL substrates112.
HDL CHOLESTEROL :
Our study demonstrated a significant decrease in HDL in CRF
cases when compared with controls ( 39mg/dl vs 60.7mg/dl ( Pvalue
0.001 ). This was in concordance with the results obtained by Bhagwat
R and team where they found HDL cholesterol to be significantly low.
(20 +/- 11)mg/ dl( P value less than 0.001) in CRF groups111. Patients
with CKD generally have reduced plasma HDL cholesterol
CONCLUSIONS
1. Lipid abnormalities is common in CRF.
2. Total cholesterol changes are not statistically significant.
3. Triglycerides shows statistically significant increase in CRF
cases when compared with normal.
4. LDL – C is increased in CRF patients but it is not statistically
significant when compared with controls.
5. HDL – C shows a statistically significant decrease in CRF
patients compared with controls.
SUMMARY
Dyslipidemia is a fairly common occurrence in CRF patients.
Cardiovascular mortality in patients with CRF is related to dyslipidemia.
This study was done to identify the lipid abnormalities and its
significance in CRF patients by comparing with age, sex and BMI of
matched healthy control population.
After institutional ethical clearance with an informed consent and
with inclusion and exclusion criteria, 56 cases of CRF were taken as
study cases and Three fasting lipid profile were estimated. 25 age, sex
and BMI matched healthy Population were taken as controls. The data
were entered in master sheet and analyzed statistically.
Dyslipidemia is seen in CRF patients. The total cholesterol, even
though it was high in CRF cases compared with controls, but the change
was not significant statistically. Triglycerides showed a statistically
significant increase in CRF cases. LDL-C was elevated in CRF cases but
the change was not significant statistically. HDL-C on the other hand
showed a statistically significant drop compared to controls. These lipid
abnormalities may be an important contributing factor to the
BIBLIOGRAPHY
1. Principles & practice of medicine Davidson’s 20th edition , dietary
lipid metabolism , page444,445 & chronic renal failure 485to 496
2. API text book of medicine , 8th edition , chronic kidney disease,
Guidelines for GFR estimation page 735 vol 1
3. Harrisons principles of internal medicine 17th edition, lipid
abnormalities in chronic kidney disease page 1763 vol 2
4. Current medical diagnosis & treatment 2008.Lipid abnormality in
CKD.Page 793- 800.
5. Oxford textbook of clinical nephrology 2nd edition vol 3, page
1840 , lipid abnormalities in chronic kidney disease
6. Brenner & Rector’s , The Kidney, lipid abnormalities in chronic
kidney disease progression 7th edition vol 2 page 1975
7. Moorhead JF , El Nahar.chan MK et al Lipid nephrotoxicity in
chronic progressive disease , Lancet 2: 1309 - 1311 ,1982
8. Mythre e. Gjone ,Flarmark A, et al Renal failure in familial
lecithine acetyltransferase deficiency , Nephrol 8 : 840 – 852 ,
1997
9. Rigatto.C.Parfrey ,P.Foley R,etal .Congestive heart failure in renal
transplant recipients,Risk factors ,outcomes,and relationship with
10. Aakhus S,Dahl K,Widero TE:cardiovascular morbidity and risk
factors in renal transplant patients.Nephrol Dial transplant
14:648-654,1999
11. Warholm C,Wilc zek H,Petterssons E:Hypertension two years after
renal transplantation,action-causes and consequences.Transplant int
8:286-292,1995
12. Schwenger V,Zeier M,Ritz I,Hypertension after renal
transplatation,Ann Transplant 6:25-30,2001
13. Sarnak M J,Coronado B E,Greebe T.etal,Cardiovascular disease
risk factor in chronic renal insufficiency.Clin Nephrol 57:327-335
2002
14. Kasiske B L;Hyperlipidemia in patients with chronic renal
diseases.AMJ kidney Dis 32[5 Suppl3]:s142-s156 1998
15. Kasiske B L,Chakkera H A,Roel J .Explained and unexplained
ischemic heart diseases risk after transplatation,J Am Joc Nephrol
11:1735-1743,2000
16. Krentz AJ: Lipoprotein abnormalities and their consequences for
patients with type 2 diabetes. Diabetes Obes Metab 5[Suppl 1] :
S19 –S27, 2003
17. Kronenberg F: Dyslipidemia and nephrotic syndrome: Recent