METHOD DEVELOPMENT AND VALIDATION OF NEWER ANALYTICAL METHODS AS PER ICH GUIDELINES
Thesis Submitted to
THE TAMILNADU DR. M.G.R. MEDICAL UNIVERSITY Chennai-600 032
As a partial fulfillment of the requirement for the award of Degree of
DOCTOR OF PHILOSOPHY (Faculty of Pharmacy)
Submitted by
Mrs.B. UMADEVI, M.Pharm.
Under the Guidance of
Prof.Dr.T. VETRICHELVAN, M.Pharm., Ph.D. PRINCIPAL
ADHIPARASAKTHI COLLEGE OF PHARMACY
(Accredited by “NAAC” with CGPA of 2.74 on a four point scale at “B” Grade) MELMARUVATHUR-603 319, TAMILNADU, INDIA.
DECLARATION
I hereby declare that the thesis entitled “METHOD DEVELOPMENT AND
VALIDATION OF NEWER ANALYTICAL METHODS AS PER ICH
GUIDELINES” submitted by me for the degree of DOCTOR OF PHILOSOPHY
(Faculty of Pharmacy), is a record of research work carried out by me during the
period from 2008-2013, under the guidance of Prof.Dr.T. VETRICHELVAN,
M.Pharm., Ph.D., Head, Department of Pharmaceutical Analysis and Principal,
Adhiparasakthi College of Pharmacy, Melmaruvathur- 603 319, TamilNadu, India
and has not formed the basis for the award of any degree, diploma, associateship,
fellowship, title in this or any other university or similar institute of higher learning.
CERTIFICATE
This is to certify that the thesis entitled “METHOD DEVELOPMENT AND
VALIDATION OF NEWER ANALYTICAL METHODS AS PER ICH
GUIDELINES” submitted to The TamilNadu Dr. M.G.R. Medical University,
Guindy, Chennai- 600 032, Tamil Nadu, India as a partial requirements for the award
of Degree of DOCTOR OF PHILOSOPHY (Faculty of Pharmacy) is a record of
research work done by Mrs.B. UMADEVI, M.Pharm., during 2008-2013 under my
guidance and supervision at Adhiparasakthi College of Pharmacy, Melmaruvathur-
603 319, Tamil Nadu, India and that the thesis has not formed the basis for the award
of any other degree, diploma, associateship, fellowship, or any other similar title to
the candidate and the thesis represents independent work of the candidate.
Place: Melmaruvathur Date: 05.09.2013
Prof.Dr. T.VETRICHELVAN, M.Pharm., Ph.D., Head, Department of Pharmaceutical Analysis and Principal,
Adhiparasakthi College of Pharmacy, Melmaruvathur- 603 319,
ACKNOWLEDGEMENT
I honestly acknowledge HIS HOLINESS “ARULTHIRU AMMA” for his ever-growing blessings in each step of the study. I am grateful to Thirumathi Lakshmi Bangaru Adigalar, Vice President, ACMEC Trust, Melmaruvathur, for having given me an opportunity and encouragement all the way in completing the study.
I extend my thanks to Dr.T.Ramesh, M.D., Managing Director, MAPIMS, Melmaruvathur, for providing all the necessary facilities to carry out this work.
I feel immensely delighted expressing my copious sincere thanks from the core of my
heart and deep sense of my indelible gratitude to my guide Prof.Dr.T.Vetrichelvan, M.Pharm., Ph.D., Principal and Head, Department of Pharmaceutical Analysis, Adhiparasakthi College of Pharmacy, Melmaruvathur, for the active guidance,
innovative ideas, creative works, indulgement and enthusiastic guidance, valuable
suggestions, a source of inspiration where the real treasure of my work.
I owe my sincere thanks with heartful pleasure to my Doctoral Committee members
Dr.P.Perumal, Professor, JKK Nataraja College of Pharmacy, Kumarapalayam and Dr.G.Krishnamoorthy, Periyar College of Pharmaceutical Sciences for Girls, Trichy. Without their encouragement and moral support it would have been absolutely
impossible to bring out the work in this manner.
My heartful thanks to Mrs.G.Shankari, M.Pharm., Central Instrumentantion in-charge and Miss.R.Radha, M.Pharm., Central Instrumentation in-charge for their persuasive support to complete this work.
I am indeed thanks to the Librarian Mr.M.Suresh, M.L.I.S., for providing all reference books and to make this project a great success.
I wish to thank Shine Pharmaceuticals Pvt. Ltd., Chennai, Centaur Pharmaceuticals Pvt. Ltd., Mumbai, CaplinPoint Laboratories, Pvt. Ltd., Pondicherry and Apex Pharmaceuticals, Pvt. Ltd., Chennai for providing raw materials for carrying out my project work.
Finally I take this opportunity to express my gratitude to all the people involved
directly or indirectly in the successful completion of this dissertation work.
Dedicated to
My
Beloved Parents
and
CONTENTS
SECTION TITLE PAGE
NO
1. INTRODUCTION 1-11
1.1 Introduction to Analytical Chemistry 1
1.2 Why Validation Analytical Procedure 1
1.3 Process of Analytical Method Validation 2
1.4 ICH Guidelines for Analytical Method Validation 2
1.5 System Suitability test 6
1.6 Ultraviolet Spectroscopy 8
1.7 High Performance Liquid Chromatography 10
2. AIM AND OBJECTIVES OF THE STUDY 12
3. LITERATURE REVIEW 13-82
3.1 Drug Profile 13
3.1.1 Drug Profile for Doxofylline 13
3.1.2 Drug Profile for Ambroxol Hydrochloride 15
3.1.3 Drug Profile for Metolazone 18
3.1.4 Drug Profile for Spironolactone 21
3.1.5 Drug Profile for Metoprolol 24
3.1.6 Drug Profile for Olmesartan Medoxomil 27
3.1.7 Drug Profile for Aspirin 30
3.1.8 Drug Profile for Rosuvastatin Calcium 35
3.2 Reported Methods 39
3.2.1 Reported methods of Doxofylline 39
3.2.2 Reported methods of Ambroxol Hydrochloride 45
3.2.3 Reported methods of Metolazone 56
3.2.4 Reported methods of Spironolactone 59
3.2.5 Reported methods of Metoprolol 64
3.2.6 Reported methods of Olmesartan Medoximil 68
3.2.7 Reported methods of Aspirin 73
4. SCOPE AND PLAN OF WORK 83
5. MATERIALS AND METHODS 84-113
5.1 Instrument Specification 84
5.2 Reagents and chemicals used in the study 86
5.3 Materials and methods for Doxofylline and Ambroxol
Hydrochloride combination dosage form
5.3.1 UV Spectrophotometric Methods
5.3.2 High Performance Liquid Chromatographic Method
87
88
92
5.4 Materials and methods for Metolazone and Spironolactone
combination dosage form
5.4.1 UV Spectrophotometric Methods
5.4.2 High Performance Liquid Chromatographic Method
95
96
101
5.5 Materials and methods for Metoprolol and Olmesartan
Medoximil combination dosage form
104
5.6 Materials and methods for Aspirin and Rosuvastatin
combination dosage form
109
6. RESULTS AND DISCUSSION 114-152
6.1 UV- Spectroscopic Methods for Doxofylline and Ambroxol
Hydrochloride combination dosage form
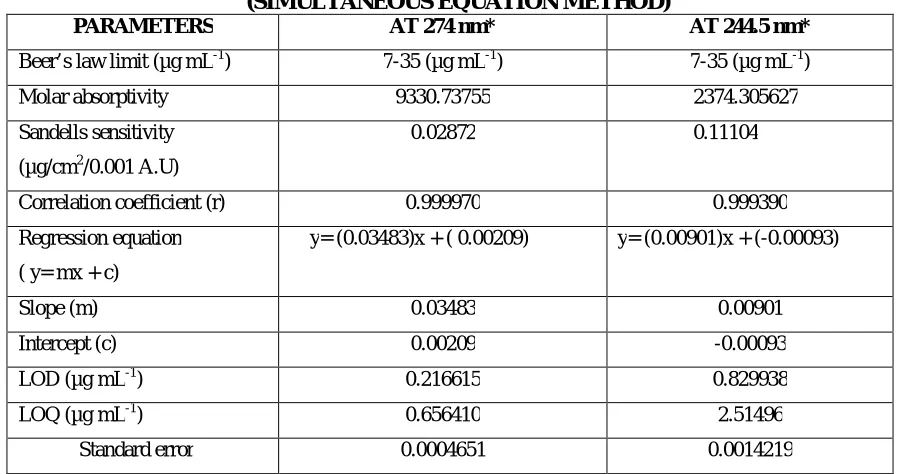
6.1.1. Simultaneous Equation Method
6.1.2. Absorbance Correction Method
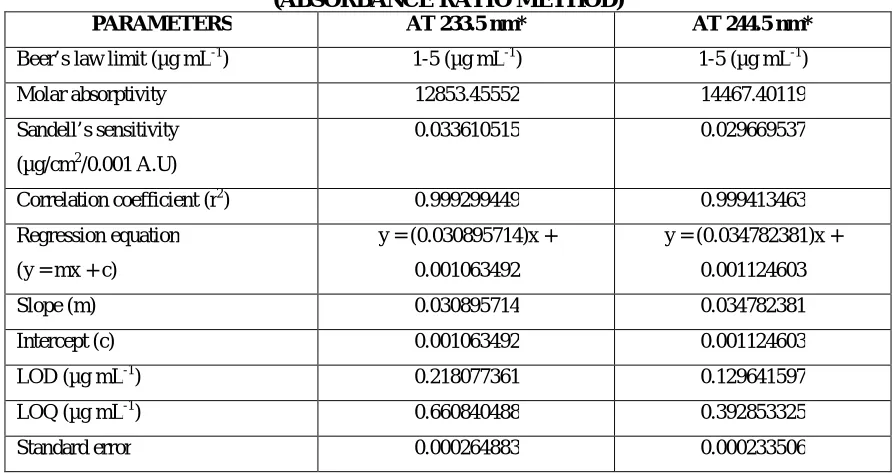
6.1.3. Absorbance Ratio Method
114
115
118
120
6.2 Reverse Phase High Performance Liquid Chromatography
Method for Doxofylline and Ambroxol Hydrochloride
combination dosage form
121
6.3 UV Spectroscopic Methods for Metolazone and
Spironolactone combination dosage form
6.3.1. Simultaneous Equation Method
6.3.2. Absorbance Correction Method
6.3.3. Derivative Spectroscopic Method
125
126
128
131
6.4 Reverse Phase High Performance Liquid Chromatography
Method for Metolazone and Spironolactone combination dosage
form
6.5 UV Spectroscopic methods for Metoprolol and Olmesartan
combination dosage form.
6.5.1 Simultaneous Equation Method
6.5.2 Area Under the Curve Method
6.5.3 Derivative Spectroscopic Method
136
137
141
144
6.6 UV Spectroscopic methods for Aspirin and Rosuvastatin
combination dosage form.
6.6.1 Simultaneous Equation Method
6.6.2 Absorbance Ratio Method
148
149
151
7. SUMMARY AND CONCLUSION 153-163
7.1. UV Spectroscopic methods for Doxofylline and Ambroxol
Hydrochloride
153
7.2. Reverse Phase High Performance Liquid Chromatography
method for Doxofylline and Ambroxol Hydrochloride
155
7.3. UV Spectroscopic methods for Metolazone and
Spironolactone
156
7.4. Reverse Phase High Performance Liquid Chromatography
method for Metolazone and Spironolactone
157
7.5. UV Spectroscopic methods for Metoprolol and Olmesartan 159
7.6 UV Spectroscopic methods for Aspirin and Rosuvastatin 162
8. IMPACT OF THE STUDY 164
9. APPENDIX List of figures
List of tables
Copies of research articles
LIST OF FIGURES FIGURE
NO.
SUBJECT
1 UV spectrum of Doxofylline in distilled water
2 UV spectrum of Ambroxol Hydrochloride in distilled water
3 Overlaid spectrum of Doxofylline and Ambroxol Hydrochloride in distilled
water
4 Calibration curve of Doxofylline in distilled water at 244.5 nm
5 Calibration curve of Doxofylline in distilled water at 274 nm
6 Calibration curve of Ambroxol Hydrochloride in distilled water at 244.5 nm
7 Calibration curve of Ambroxol Hydrochloride in distilled water at 274 nm
8 Overlaid spectrum of Doxofylline and Ambroxol Hydrochloride (Absorbance
Correction Method)
9 Calibration curve of Ambroxol Hydrochloride in distilled water at 308 nm
10 Overlaid spectrum of Doxofylline and Ambroxol Hydrochloride
(Absorbance Ratio Method)
11 Calibration curve of Doxofylline in distilled water at 233.5 nm
12 Calibration curve of Ambroxol Hydrochloride in distilled water at 233.5 nm
13 Linearity chromatogram of Doxofylline and Ambroxol Hydrochloride
(7, 0.5 µg ml-1)- First Set [1/3]
14 Linearity chromatogram of Doxofylline and Ambroxol Hydrochloride
(14, 1 µg ml-1)- First Set [1/3]
15 Linearity chromatogram of Doxofylline and Ambroxol Hydrochloride
(21, 1.5 µg ml-1)- First Set [1/3]
16 Linearity chromatogram of Doxofylline and Ambroxol Hydrochloride
(28, 2 µg ml-1)- First Set [1/3]
17 Linearity chromatogram of Doxofylline and Ambroxol Hydrochloride
(35, 2.5 µg ml-1)- First Set [1/3]
18 Calibration curve of Doxofylline by RP-HPLC
19 Calibration curve of Ambroxol Hydrochloride by RP-HPLC
22 Chromatogram for analysis of formulation [SYNASMA-AX] Repeatability-3 23 Chromatogram for analysis of formulation [SYNASMA-AX] Repeatability-4 24 Chromatogram for analysis of formulation [SYNASMA-AX] Repeatability-5 25 Chromatogram for analysis of formulation [SYNASMA-AX] Repeatability-6 26 Chromatogram for 80% recovery of formulation [SYNASMA-AX]
27 Chromatogram for 100% recovery of formulation [SYNASMA-AX] 28 Chromatogram for 120% recovery of formulation [SYNASMA-AX]
29 UV spectrum of Metolazone in methanol
30 UV spectrum of Spironolactone in methanol
31 Overlaid spectrum of Metolazone and Spironolactone in methanol
32 Calibration curve of Metolazone in methanol at 236.5 nm
33 Calibration curve of Metolazone in methanol at 242.5 nm
34 Calibration curve of Spironolactone in methanol at 236.5 nm
35 Calibration curve of Spironolactone in methanol at 242.5 nm
36 Overlaid spectrum of Metolazone and Spironolactone (Absorbance Correction
Method)
37 Calibration curve of Metolazone in methanol at 345 nm
38 First order derivative UV spectrum of Metolazone in methanol (Derivative
Spectroscopic Method)
39 First order derivative UV spectrum of Spironolactone in methanol (Derivative
Spectroscopic Method)
40 Overlaid first order derivative spectrum of Metolazone and Spironolactone in
methanol (Derivative Spectroscopic Method)
41 Calibration curve of Metolazone at 289 nm (Derivative Spectroscopic Method)
42 Calibration curve of Spironolactone at 266 nm (Derivative Spectroscopic
Method)
43 Linearity chromatogram of Metolazone and Spironolactone (0.5, 5 µg ml-1 )-First Set [1/3]
44 Linearity chromatogram of Metolazone and Spironolactone (1, 10 µg ml-1)- First Set [1/3]
46 Linearity chromatogram of Metolazone and Spironolactone (2.0, 20 µg ml-1)- First Set [1/3]
47 Linearity chromatogram of Metolazone and Spironolactone (2.5, 25 µg ml-1)- First Set [1/3]
48 Calibration curve of Metolazone by RP-HPLC
49 Calibration curve of Spironolactone by RP-HPLC
50 Chromatogram for analysis of formulation [METOLACTONE-5]
Repeatability -1
51 Chromatogram for analysis of formulation [METOLACTONE-5]
Repeatability -2
52 Chromatogram for analysis of formulation [METOLACTONE-5]
Repeatability -3
53 Chromatogram for analysis of formulation [METOLACTONE-5]
Repeatability-4
54 Chromatogram for analysis of formulation [METOLACTONE-5]
Repeatability-5
55 Chromatogram for analysis of formulation [METOLACTONE-5]
Repeatability-6
56 Chromatogram for 80% recovery of formulation [METOLACTONE-5]
57 Chromatogram for 100% recovery of formulation [METOLACTONE-5]
58 Chromatogram for 120% recovery of formulation [METOLACTONE-5]
59 UV spectrum of Metoprolol in methanol
60 UV spectrum of Olmesartan in methanol
61 Overlaid spectrum of Metoprolol and Olmesartan in methanol
62 Calibration curve of Metoprolol in methanol at 223.5 nm
63 Calibration curve of Metoprolol in methanol at 256.5 nm
64 Calibration curve of Olmesartan in methanol at 223.5 nm
65 Calibration curve of Olmesartan in methanol at 256.5 nm
66 Overlaid spectrum of Metoprolol and Olmesartan in methanol (Area Under the
Curve Method)
67 Calibration curve of Metoprolol in methanol at 218-228 nm (Area Under the
68 Calibration curve of Metoprolol in methanol at 246-266 nm (Area Under the
Curve Method)
69 Calibration curve of Olmesartan in methanol at 218-228 nm (Area Under the
Curve Method)
70 Calibration curve of Olmesartan in methanol at 246-266 nm (Area Under the
Curve Method)
71 First order derivative UV spectrum of Metoprolol in methanol (Derivative
Spectroscopic Method)
72 First order derivative UV spectrum of Olmesartan in methanol (Derivative
Spectroscopic Method)
73 Overlaid first order derivative spectrum of Metoprolol and Olmesartan in
methanol (Derivative Spectroscopic Method)
74 Calibration curve of Metoprolol at 256 nm (Derivative Spectroscopic Method)
75 Calibration curve of Olmesartan at 243 nm (Derivative Spectroscopic Method)
76 UV spectrum of Aspirin in methanol
77 UV spectrum of Rosuvastatin in methanol
78 Overlaid spectrum of Aspirin and Rosuvastatin in methanol
79 Calibration curve of Aspirin in methanol at 294.5 nm
80 Calibration curve of Aspirin in methanol at 243 nm
81 Calibration curve of Rosuvastatin in methanol at 294.5 nm
82 Calibration curve of Rosuvastatin in methanol at 243 nm
83 Overlaid spectrum of Aspirin and Rosuvastatin (Absorbance Ratio Method)
84 Calibration curve of Aspirin in methanol at 229.8 nm
LIST OF TABLES TABLE
NO.
SUBJECT
1 Solubility profile of Doxofylline and Ambroxol Hydrochloride in polar and non
polar solvents
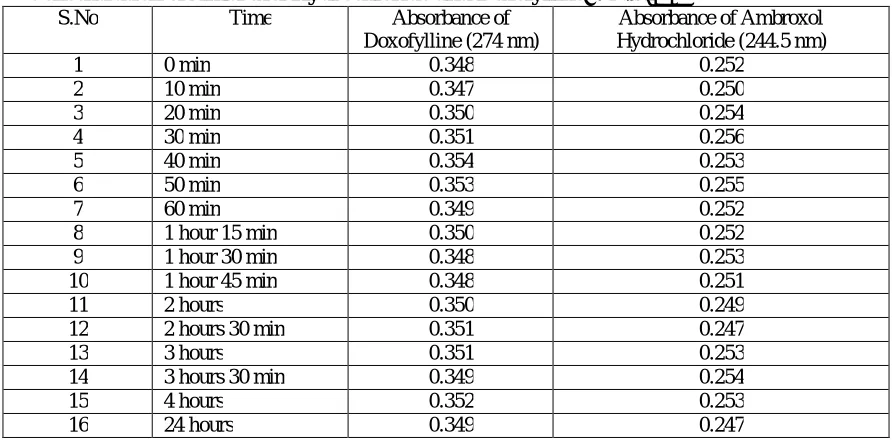
2 Stability study of Doxofylline and Ambroxol Hydrochloride for UV
Spectroscopic methods
3 Optical characteristics of Doxofylline (Simultaneous Equation Method)
4 Optical characteristics of Ambroxol Hydrochloride (Simultaneous Equation
Method)
5 Quantification of formulation [SYNASMA-AX] (Simultaneous Equation
Method)
6 Intraday and interday analysis of formulation [SYNASMA-AX] (Simultaneous
Equation Method)
7 Ruggedness study of formulation [SYNASMA-AX] (Simultaneous Equation
Method)
8 Recovery study data of 50% pre-analysed formulation [SYNASMA-AX]
(Simultaneous Equation Method)
9 Optical characteristics of Doxofylline (Absorbance Correction Method)
10 Optical characteristics of Ambroxol Hydrochloride (Absorbance Correction
Method)
11 Quantification of formulation [SYNASMA-AX] (Absorbance Correction
Method)
12 Intraday and interday analysis of formulation [SYNASMA-AX] (Absorbance
Correction Method)
13 Ruggedness study of formulation [SYNASMA-AX] (Absorbance Correction
Method)
14 Recovery study data of 50% pre-analysed formulation [SYNASMA-AX]
(Absorbance Correction Method)
15 Optical characteristics of Doxofylline (Absorbance Ratio Method)
17 Quantification of formulation [SYNASMA-AX] (Absorbance Ratio Method)
18 Intraday and interday analysis of formulation [SYNASMA-AX] (Absorbance
Ratio Method)
19 Ruggedness study of formulation [SYNASMA-AX] (Absorbance Ratio Method)
20 Recovery study data of 50% pre-analysed formulation [SYNASMA-AX]
(Absorbance Ratio Method)
21 System suitability parameters for the optimized chromatogram of Doxofylline
and Ambroxol Hydrochloride in RP-HPLC method
22 Stability study of Doxofylline and Ambroxol Hydrochloride for RP-HPLC
method
23 Optical characteristics of Doxofylline and Ambroxol Hydrochloride in
RP-HPLC method
24 Quantification of formulation [SYNASMA-AX] by RP-HPLC method
25 Recovery study data of 50% pre-analysed formulation [SYNASMA-AX] by
RP-HPLC method
26 Intraday and interday analysis of formulation [SYNASMA-AX] by RP-HPLC
method
27 Solubility profile of Metolazone and Spironolactone in polar and non polar
solvents
28 Stability study of Metolazone and Spironolactone for UV spectroscopic methods
29 Optical characteristics of Metolazone (Simultaneous Equation Method)
30 Optical characteristics of Spironolactone (Simultaneous Equation Method)
31 Quantification of formulation [METOLACTONE-5] (Simultaneous Equation
Method)
32 Intraday and interday analysis of formulation [METOLACTONE-5]
(Simultaneous Equation Method)
33 Ruggedness studyof formulation [METOLACTONE-5] (Simultaneous Equation
Method)
34 Recovery study data of 50% pre-analysed formulation [METOLACTONE-5]
(Simultaneous Equation Method)
36 Optical characteristics of Spironolactone (Absorbance Correction Method)
37 Quantification of formulation [METOLACTONE-5] (Absorbance Correction
Method)
38 Intraday and interday analysis of formulation [METOLACTONE-5]
(Absorbance Correction Method)
39 Ruggedness study of formulation [METOLACTONE-5] (Absorbance Correction
Method)
40 Recovery study data of 50% pre-analysed formulation [METOLACTONE-5]
(Absorbance Correction Method)
41 Optical characteristics of Metolazone and Spironolactone (First Order Derivative
Method)
42 Quantification of formulation [METOLACTONE-5] (First Order Derivative
Method)
43 Intraday and interday analysis of formulation [METOLACTONE-5] (First Order
Derivative Method)
44 Ruggedness study of formulation [METOLACTONE-5] (First Order Derivative
Method)
45 Recovery study data of 50% pre-analysed formulation [METOLACTONE-5]
(First Order Derivative Method)
46 System suitability parameters for the optimized chromatogram of Metolazone
and Spironolactone in RP - HPLC method
47 Stability study of Metolazone and Spironolactone for RP-HPLC method
48 Optical characteristics of Metolazone and Spironolactone in RP-HPLC method
49 Quantification of formulation [METOLACTONE-5] by RP-HPLC method
50 Recovery study data of 50 % pre-analysed formulation
[METOLACTONE-5] by RP-HPLC method
51 Intraday and interday analysis of formulation [METOLACTONE-5] by
RP-HPLC method
52 Solubility profile of Metoprolol and Olmesartan in polar and non polar solvents
53 Stability study of Metoprolol and Olmesartan for UV spectroscopic methods
54 Optical characteristics of Metoprolol (Simultaneous Equation Method)
55 Optical characteristics of Olmesartan (Simultaneous Equation Method)
57 Quantification of formulation [OLMESAR-M] (Simultaneous Equation Method)
58 Quantification of formulation [OLMAX-M] (Simultaneous Equation Method)
59 Intraday and interday analysis of formulation [OLSAR-M 25] (Simultaneous
Equation Method)
60 Intraday and interday analysis of formulation [OLMESAR-M] (Simultaneous
Equation Method)
61 Intraday and interday analysis of formulation [OLMAX-M] (Simultaneous
Equation Method)
62 Ruggedness study of formulation [OLSAR-M 25] (Simultaneous Equation
Method)
63 Ruggedness study of formulation [OLMESAR-M] (Simultaneous Equation
Method)
64 Ruggedness study of formulation [OLMAX-M] (Simultaneous Equation
Method)
65 Recovery study data of 50% pre-analysed formulation [OLSAR-M 25]
(Simultaneous Equation Method)
66 Recovery study data of 50% pre-analysed formulation [OLMESAR-M]
(Simultaneous Equation Method)
67 Recovery study data of 50% pre-analysed formulation [OLMAX-M]
(Simultaneous Equation Method)
68 Optical characteristics of Metoprolol (Area Under the Curve Method)
69 Optical characteristics of Olmesartan (Area Under the Curve Method)
70 Quantification of formulation [OLSAR-M 25] (Area Under the Curve Method)
71 Quantification of formulation [OLMESAR-M] (Area Under the Curve Method)
72 Quantification of formulation [OLMAX-M] (Area Under the Curve Method)
73 Intraday and interday analysis of formulation [OLSAR-M 25] (Area Under the
Curve Method)
74 Intraday and interday analysis of formulation [OLMESAR-M] (Area Under the
Curve Method)
75 Intraday and interday analysis of formulation [OLMAX-M] (Area Under the
Curve Method)
76 Ruggedness study of formulation [OLSAR-M 25] (Area Under the Curve
77 Ruggedness study of formulation [OLMESAR-M] (Area Under the Curve
Method)
78 Ruggedness study of formulation [OLMAX-M] (Area Under the Curve Method)
79 Recovery study data of 50% pre-analysed formulation [OLSAR-M 25] (Area
Under the Curve Method)
80 Recovery study data of 50% pre-analysed formulation [OLMESAR-M] (Area
Under the Curve Method)
81 Recovery study data of 50% pre-analysed formulation [OLMAX-M] (Area
Under the Curve Method)
82 Optical characteristics of Metoprolol and Olmesartan (First Order Derivative
Method)
83 Quantification of formulation [OLSAR-M 25] (First Order Derivative Method)
84 Quantification of formulation [OLMESAR-M] (First Order Derivative Method)
85 Quantification of formulation [OLMAX-M] (First Order Derivative Method)
86 Intraday and interday analysis of formulation [OLSAR-M 25] (First Order
Derivative Method)
87 Intraday and interday analysis of formulation [OLMESAR-M] (First Order
Derivative Method)
88 Intraday and interday analysis of formulation [OLMAX-M] (First Order
Derivative Method)
89 Ruggedness study of formulation [OLSAR-M 25] (First Order Derivative
Method)
90 Ruggedness study of formulation [OLMESAR-M] (First Order Derivative
Method)
91 Ruggedness study of formulation [OLMAX-M] (First Order Derivative Method)
92 Recovery study data of 50% pre-analysed formulation [OLSAR-M 25] (First
Order Derivative Method)
93 Recovery study data of 50% pre-analysed formulation [OLMESAR-M] (First
Order Derivative Method)
94 Recovery study data of 50% pre-analysed formulation [OLMAX-M] (First Order
Derivative Method)
95 Solubility profile of Aspirin and Rosuvastatin calcium in polar and non polar
96 Stability study of Aspirin and Rosuvastatin calcium for UV spectroscopic
methods
97 Optical characteristics of Aspirin (Simultaneous Equation Method)
98 Optical characteristics of Rosuvastatin Calcium (Simultaneous Equation
Method)
99 Quantification of formulation [ROZUCOR ASP-10] (Simultaneous Equation
Method)
100 Intraday and interday analysis of formulation [ROZUCOR ASP-10]
(Simultaneous Equation Method)
101 Ruggedness study of formulation [ROZUCOR ASP-10] (Simultaneous Equation
Method)
102 Recovery study data of 50% pre-analysed formulation [ROZUCOR ASP-10]
(Simultaneous Equation Method)
103 Optical characteristics of Aspirin (Absorbance Ratio Method)
104 Optical characteristics of Rosuvastatin Calcium (Absorbance Ratio Method)
105 Quantification of formulation [ROZUCOR ASP-10] (Absorbance Ratio Method)
106 Intraday and interday analysis of formulation [ROZUCOR ASP-10]
(Absorbance Ratio Method)
107 Ruggedness study of formulation [ROZUCOR ASP-10] (Absorbance Ratio
Method)
108 Recovery study data of 50% pre-analysed formulation [ROZUCOR ASP-10]
LIST OF ABBREVIATIONS
ICH - International Conference on Harmonisation
λ - Lambda
LOD - Limit of Detection
LOQ - Limit of Quantitation
g/ml - Microgram Per Millilitre ml - Millilitre
nm - Nanometer
pH - Negative Logarithm of Hydrogen Ion
% - Percentage
% RSD - Percentage Relative Standard Deviation
HPLC - High Performance Liquid Chromatography
Rt - Retention Time
S.D. - Standard Deviation
%RSD - Percentage Relative Standard Deviation
S.E. - Standard Error
IR - Infra Red
°
C - Degree Celsius
l - Microlitre
min - Minute
ml/min - Millilitre/minute
HCl - Hydrochloric acid
AMB - Ambroxol
DOX - Doxofylline
MET - Metolazone
SPIR - Spironolactone
METO - Metoprolol
OLME - Olmesartan
ASP - Aspirin
1
1. INTRODUCTION
1.1 INTRODUCTION TO ANALYTICAL CHEMISTRY1
Analytical Chemistry constitutes both theoretical and practical science and it is practical
in a large number of laboratories in many different ways. The analytical procedure is the
technique of performing the analysis. Analytical method validation is indeed necessary
for herbal procedure, new process and reaction, new molecules, active ingredients,
residues, impurity profiling and component of interest in different matrices. An analytical
methodology comprises of the techniques, method, procedure and protocol. This
methodology includes the required data for a given analytical problem, necessary
sensitivity, requisite accuracy, mandatory range of analysis and requisite precision to the
Analyst.
1.2 WHY VALIDATION ANALYTICAL PROCEDURE2
There are many reasons to validate analytical procedures. Among them are regulatory
requirements, good science, and quality control requirement. The Code of Federal
Regulations (CFR) 311.165c explicitly states that “accuracy, sensitivity, specificity, and
reproducibility of test methods employed by the firm shall be established and
documented”. Of course as Scientists we would want to apply good science to
demonstrate that the analytical method used had demonstrated accuracy, sensitivity,
specificity and reproducibility. Finally the management methods had demonstrated uses
to release its product are properly validated for its intended use so the product will be safe
for human use. Analytical methods need to be validated, verified or revalidated in the
following instances.
2
When transferred to another laboratory
Whenever the conditions or method parameters for which the method has been
validated change.
1.3 PROCESS OF ANALYTICAL METHOD VALIDATION
Process of the analytical method validation is listed below:
1. Preparation of the development on the method validation programme
2. To write the method validation protocol and get the approval
3. Implementation of the method validation protocol
4. Investigation of the method validation data
5. Reporting the analytical method validation
6. Finalizing the analytical method procedure
1.4 ICH GUIDELINES FOR ANALYTICAL METHOD VALIDATION3,4
Method validation is the way to authenticate that the analytical procedure applied for a
specific test is appropriate for its intended purpose. Methods need to be validated or
revalidated. The International Conference of Harmonization (ICH) of technical
requirements for the registration of pharmaceutical for human use has developed and
provided a consensus text on validation of analytical procedures.
The parameters as defined by the ICH and by other organizations
Specificity
Selectivity
Precision
Repeatability
3
Reproducibility
Accuracy
Linearity
Range
Limit of detection
Limit of quantitation
Robustness
Ruggedness
1. 4.1. SPECIFICITY
Specificity is the ability to assess unequivocally the analyte in the presence of
components which may be expected to present. An investigation of specificity should be
conducted during the validation of identification tests, the determination of impurities and
assay.
1.4.2. ACCURACY
The accuracy of an analytical procedure expresses the closeness of agreement between
the value which is accepted either as a conventional true value or on an accepted
reference value and the value found.
1.4.3. PRECISION
The precision of an analytical procedure expresses the closeness of the agreement
between a series of measurements obtained from multiple sampling of same
homogeneous sample under the prescribed conditions. Validation of tests for assay and
4 Repeatability (Intra- assay precision)
Express the precision under small operating conditions over a short interval of time. It
should be assessed using a minimum of nine determinations.
Intermediate Precision
The extent to which intermediate precision should be established depends on the
circumstances under which the procedure is intended to be used. Typical validation to be
studied includes days, Analysts, equipments, etc.
Reproducibility
Reproducibility measures the precision between laboratories. Reproducibility should be
considered in case of the standardization of an analytical procedure, for insistence
inclusion of procedure in Pharmacopoeias.
1.4.4. LINEARITY
Linearity of an analytical procedure is its ability (within a given range) to obtain test
results which are directly proportional to the concentration (amount) of analyte sample.
1.4.5. RANGE
Range of an analytical procedure is the interval between the upper and lower
concentration of analyte in the sample including these concentrations for which it has
been demonstrated that the analytical procedure has a suitable level of precision,
accuracy and linearity.
1.4.6. LIMIT OF DETECTION
The detection limit is determined by the analysis of samples with known concentration of
analyte and by establishing that minimum level at which the analyte can reliably detected.
5 b. Based on signal-to-noise ratio
c. Based on the standard deviation of the response and the slope
Based on the standard deviation of blank
Based on the calibration graph 1.4.7. LIMIT OF QUANTITATION
The quantitation limit is generally determined by the analysis of samples with the known
concentrations of analyte and by establishing the minimum value at which the analyte can
be quantified with acceptable accuracy and precision
a. Based on visual evaluation
b. Based on Signal-to- Noise ratio
c. Based on the tandard deviation of the response and the slope
Based on the standard deviation of blank
Based on the calibration graphs 1.4.8. ROBUSTNESS
The evaluation of robustness should be considered during the development phase and
depends on the type of procedure under study. It shows the reliability of an analysis with
respect to deliberate variations in the method parameters.
1.4.9. RUGGEDNESS
The USP define ruggedness as the degree of reproducibility of test results obtained by the
analysis of the same sample under a variety of normal test conditions such as different
laboratories, different analysis, different lots of reagents etc. Ruggedness is a measure of
reproducibility of test results under normal expected operational conditions from
6 1.5. SYSTEM SUITABILITY TESTS5
System suitability tests are an integral part of Gas and Liquid Chromatography. They are
used to verify that the resolution and reproducibility of the chromatographic system and
are adequate for the analysis to be done. These tests are based on the concept that the
equipment, electronics, analytical operations, samples to be analyzed and constitute an
integral system that can be evaluated as such.
There are numerous guidelines which detail the expected limits for typical
chromatographic methods. In the current FDA guideline on “Validation of
Chromatographic Methods” the following acceptance limits are proposed as initial
criteria.
1.5.1. Capacity Factor (K')
It is the measure of a sample peak in the chromatogram being specific for a given
compound, a parameter which specifies the delay of a substance to be separated.
K' = t-1/ta Where,
t = retention time measured from time of injection to time of elution of peak maximum.
ta = retention time of non retarded component, air with thermal conductivity detection. Limit = generally the value of K' is > 2
1.5.2. Resolution (Rs)
The resolution Rs is a function of column efficiency N and is specified to ensure that
closely eluting compounds are resolved from each other to establish the general resolving
power of the system and to ensure that internal standards are resolved from the drug.
7
Where t1 and t2 = retention times of first and second adjacent bands.
Limit = Rs of >2 between the peak of interest and the closest potential interfering peak is
desirable.
1.5.3. Tailing Factor (T)
The tailing factor T, a measure of peak symmetry, is unity for perfectly symmetrical
peaks and its value increases as tailing becomes more pronounced.
In some cases, values less than unity may be observed. As peak asymmetry increases,
integration, and hence precision becomes less reliable.
T = W0.05/ 2f
Where W0.05 = width of peak at 5% height
f = Distance from the peak maximum to the leading edge of the peak, the distance being
measured at a point 5% of the peak height from the baseline.
Limit: ≤ 2 is preferable.
1.5.4. Theoretical plates (N)
The number of theoretical plates, N is a measure of column efficiency. For Gaussian
peaks, it is calculated by the equations.
N = 16(t / w)2 or N = 5.54(t / W1/2)2 Where
t = retention time of substance.
w = width of the peak at its base, obtained by extrapolating the relatively straight sides of
the peak to the baseline.
8
The value of ‘N’ depends upon the substance being chromatographed as well as the
operating conditions such as mobile phase, temperature etc.
Limit = N > 2000 is desirable.
1.6 ULTRA VIOLET SPECTROSCOPY6
Ultraviolet spectroscopy deals with the measurement of energy absorbed when electrons
are promoted to higher energy state. On passing electromagnetic radiation in the
ultraviolet and visible regions through the compound with multiple bonds, a portion of
the radiation is normally absorbed by the compound. The amount of absorption depends
on the wavelength of the radiation and the structure of the compound. Absorption of the
electromagnetic radiation in the visible and ultraviolet region of spectrum results in
changes of electronic structure of ions and molecules.
9
Optical Diagram of a Double Beam UV-Visible Spectrophotometer
Quantitative Spectrophotometric Assay of Medicinal Substances
1. Use of a standard absorptivity value
2. Use of a calibration graph
3. Single-or double-point standardization
Methods of Multicomponent Analysis using UV-Visible Spectrophotometer7
1. Simultaneous Equation Method
2. Absorbance Ratio or Q-analysis method.
3. Simultaneous equation using area under curve method
4. Derivative Spectroscopy
5. Two-Wavelength method
6. Using multicomponent mode
7. Absorbance Correction Method
8. Geometric Correction Method
10 Derivative Spectroscopy
The UV-Visible spectra consist of increasing or decreasing absorbance as a function of wavelength, A=f(λ): Zero Order
In derivative Spectroscopy the first or higher derivative of absorbance or transmittance with respect to wavelength is recorded versus the wavelength
1.7 HIGH PERFORMANCE LIQUID CHROMATOGRAPHY8
HPLC is a form of liquid chromatography to separate compounds that are
dissolved in solution. HPLC instrument consists of four basic parts
The column
Detector
Injection system and Mobile-phase pump system
11 1.7.1 Principle of Separation in HPLC9
Normal phase chromatography
Mechanism: Retention by interaction of the stationary phase’s polar surface with polar
parts of the sample molecules.
Stationary phase: SiO2, Al2O3, -NH2, -CN, -Diol, -NO2.
Mobile phase: Hectane, Hexane, Cyclohexane, CHCl3, CH2Cl2, Dioxane, Methanol. Application: Separation of non-ionic, non-polar to medium polar substances.
Reverse phase chromatography
Mechanism: Retention by interaction of the stationary phase’s non-polar hydrocarbon
chain with non-polar parts of the sample molecules.
Stationary Phase: n-octadecyl (RP-18), n-octyl (RP-8), ethyl (RP-2), phenyl,
(CH2) n -CN, (CH2) n-diol.
Mobile phase: Methanol or Acetonitrile/Water or Buffer (sometimes with additives of
THF or Dioxane)
(Rule of thumb: Increase of water content by 10% results in doubling the K' value.)
Application: Separation of non-ionic and ion forming non-polar to medium polar
substances (carboxylic acids -> hydrocarbons). If ion forming substances (as carboxylic
Aim
&
12
2. AIM AND OBJECTIVES OF THE STUDY
The combined dosage forms selected for the present study are Doxofylline & Ambroxol
Hydrochloride, Metolazone & Spironolactone, Metoprolol & Olmesartan Medoxomil and
Aspirin & Rosuvastatin in tablets/capsules. These combinations have recently entered into the
market.
Doxofylline & Ambroxol combination is used as an Antiasthmatic agent.
Metolazone & Spironolactone combination is used as a Diuretic agent.
Metoprolol & Olmesartan combination is used as an Antihypertensive agent.
Aspirin & Rosuvastatin combination is used in Cardiovascular diseases.
In the view of the literature cited for the quantification of above mentioned combination of
drugs, it was found that the methods for the estimation of Doxofylline, Ambroxol
Hydrochloride, Metolazone, Spironolactone, Metoprolol Succinate, Olmesartan Medoxomil,
Aspirin & Rosuvastatin in tablets/capsules individually and in combination with other drugs
were available. No method available for the simultaneous estimation of the combined
dosage forms with the solvents employed for the analytical studies.
Hence in the present work, the aim is to develop a simple, precise and accurate methods for
the estimation of Doxofylline & Ambroxol Hydrochloride, Metolazone & Spironolactone,
Metoprolol Succinate & Olmesartan and Aspirin & Rosuvastatin in bulk and in combined
Pharmaceutical Dosage form and to validate the developed methods by UV
Spectrophotometry, Reverse Phase High-Performance Liquid Chromatography or by both
Review
of
13
3.1 DRUG PROFILE
3.1.1. DOXOFYLLINE5,10,11,12
Chemical Structure
N
N N N
O O O
O
CH3 C
H3
Chemical name
7-(1, 3-Dioxolan-2-yl methyl)-3, 7-dihydro-1, 3-dimethyl-1H-Purine-2, 6-Dione.
Molecular formula
C11H14N4O4 Molecular weight
266.26
Category
Anti-asthmatic
Description
White crystalline powder
Solubility
Soluble in water, acetone, ethyl acetate, benzene, chloroform, dioxane, hot methanol and
hot ethanol; Practically insoluble in ethyl ether or petroleum ether.
Identification
14 Standard value Observed average value*
144 ºC – 145.5ºC 145ºC
*Average of six observations
2. Infra red spectrum
Storage
Store in a cool, dark and dry place
Indication
Doxofylline is primarily indicated for Bronchial asthma, Bronchospasm and Chronic
asthmatic bronchitis.
Mode of action:
Doxofylline is methyl xanthine derivatives and plays the direct role in relaxation of
bronchial smooth muscle and thus acts as bronchodilator.
Doxofylline is the inhibitor of Phosphodiesterase and thus increases the intracellular level
of cyclic-3’,5’-adenosine monophosphate (cAMP) which produce bronchodilation and
15 Pharmacokinetics
Plasma protein binding is 48%. Renal excretion accounts for less than 4% and plasma
half life is 7.42 hours.
Adverse Reaction
Nausea, vomiting, epigastric pain, cephalalgia, irritability, insomnia, tachycardia,
extrasystole, tachypnea, hyperglycemia, albuminuria.
Contraindication
Doxofylline is contraindicated in conditions like Acute Myocardial infarction,
Hypersensitivity to xanthine derivatives.
Route of administration
1. It is given by mouth in doses upto 1200 mg daily
2. It may also be given by slow intravenous injection
Special Precaution:
Liver disease, Congestive Heart Failure, Chronic Obstructive Lung Disease, Concomitant
Infections.
3.1.2 AMBROXOL HYDROCHLORIDE5,10,11,12
Chemical Structure
NH2 NH
OH Br
Br
.HCl
Chemical Name
16 Molecular formula
C13H18Br2N2O.HCl Molecular weight
414.6
Category
Mucolytic agent; Expectorant
Description
A white or yellowish crystalline powder
Solubility
Sparingly soluble in water; Soluble in methanol and practically insoluble in methylene
chloride
pH
A 1% solution in water has a pH of 4.5 to 6.0
Standard
Ambroxol Hydrochloride contains not less than 99.0% and not more than 101.0% of
C13H18Br2N2O, calculated on the dried basis LOD
NMT 0.5%, determined on 1.0 gm by drying in an oven at 105°C
Assay
Dissolve 0.3 gm in 70 ml of ethanol. Titrate with 0.1 M NaOH, determining the end point
potentiometrically. Carry out blank. 1 ml of 0.1 M NaOH is equivalent to 0.04146 gm of
17 Melting point
Standard value Observed average value* 232 ºC -234ºC 233ºC
Average of six observations
Storage
1. Protect from light. Following reconstitution, aliquot and freeze at -20°C. This product
is stable for 2 years as supplied
2. Stock solutions are stable for 4 months at -20°C
Indication:
It is primarily indicated in conditions like Bronchitis, Chronic bronchitis, Cystic fibrosis
Mode of action
The substance is a mucoactive drug with several properties including secretolytic and
secretomotoric actions that restore the physiological clearance mechanisms of the
respiratory tract which play an important role in the body’s natural defense mechanisms.
It stimulates synthesis and release of surfactant by type II pneumocytes. Surfactants act as
an anti-glue factor by reducing the adhesion of mucus to the bronchial wall, in improving
its transport and in providing protection against infection and irritating agents.
Adverse drug reaction
The symptomatic adverse reactions produced by Ambroxol HCl are more or less tolerable
and if they become severe, they can be tolerated symptomatically, these include
18 Overdosage
No symptoms of over dosage have been reported in man due to date. If they occur,
symptomatic treatment should be provided.
Drug Interactions
1. Administration of Ambroxol together with antibiotics (Amoxycillin, Cefuroxime,
Erythromycin, Doxycycline) lead to higher antibiotic concentration in the lung tissue.
2. No clinically relevant unfavourable interaction with other medications has been
reported.
Contraindication
Ambroxol should not be used in patients known to be hypersensitive to Ambroxol or
other components of the formulation.
3.1.3 METOLAZONE5,10,11,12
Chemical Structure
N N H O
C H3
Cl S
O O N H2
CH3 H
Chemical Name
7-chloro-2-methyl-4-oxo-3-o-tolyl-1,2,3,4-tetrahydroquinazoline-6-sulfonamide
Molecular formula
C16H16ClN3O3S Molecular weight
19 Category
Antihypertensive agent;
Diuretic
Description
White or slightly yellowish crystalline powder
Solubility
Sparingly soluble in methanol and more soluble in alkali and organic solvents
pka value
12.23
Loss on drying
Maximum 1.0 per cent, determined on 1.000 g by drying in an oven at 105 °C for 4 h.
Melting Point
252-254°C
Storage
Preserve in tight, light resistant container
Indication:
Metolazone is indicated for the treatment of hypertension, alone or in combination with
other antihypertensive drugs of a different class.
Mode of action:
Metolazone interferes with the renal tubular mechanism of electrolyte reabsorption.
It acts primarily to inhibit sodium reabsorption at the cortical diluting site and to a lesser extent in the proximal convoluted tubule. Sodium and chloride ions are
20
The increased delivery of sodium to the distal tubular exchange site results in increased potassium excretion. Metolazone does not inhibit carbonic anhydrase.
The antihypertensive mechanism of action of Metolazone is not fully understood but is presumed to be related to its saluretic and diuretic properties
Pharmacokinetics
Metolazone is slowly and incompletely absorbed from the gastrointestinal tract. An
average of about 65% of a dose has been reported to be absorbed after oral administration
in healthy subjects, and an average of about 40% in patients with cardiac disease.
About 95% of the drug is bound in the circulation: about 50 to 70% to the red blood cells
and between 15 to 33% to plasma proteins. The half-life has been reported to be 8 to 10
hours in whole blood, and 4 to 5 hours in plasma, but the diuretic effect persists for up to
24 hours or more. About 70 to 80% of the amount of Metolazone absorbed is excreted
unchanged. The remainder is excreted in the bile and some enterohepatic circulation has
been reported. Metolazone crosses the placenta and is distributed into breast milk.
Pharmacodynamics
Metolazone is a quinazoline diuretic, with properties generally similar to the thiazide
diuretics. A proximal action of Metolazone has been shown in humans by increased
excretion of phosphate and magnesium ions and by a markedly increased fractional
excretion of sodium in patients with severely compromised glomerular filtration. This
action has been demonstrated in animals by micropuncture studies.
Adverse drug reactions
21 Overdosage
Symptoms of overdose include difficulty in breathing, dizziness, dizziness on standing
up, drowsiness, fainting, irritation of the stomach and intestines and lethargy leading to
coma.
Drug Interactions
Interacts with digitoxin, digoxin, trandolapril, tenoxicam, etc
Half life
Approximately 14 hours
3.1.4. SPIRONOLACTONE5,10,11,12,13
Chemical structure
CH3 H
H H
O S
O
CH3
C
H3 O
O
Chemical Name
7α-acetylthio-3-oxo-17α -pregn-4-ene- 21,17 β -carbolactone
Molecular formula
C24H32O4S
Molecular weight
416.6
Category
22 Aldosterone Antagonists
Description
Yellowish white to buff coloured powder; Odourless or with a slight odour of thioacetic acid
It exhibits polymorphism Solubility
Freely soluble in chloroform; soluble in ethanol (95%); slightly soluble in ether and
practically insoluble in water
Loss on drying
Not more than 0.5%, determined on 1 gram by drying in an oven at 105oC for 3 hours Specific optical rotation
Between -33o and -37o, determined in a 1% w/v solution in chloroform Identification
1. Melting Point- 134.5°C
2. Infra red spectrum
Storage
23 Indication
Spironolactone is primarily indicated to treat low-renin hypertension, hypokalemia, and
Conn's syndrome.
Mode of action
Spironolactone is a specific pharmacologic antagonist of aldosterone, acting primarily
through competitive binding of receptors at the aldosterone-dependent sodium-potassium
exchange site in the distal convoluted renal tubule. Spironolactone causes increased
amounts of sodium and water to be excreted, while potassium is retained. Spironolactone
acts both as a diuretic and as an antihypertensive drug by this mechanism.
It may be given alone or with other diuretic agents which act more proximally in the renal
tubule. Aldosterone interacts with a cytoplasmic mineralocorticoid receptor to enhance
the expression of the Na+, K+-ATPase and the Na+ channel involved in a Na+ K+ transport in the distal tubule. Spironolactone binds to this mineralcorticoid receptor, blocking the
actions of aldosterone on gene expression. Aldosterone is a hormone; its primary function
is to retain sodium and excrete potassium in the kidneys.
Pharmacokinetics
Spironolactone is rapidly absorbed from the gastrointestinal tract. Food increases the
bioavailability of unmetabolized Spironolactone by almost 100%. Spironolactone and its
metabolites are more than 90% bound to plasma proteins. Rapidly and extensively
metabolized. The metabolic pathway of Spironolactone is complex and can be divided
into two main routes: those in which the sulfur moiety is retained and those in which the
sulfur moiety is removed by dethioacetylation. Spironolactone is transformed to a
24
It also has anti-androgenic activity. The metabolites are excreted primarily in the urine
and secondarily in bile.
Overdosage:
The oral LD50 of Spironolactone is greater than 1,000 mg/kg in mice, rats, and rabbits. Acute overdosage of Spironolactone may be manifested by drowsiness, mental confusion,
maculopapular or erythematous rash, nausea, vomiting, dizziness, or diarrhea.
Spironolactone has been shown to be a tumorigen in chronic toxicity studies in rat.
Half life:
10 minutes
3.1.5. METOPROLOL5,10,11,12
Chemical Structure
CH2CH2OCH3
OCH2CH(OH)CH2NHCH(CH3)2
Chemical name
±-1-(Isopropylamino)-3-[p-(2-methoxyethyl) phenoxy]-2-propanol
Molecular formula
C15H25NO3
Molecular weight
652.81
Categories
Antihypertensive agent
25 Adrenergic beta-Antagonists
Sympatholytics
Antiarrhythmic Agents
Description
White or almost white crystalline powder.
Solubility
Freely soluble in water, soluble in methanol, slightly soluble in alcohol, very slightly
soluble in ethyl acetate.
pH
A 6.5% solution in water has a pH between 7.0 and 7.6
Loss on drying
Maximum 0.5 per cent, determined on 1.000 g by drying in an oven at 105 °C.
Assay
Dissolve 0.250 g in 40 ml of anhydrous acetic acid. Titrate with 0.1 M perchloric acid,
determining the end-point potentiometrically
Identification
1. Melting Point- 136°-137°C
26 Storage
Store in air tight containers at controlled room temperature. Protect from light
Indication
Metoprolol is indicated for the management of acute myocardial infarction, angina
pectoris, heart failure and mild to moderate hypertension. May be used to treat
supraventricular and tachyarrhythmias and as prophylaxis for migraine headaches.
Mode of action
Metoprolol competes with adrenergic neurotransmitters such as catecholamines for
binding at beta (1)-adrenergic receptors in the heart. Beta (1)-receptor blockade results in
a decrease in heart rate, cardiac output, and blood pressure.
Pharmacokinetics
Metoprolol is readily and completely absorbed from the gastrointestinal tract but is subject to considerable first-pass metabolism, with a bioavailability of about 50%.
Peak plasma concentration varies widely and occurs about 1.5-2 hours after a single oral dose. It is moderately lipid-soluble.
Metoprolol is widely distributed; it crosses the blood-brain barrier and the placenta, and is distributed into breast milk. It is about 12% bound to plasma protein.
It is extensively metabolized in the liver, predominantly by the cytochrome P450 isoenzyme CYP2D6, and undergoes oxidative deamination, and aliphatic
hydroxylation.
The metabolites are excreted in the urine together with only small amounts of unchanged Metoprolol. The rate of metabolism by CYP2D6 is determined by genetic
27 Pharmacodynamics
Metoprolol, a competitive, beta1-selective (cardioselective) adrenergic antagonist, is
similar to Atenolol in its moderate lipid solubility, lack of intrinsic sympathomimetic
activity and weak membrane stabilizing activity.
Toxicity:
LD50=5500 mg/kg (orally in rats), toxic effects include bradycardia, hypotension, bronchospasm, and cardiac failure. LD50=2090 mg/kg (orally in mice)
3.1.6 OLMESARTAN MEDOXOMIL10,12,14
Chemical Structure N N CH3 N N N H N CH3 C H3 O H O O O O CH3 O Chemical Name
(5-methyl-2-oxo-2H-1,3-dioxol-4-yl)methyl
4-(2-hydroxypropan-2-yl)-2-propyl-1-({4-[2-(2H-1,2,3,4-tetrazol-5-yl)phenyl]phenyl}methyl)-1H-imidazole-5-carboxylate
Molecular formula
C29H30N6O6
Molecular Weight
28 Category
Antihypertensive Agents
Angiotensin II Type 1 Receptor Blockers
Description
White to off-white crystalline powder
Solubility
Insoluble in water; Sparingly soluble in strong acid; Soluble in strong base.
Identification
1. Melting Point: Standard value 175-180°C
2. IR spectrum
Storage
Store in a tightly closed container in a dry place
Indication
29 Mode of action
Angiotensin II is formed from angiotensin I in a reaction catalyzed by angiotensin
converting enzyme (ACE, kininase II). Angiotensin II is the principal pressor agent of the
renin-angiotensin system, with effects that include vasoconstriction, stimulation of
synthesis and release of aldosterone, cardiac stimulation and renal reabsorption of
sodium. Olmesartan blocks the vasoconstrictor effects of angiotensin II by selectively
blocking the binding of angiotensin II to the AT1 receptor in vascular smooth muscle. Its
action is, therefore, independent of the pathways for angiotensin II synthesis. Olmesartan
has more than a 12,500-fold greater affinity for the AT1 receptor than for the AT2
receptor.
Pharmacokinetics
Olmesartan medoxomil is an ester prodrug that is hydrolysed during absorption from the gastrointestinal tract to the active form Olmesartan. The absolute bioavailability is
approximately 26%.
Peak plasma concentrations of Olmesartan occur about 1 to 2 hours after oral administration.
Volume of distribution is about 17 L. Highly bound to plasma proteins (99%) and does not penetrate red blood cells.
It is excreted in the urine and the bile as Olmesartan; about 35 to 50% of the absorbed dose is excreted in the urine and the remainder in the bile. The terminal elimination
30 Pharmacodynamics
Olmesartan, a specific angiotensin II type 1 antagonist, is used alone or with other
antihypertensive agents to treat hypertension. Unlike the angiotensin receptor antagonist
Losartan, Olmesartan does not have an active metabolite or possess uricosuric effects.
Blockade of the angiotensin II receptor inhibits the negative regulatory feedback of
angiotensin II on renin secretion, but the resulting increased plasma renin activity and
circulating angiotensin II levels do not overcome the effect of Olmesartan on blood
pressure.
Toxicity
Symptoms of overdose include dehydration (dry mouth, excessive thirst, muscle pain or
cramps, nausea and vomiting, weakness), dizziness, low blood pressure, and slow or
irregular heartbeat.
3.1.7. ASPIRIN10,12,13
Acetyl Salicylic Acid
Chemical Structure
Chemical Name
2-acetoxy benzoic acid
Molecular Formula
C9H8O4
Molecular Weight
180.2
C
O OH
O C
CH3
31 Category
Antiplatelet
Analgesic
Antipyretic Description
Colourless crystals or a white crystalline powder; Odourless or almost odourless
Solubility
Slightly Soluble in water; freely soluble in alcohol; and sparingly soluble in absolute
ether
Loss on drying
Not more than 0.5%, determined on 1.0 g by drying over phosphorus pentoxide at a
pressure of 1.5 to 2.5 kPa
Assay
Weigh accurately about 1.5 g, dissolve in 15 ml of ethanol (95%), add 50.0 ml of 0.5 M
sodium hydroxide, boil gently for 10 minutes, cool and titrate the excess of alkali with
0.5 M HCl using phenol red solution as indicator. Repeat the operation without the
substance under examination. The difference between the titrations represents the amount
of sodium hydroxide required.
Melting Point
Standard value-135°C
Storage
32 Indication
Aspirin is indicated for the mild to moderate pain such as Headache, Dysmenorrhoea, Myalgia, and Dental pain
And also indicated in the initial treatment of Angina Pectoris, Myocardial infarction and for the prevention of cerebrovascular disorders such as Stroke.
In the management of pain and inflammation in acute and chronic rheumatoid disorders such as Rheumatoid arthritis, Juvenile idiopathic arthritis, Osteoarthritis,
and Ankylosing spondylitis.
Mode of action
It acts as the inhibitors of the enzyme cyclo-oxygenase, which results in the direct
inhibition of the biosynthesis of Prostaglandins and thrombaxanes from arachidonic acid.
Aspirin also inhibits platelet aggregation: non-acetylated salicylates do not.
Pharmacokinetics
1. Absorption
Aspirin and other salicylates are absorbed rapidly from the gastrointestinal tract when
taken orally but absorption following rectal administration is less reliable. Aspirin and
other salicylates can also be absorbed through the skin. After oral doses, absorption of
non-ionised aspirin occurs in the stomach and intestine. Some aspirin is hydrolysed to
salicylate in the gut wall
2. Distribution
Aspirin is 80 to 90% bound to plasma proteins and is widely distributed. Its volume of
distribution is reported to be 170 ml/kg in adults. As plasma drug concentration increase,
33 3. Metabolism
Salicylates are mainly eliminated by hepatic metabolism. The metabolites include
salicyluric acid, salicyl phenolic glucoronide, salicyl acyl glucoronide, gentisic acid and
gentisuric acid
4. Excretion
Following oral administration, elimination is a first-order process and the
plasma-salicylate half life is about 2 to 3 hours. At high Aspirin doses, the half life increases to
15 to 30 hours. Salicyalte is also excreted unchanged in urine, the amount excreted by
this route increases with increasing dose and also depends on urinary pH. Renal excretion
involves glomerular filtration, active renal tubular secretion and passive tubular
reabsorption
Adverse drug reaction
The most common adverse effects of therapeutic doses of aspirin are gastrointestinal disturbances such as nausea, dyspepsia, and vomiting.
Salicylism characterized by tinnitus, vertigo, decreased hearing and sometimes also nausea and vomiting occurs with overdosage of any salicylate.
Reye’s syndrome, a rare disorder of children that is characterized by hepatic encephalopathy following an acute viral illness and 20-40% mortality.
Salicylate poisoning is a result of disturbances of the acid-base and electrolyte balance in patients with high doses of salicylate-containing drug.
Large doses can cause depression of the respiratory centre.
34
Disturbances of haemostasis as a result of depressed platelet aggregation Overdosage
High doses may precipitate acute haemolytic anaemia in patients with G6PD deficiency.
Aspirin may interfere with insulin and glucagon control in diabetes.
Drug interaction
Aspirin causes potentially hazardous increase in the effect of Warfarin
Aspirin interferes with the uricusoric agents such as Probenecid and Sulfinpyrazone.
Use of Aspirin with Dipyridamole may result in an increase in plasma-salicylate concentration.
Drugs such as Metoclopramide in patients with migraine headache result in earlier absorption of aspirin and higher peak plasma concentration.
Metoprolol may increase peak plasma-salicylate concentrations. Contraindication
It is contraindicated in patients prone to dyspepsia or known to have the lesion of the
gastric mucosa. It should not be given to patients with haemophilia or other haemorrhagic
disorders.
Precaution
Aspirin should be used with caution in patients with asthma or allergic disorders. It
should not be given to patients with a history of sensitivity reactions to aspirin or other
NSAIDs, including those in whom attacks of asthma, angioedema, urticaria, or rhinitis
35 3.1.8. Rosuvastatin Calcium10,12,13
Chemical Structure:
N N
OH OH
O -O F
N SO2CH3 C
H3
2
Ca++
Chemical name
(3R,5S,6E)-7-[4-(4-flurophenyl)-2-(N-methylmethanesulfonamido)-6-(propan-2-yl)pyrimidin-5-yl]-3,5 dihydroxyhept-6-enoic acid calcium
Molecular Formula
(C22H27FN3O6S)2 Ca Molecular Weight
1001.1
Category
Anticholesteremic Agents
HMG-CoA Reductase Inhibitors Description
An off-white to creamish white crystalline powder
Solubility
36 Identification
1. Melting point: Std value-155°C
2. IR Spectrum: IR spectrum of Rosuvastatin Calcium is compared with the standard
values; principal peaks at a wave numbers were identified.
Storage
Store protected from light and moisture
Indication
Used as an adjunct to dietary therapy to treat primary hypercholesterolemia (heterozygous familial and nonfamilial), mixed dyslipidemia and
hypertriglyceridemia.
Also indicated for homozygous familial hypercholesterolemia as an adjunct to other lipid-lowering therapies or when other such therapies are not available.
Mode of action
Rosuvastatin is a competitive inhibitor of HMG-CoA reductase. HMG-CoA reductase
catalyzes the conversion of HMG-CoA to mevalonate, an early rate-limiting step in
cholesterol biosynthesis. Rosuvastatin acts primarily in the liver. Decreased hepatic
cholesterol concentrations stimulate the upregulation of hepatic low density lipoprotein
(LDL) receptors which increases hepatic uptake of LDL. Rosuvastatin also inhibits
hepatic synthesis of very low density lipoprotein (VLDL). The overall effect is a decrease
in plasma LDL and VLDL
In vitro and in vivo animal studies also demonstrate that rosuvastatin exerts


![TABLE-5 QUANTIFICATION OF FORMULATION [SYNASMA-AX]](https://thumb-us.123doks.com/thumbv2/123dok_us/526276.71518/241.612.104.546.80.315/table-quantification-of-formulation-synasma-ax.webp)


![TABLE-11 QUANTIFICATION OF FORMULATION [SYNASMA-AX]](https://thumb-us.123doks.com/thumbv2/123dok_us/526276.71518/244.612.105.546.86.320/table-quantification-of-formulation-synasma-ax.webp)
![TABLE-13 RUGGEDNESS STUDY OF FORMULATION [SYNASMA-AX]](https://thumb-us.123doks.com/thumbv2/123dok_us/526276.71518/245.612.104.546.79.337/table-ruggedness-study-of-formulation-synasma-ax.webp)