Oxford Road, Manchester M13 9PL, UK e-mail:[email protected]
2 School of Physics, University of New South Wales, Sydney, NSW 2052, Australia 3 CEA, DSM, IRFU, Service d’Astrophysique, 91191 Gif-sur-Yvette, France
4 Laboratoire AIM, CEA/DSM - CNRS - Université Paris Diderot, IRFU/Service d’Astrophysique, CEA-Saclay, 91191 Gif-sur-Yvette, France
5 Harvard-Smithsonian Centre For Astrophysics, 60 Garden Street, Cambridge, MA, 02138, USA 6 CSIRO Australia Telescope National Facillity, PO Box 76, Epping, NSW 1710, Australia 7 Centre for Astronomy, James Cook University, Townsville, QLD 4811, Australia 8 Departmento de Astronoma, Universidad de Chile, Casilla 36-D, Santiago, Chile
9 Université de Bordeaux, Laboratoire d’Astrophysique de Bordeaux, 33000 Bordeaux, France 10 CNRS/INSU, UMR 5804, BP 89, 33271 Floirac Cedex, France
11 School of Physics, University of Exeter, Stocker Road, EX4 4QL, Exeter, UK
12 Leiden Observatory, Leiden University, PO BOX 9513, 2300 RA Leiden, the Netherlands
Received 16 November 2008/Accepted 3 July 2009
ABSTRACT
Context.Recent 1.2-mm continuum observations have shown the giant HIIregion NGC 3576 to be embedded in the centre of an extended filamentary dust-cloud. The bulk of the filament away from the HIIregion contains a number of clumps seen only at (sub-)millimetre wavelengths. Infrared and radio observations of the central star cluster have uncovered evidence of sequential star-formation leading us to believe that the adjacent clumps may host massive protostellar objects at a very early stage of evolution. Aims.We have investigated the physical and chemical conditions in the dusty clumps with the goal of characterising their star-forming content.
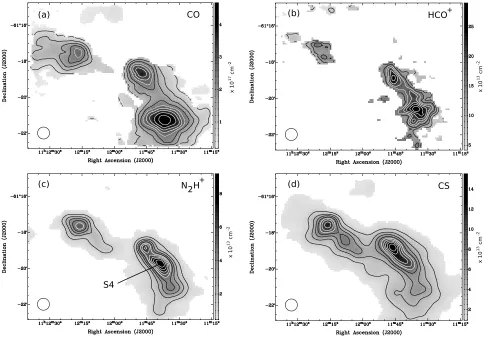
Methods.We have used the Australia Telescope Compact Array (ATCA) to image the cloud for the NH3(1,1), (2,2) and (4,4) tran-sitions, 22 GHz H2O masers, and 23 GHz continuum emission. The 70-m Tidbinbilla dish was used to estimate the total integrated intensity of NH3. We also utilised the 22-m Mopra antenna to map the region for the molecular lines13CO (1 – 0), C18O (1 – 0), HCO+(1 – 0), H13CO+(1 – 0), CS (1 – 0) and N2H+(1 – 0).
Results.Emission from dense molecular gas follows the morphology of the 1.2-mm dust emission, except towards the central ionised region. The HIIregion is observed to be expanding into the molecular cloud, sweeping up a clumpy shell of gas, while the central star cluster is dispersing the molecular gas to the east. Analysis of the NH3 data indicates that temperature and linewidth gradients exist in the western arm of the filament. Temperatures are highest adjacent to the central HIIregion, indicating that the embedded cluster of young stars there is heating the gas. Six new H2O masers were detected in the arms of the filament, all associated with NH3 emission peaks, confirming that star-formation has begun within these cores. Core masses range from 5 to 516Mand most appear to be gravitationally bound. Complementary results by André et al. (2008) imply that seven cores will go on to form massive stars between 15 and 50M. The large scale velocity structure of the filament is smooth, but at least one clump shows the signature of inward gas motions via asymmetries in the NH3(1,1) line profiles. The same clump exhibits an enhanced abundance of N2H+, which coupled with an absence of CO indicates depletion onto the dust grain surface.
Conclusions. The HIIregion at the heart of NGC 3576 is potentially triggering the formation of massive stars in the bulk of the associated cloud.
Key words.ISM: molecules – stars: formation – HII regions – radio lines: ISM – ISM: abundances – stars: pre-main-sequence
1. Introduction
1.1. Triggered star-formation
A necessary precursor to massive star formation is the existence of dense clumps of self-gravitating gas.Elmegreen(1998) de-veloped the first coherent picture of sequential star formation, in which the formation and collapse of these clumps within giant molecular clouds is triggered by an external event. Three distinct triggering mechanism are considered:
1. globule squeezing: compression of pre-existing clumps, e.g. due to a propagating shock-wave from a supernova;
2. cloud-cloud collisions: two molecular clouds collide result-ing in gravitational instabilities;
3. collect and collapse: accumulation of gas into a shell or ridge, and subsequent fragmentation and collapse.
Examples of the third mechanism are observed to occur on the edges of HII regions. Created by the far-UV radiation from a young OB-cluster, the hot ionised gas expands rapidly, sweep-ing up a shell of dense molecular material before it. A photon dominated region (PDR) is created at the interface between the HIIregion and the molecular cloud (seeHollenbach & Tielens 1999 for a review of PDRs). If the PDR is over-pressured
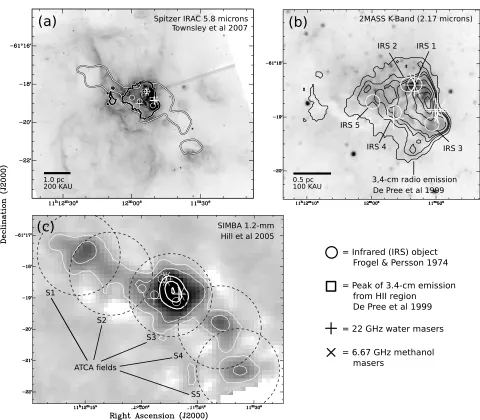
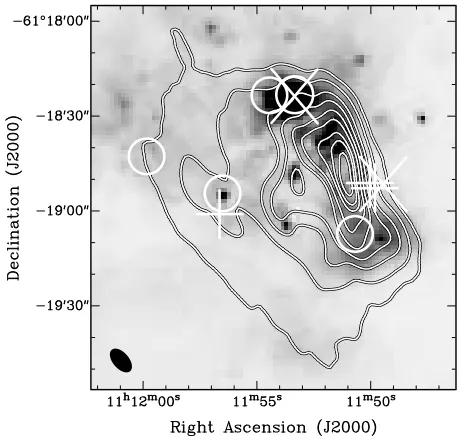
Fig. 1.Overview of the NGC 3576 star forming region.a)SPITZER 5.8μm image showing the extent of the 3.4-cm radio emission (black contour,
∼3 percent) and the 1.2-mm continuum emission (white contour,∼5 percent). CH3OH and H2O maser positions are marked with “×” and “+” symbols, respectively. Circles mark the positions assigned to the original infrared sources (IRS) discovered byFrogel & Persson(1974), while a “” marks the peak of the radio-continuum emission;b) contours of the 3.4-cm free-free emission from ionised gas in the giant HIIregion at the heart of the complex (de Pree et al. 1999) plotted over the 2.2μmK-band image from 2MASS;c) 1.2-mm continuum image of the complex (Hill et al. 2005) showing the dusty filament running across the HIIregion. Dashed circles indicate the five fields observed with the ATCA, centred on the 1.2-mm clumps.
compared to the bulk of the molecular gas, shocks are driven into the dense neutral medium of the cloud, potentially lead-ing to its fragmentation into clumps (e.g.Urquhart et al. 2006 and references therein). Subsequent disturbances may then trig-ger collapse and hence star formation. Material swept into a clump shields the column of molecular material behind it, form-ing giant pillars, the best known example of which are the “ele-phant trunks” in the Eagle Nebula (White et al. 1999; Allen et al. 1999). Some observed examples of swept-up shells around HIIregions include Sh2-212 (Deharveng et al. 2008), RCW120 (Deharveng et al. 2009), W5 (Karr & Martin 2003), RCW 49 (Whitney et al. 2004), and RCW 79 (Zavagno et al. 2006).
It is important to note that energy injected into molecu-lar clouds by newly formed stars may instead quench the star formation process. Supersonic particle-winds from massive stars account for∼0.1–1.0 per cent of the stellar luminosity and act to disperse molecular material and dust (e.g.,Genzel 1991). The
two most important feedback mechanisms, photo-ionisation and cluster winds, compete with each other to disrupt the cloud. On the scale of giant molecular clouds, feedback from newly formed stars is responsible for regulating the star-formation rate and hence the evolution of Galactic structure.
In this paper we present new multi-wavelength observations of the giant HIIregion NGC 3576, which is thought to be un-dergoing sequential star formation (see Sect.1.2). We examine the evidence for star formation in the nearby molecular environ-ment.
1.2. Prior observations of NGC 3576
peaking sharply in the west and extending∼2 to the north-east and south.Frogel & Persson (1974) discovered five near- and mid-infrared sources towards the ionised gas (plotted as circles in Fig.1), with the brightest source (IRS 1) located adjacent to the main peak of the radio emission. Further high resolution photometric observations by Persi et al. (1994) have revealed the presence of a very young, deeply embedded cluster with 130 members in the same region. Spectra of these sources exhibit deep 9.7μm silicate absorption features (Moorwood & Salinari 1981), leading to their interpretation as pre-main-sequence ob-jects.
There is controversial evidence for sequential star formation in NGC 3576. Persi et al.(1994) showed that a steep near-IR colour gradient exists in the embedded cluster, with the reddest, most deeply embedded sources in the west. This implies that star-formation began in the east, gradually moving to the loca-tion of the strong radio peak in the west. Such an interpretaloca-tion is supported by the existence of an electron temperature gradi-ent in the ionised gas (de Pree et al. 1999) indicating that the youngest and hottest stars are located near the sharp western edge of the HIIregion (Hjellming 1966). High helium abundance in the east may also indicate the presence of a population of older stars and their mass loss (Hanson & Conti 1993). Bright 22 GHz water masers, commonly found in outflows, have been found adjacent to the main radio peak (Caswell 2004), while Norris et al.(1993) also detected two 6.67 GHz methanol maser sites near IRS 1 and IRS 3. Shocked molecular hydrogen emission was measured peaking towards IRS 1 byOliva & Moorwood (1986), also pointing to the existence of outflows. IRS 1 was later resolved into three components byMoneti(1992) andBarbosa et al.(2003), one of which is seen through scattered light from a cavity or a dusty disk (Moneti 1992). None of the detected in-frared sources contributes significantly to the ionisation of the HIIregion, (Barbosa et al. 2003), however, recent Chandra ob-servations (Townsley 2006) have revealed multiple deeply em-bedded hard X-ray sources, which may provide the extra ionisa-tion needed.
The HIIregion was mapped at 1-mm wavelengths for con-tinuum emission, with a resolution of 1, by Cheung et al. (1980), who found that the flux density ratio compared to 40–350 μm was consistent with optically thin thermal dust emission. More recently,Hill et al. (2005) used the SIMBA1 bolometer to map 1.2-mm continuum emission at a resolution of∼24, as shown in Fig.1c and via white contours in Fig.1a. The SIMBA field covers an area of 4×6, centred on the radio peak and reveals that the HIIregion is embedded in a filamentary structure of cool dust, running north-east to south-west. The HII region is prominent at the centre, however, several bright knots are apparent along the length of the filament. These clumps, 1 Sest IMaging Bolometer Array on the Sweedish ESO Submillimeter Telescope.
ment in several molecular tracers, with the goal of constraining the star-forming properties of these new clumps (S1, S2, S4 & S5), and determining the effect of the HIIregion on the complex.
2. Observations and data reduction
Data from three telescopes, the Australia Telescope Compact Array (ATCA), the 22-m Mopra telescope and the 70-m Tidbinbilla telescope, were combined to assemble a picture of NGC 3576. The ATCA was used to obtain high resolution NH3 maps as a probe of the density and temperature structure of the clumps within the filament. We simultaneously searched for UCHIIregions via their 23 GHz free-free continuum emis-sion. We used the Tidbinbilla telescope to map the extended NH3 emission, providing a measure of the total column of NH3 in the filament and an estimation of the “missing flux” in the interferometer images. We utilised the Mopra telescope to map the complex in the 3-mm lines13CO (1–0), C18O (1–0), HCO+(1–0), H13CO+(1–0), N
2H+(1–0) and CS (2 – 1), with the goal of probing the physical and chemical conditions in each of the dusty clumps. Line rest frequencies and electronic constants for each transition are noted in TableA.1in the Appendix.
2.1. ATCA observations
Observations were made with the ATCA in three blocks dur-ing the years 2003–2005. Table 1 summarises details of the dates, array-configurations and frequencies used. NH3(1,1) data was obtained using the EW367 and H75 array configurations in August 2003 and July 2005, respectively. Two orthogonal lin-ear polarisations were observed at each frequency. The raw data were processed in a correlator, which was configured to deliver a bandwidth of∼101 km s−1 split into∼0.2 km s−1 wide chan-nels. NH3(2,2) was observed simultaneously with NH3(1,1) on the H75 array in July 2005. Due to technical constraints only 128 channels were available on the correlator, yielding a spec-tral resolution of∼0.8 km s−1over the 101 km s−1 bandwidth. In August 2003 the region was also mapped for 23 GHz continuum and 22 GHz water masers using the EW367 array. In July 2004, the 750D array was used to simultaneously map the NH3(4,4) transition and 23 GHz continuum. The correlator configuration was identical to that used to obtain the NH3(1,1) data.
Table 1.Details of the Australia Telescope Compact Array observing runs.
UT Array Beamα Transitions Frequency Bandwidth No. K/(Jy/bm)
date config. size () (GHz) (MHz) channels
2003 Aug. 28 EW367 7.6×6.2 NH3(1,1) 23.694480 8 512 46.02β
Continuum 23.694500 128 32 –
H2O (6–5) 22.235120 16 16 –
2004 Jul. 02 750D 6.6×2.4 NH3(4,4) 24.139417 8 512 134.47
Continuum 22.000000 128 32 –
2005 Jul. 17 H75 26.8×20.9 NH3(1,1) 23.694480 8 512 3.89
NH3(2,2) 23.722630 8 128 3.88
αBeam size excluding the 3 km+baselines to Antenna 6;βJy to K conversion factor for the combined EW367 and H75 data is 17.58 K/(Jy/bm).
Table 2.Centre coordinates of the ATCA fields corresponding approx-imately to the peak 1.2-mm emission.
Field RA Dec
(J2000) (J2000) S1 11h12m17.00s –61d17m40.0s S2 11h12m04.90s –61d18m20.0s S3 11h11m51.50s –61d18m52.0s S4 11h11m38.33s –61d19m53.9s S5 11h11m33.86s –61d21m20.9s
strong phase calibrator was observed for two minutes before and after changing fields. The instrumental contribution to the band-pass shape was measured by integrating on a strong continuum source (e.g., 0420–014) and was subsequently subtracted from all spectra. A primary flux calibrator (1934–638 or Uranus) was observed once per observation period, to allow the absolute cal-ibration of the flux scale.
The data were reduced using theMIRIADpackage (Sault et al. 1995) following standard procedures. During the data reduction the sources were assumed to be unpolarised and both polari-sations were averaged together. Continuum emission was sub-tracted from the spectral line data by using the taskuvlinto fit a polynomial to the line free-channels. An image of the continuum emission was produced by combining the line-free channels in the NH3data with the dedicated wide-band 22 and 23 GHz con-tinuum observations. Images were made using theinverttask and natural weighting was used to minimise the noise in the image-plane. At this stage the∼3 km baselines to antenna CA06 were discarded as the phases were found to be decorrelated, degrad-ing the image quality. All images were deconvolved usdegrad-ing the standardcleanalgorithm and, if a sufficiently bright source was present, several iterations of theselfcaltask were applied. The above procedure was performed on all fields, before using the task linmos to mosaic the data into a single map. Finally the NH3 data were converted to a brightness temperature scale in Kelvin, using the Jy/K scaling factors noted in Table1.
2.2. Mopra observations
The Mopra observations were conducted in “on the fly” (OTF) mapping mode, between the months June–September, during 2004 and 2005. An image was built up by combining overlap-ping scan rows, each containing 30–40 spectra. Scan rows were offset by half of the beam-FW H Mand the scanning speed was slow enough to ensure Nyquist sampling in the scan direction.
NGC 3576 was divided into an overlapping mosaic of three or more 5×5 fields, positioned to cover the 1.2-mm contin-uum emission. The pointing centres of individual fields varied,
depending on where molecular emission was detected, and the final maps were assembled by co-adding individual fields to-gether. Each field took ∼80 min to complete, plus a further ∼10 min for pointing checks and calibration measurements.
The signal from the receiver was processed in a digital auto-correlator, configured to have a bandwidth of 64 MHz divided into 1024 channels, which provided a velocity resolution of ∼0.2 km s−1 over a usable bandwidth of∼120 km s−1. The cen-tral frequency was chosen so that channel 512 was centred on the systemic velocity of NGC 3576 at−24 km s−1. Observations were made in dual orthogonal linear polarisation mode and the polarisations were averaged together during the reduction pro-cedure. The pointing accuracy was checked using a nearby SiO maser before observing each field and was estimated to be better than 8. Calibration to theTA∗ scale was achieved by measuring the emission from a single hot load placed in front of the receiver every 20 min (seeLadd et al. 2005andKutner & Ulich 1981). The maps were further calibrated onto the main-beam brightness temperature scale (TMB) by dividing theTA∗ pixel values by the main beam efficiencyηmbat the observing frequency (see Table 4 ofLadd et al. 2005).
The data were reduced using the LIVEDATA and GRIDZILLA packages, available from the ATNF2.LIVEDATAperformed
band-pass calibration by subtracting the preceding OFF spectrum from the SCAN spectra in each row. A low-order polynomial was then fit to line-free channels and subtracted, resulting in a smooth baseline at zero Kelvin. The spectra were assigned individual position stamps and regridded to the LSR-K reference frame, be-fore being written to disk. TheGRIDZILLApackage was then used to resample the maps to a regular pixel scale, weighted accord-ing to the system temperature (Tsys). To grid the data we used a pixel-size of 6×6 arcseconds and a Gaussian smoothing kernel with aFW H Mof 18, truncated at an angular offset of 36. The final data cubes were smoothed to an angular resolution of∼40.
2.3. Tidbinbilla observations
The 70-m antenna located at the NASA Tidbinbilla Deep Space Communications Complex near Canberra has a limited time de-voted to radio astronomy. When Mars is above the horizon the 70-m telescope is almost entirely utilised supporting the various NASA missions to that planet and as such has been little used by the radio astronomy community. In 2005 we performed the first frequency-switched spectral line mapping observations using the 23 GHzK-band receiver. Fast frequency switching also provides better cancellation of atmospheric emission fluctuations, how-ever, the response of the receiver may vary considerably with frequency, resulting in poor spectroscopic baselines.
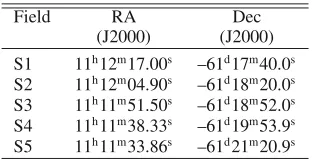
[image:4.595.97.253.263.344.2]Fig. 2.a) Integrated intensity map of the NH3(1,1) emission (thin black and white contours, and greyscale) made using the combined ATCA H75 and EW367 data. Contours are at 1.6, 7.9, 13.8, 20.0, 25.7, 31.5, 37.4, 43.6 and 50.1 K. The extent of the 23 GHz continuum emission from the central HIIregion is marked by the thick black contour. The 1.2-mm dust emission is outlined by a single white contour (∼3 Jy/beam, fromHill et al. 2005) and matches the NH3 emission closely, except in the central clump. Crosses (+) mark the positions of 22 GHz water masers while “×” symbols mark the 6.67 GHz methanol maser sites. IRS sources are marked by circles;b) integrated intensity map of the NH3(2,2) emission made using data from the ATCA H75 array;c) sample NH3(1,1) spectra measured from the positions labelled S1a – S5b. Spectra have been offset from zero baseline for clarity. The brightness temperature ratios between the main and satellite lines indicate that the clumps have low to moderate optical depths;d)sample NH3(2,2) spectra measured from the same positions.
We targeted the same five fields in NGC 3576 as were ob-served with the ATCA. The OTF method had not yet been im-plemented on the 70-m antenna so we observed each field as a square grid of 5×5 positions, spaced by half the 45
beam-FW H M. Each position was observed for 10 min and the point-ing accuracy was checked by observpoint-ing an unresolved planet (Jupiter) every hour. Pointing errors were usually below 10 or 1/4 beam. Individual maps took 5–6 h to complete, including 15 min to measure the atmospheric opacity using the “skydip” method. During the observations the data were calibrated against an ambient load (a noise diode) and the zenith system tempera-ture at 23 GHz was typically 40–50 K during the observations. We estimate theTA∗ flux scale is uncertain by≤10 per cent. The peak aperture efficiency was measured as 0.48±5% at 22.2 GHz
byGreenhill et al.(2003) and we adopt that value here to correct the data onto the main beam brightness temperature flux scale (TMB). To convert to units of Jy/beam the data were multiplied by 0.951 (Jy/beam)/K.
TheK-band receiver on the 70-m antenna measured only the left circular polarisation. The bandpass was centred mid-way between the NH3(1,1) and (2,2) transitions and the correlator was configured to have a 64 MHz wide bandpass divided into 2048 channels. Both the NH3(1,1) and (2,2) spectra, including satellite lines, fell well inside the 850 km s−1usable range and were observed at a velocity resolution of∼0.4 km s−1.
The spectra were inverted and frequency-shifted in theCLASS package. As the spectral baselines were poor, a polynomial of order 5–9 (in extreme cases) was fit to the line-free channels be-fore spectra from individual integrations were averaged together. The data were then assembled into a 3D data-cube using the
cubecommand in theGREGpackage and resampled onto a finer spatial pixel grid using thefill_cubecommand. Finally, the data were output asfitscubes andMIRIADwas used to restore missing header information, such as the beam-size and data-unit.
3. Results
Molecular emission was detected from all of the clumps identi-fied in the SIMBA map. The following subsections describe the results from the ATCA, Tidbinbilla and Mopra telescopes sepa-rately.
3.1. ATCA results
We detected NH3(1,1), and NH3(2,2) across the whole fila-ment. NH3(4,4) was not detected down to a sensitivity limit of ∼8 mJy/beam (1.0 K) when the data were smoothed to a velocity resolution of 1 km s−1. TheJ,K=(4,4) level is excited by gas above 200 K (see Fig. 1 inHo & Townes 1983), hence no sub-stantial reservoirs of hot gas are present in NGC 3576. Figures2a and b present the NH3(1,1) and (2,2) integrated intensity maps of the region. The NH3(1,1) map utilises data from both the H75 and EW367 array configurations and has a resolution of∼11. Only H75 data exist for the NH3(2,2) transition and the resulting map has a resolution of∼23. For reference, the 5 per cent con-tour (0.3 Jy/beam) of the SIMBA 1.2-mm continuum emission is plotted in white. The thick black line is the 3 per cent con-tour (0.11 Jy/beam) of the 23-GHz continuum emission from the central HIIregion. We see the NH3emission has approximately the same morphology in both transitions and closely follows the structure of the 1.2-mm dust emission, except immediately to the east of the central HIIregion (SIMBA clumps S2 & S3). The 1.2-mm emission in these clumps is over 50 percent contaminated by free-free emission (seeAndré et al. 2008). Sample NH3(1,1) and (2,2) spectra from peak positions on the integrated intensity maps (labelled S1a–S5b) are presented in Figs.2c and -d. Both of the NH3 transitions exhibit the classic “five-finger” profiles at all positions. Some asymmetries between the NH3(1,1) satel-lite lines are evident towards all positions, however, for the most part the spectra appear optically thin, exhibiting optical depths betweenτ = 0.1 andτ = 2.0. Linewidths vary between 1 and 2.5 km s−1, and peak brightness temperatures range between 4.4 and 8 K for the NH3(1,1) line and between 1.2 and 2.6 K for the NH3(2,2) lines. Individual line profiles in the western arm of the filament show clear evidence of blending and multiple compo-nents, especially towards positions S3b, S3c, S4b and S5a.
[image:6.595.326.557.74.292.2]23 GHz continuum was observed simultaneously with each of the NH3lines. To make the final map we combined data from the EW367, H75 and 750D arrays, including the continuum vis-ibilities from the line-free channels in the narrow-band spec-tral line windows. No 23 GHz continuum emission was detected outside of the central HIIregion, down to a sensitivity limit of ∼0.5 mJy/beam. Figure3presents the image of the HIIregion at 23 GHz. “×” and “+” symbols mark the positions of known 6.67 GHz methanol masers and 22 GHz water masers, respec-tively (Norris et al. 1993;Caswell 2004). The contours are sim-ilar to the central part of the 3.4-cm map made byde Pree et al. (1999) (see Fig.1b), with a single strong peak at 11h11m51.08s, −61d18m50.0s(J2000) and diffuse emission extending eastward
Fig. 3.23-GHz continuum emission from the HIIregion at the centre of the NGC 3576 complex (contours) overlaid on the 3.6 μm SPITZER IRAC image (greyscale). The continuum image was made by com-bining multi-frequency data from the ATCA H75, 750D and EW367 arrays, including the line-free channels from the NH3 observations. Contours are at values of 0.01, 0.11 0.45, 0.85, 1.35, 1.65, 2.00, 2.48, 2.82, and 3.25 Jy/beam. “+” and “×” symbols mark H2O and CH3OH masers, respectively, while circles mark the positions of the
Frogel & Persson(1974) IRS sources. The total integrated flux density is∼42.6 Jy.
into SIMBA clump S2. The 23 GHz flux density at the peak is 3.6 Jy/beam and we measure a total integrated intensity of ap-proximately 42.6 Jy. By comparison, the total flux at 3.4-cm is measured to be 71 Jy. Our observations sample theuv-plane less well than de Pree et al.(1999) and we likely filter out a sig-nificant fraction of the extended emission. Our values are con-sistent with free-free emission from optically-thin ionised gas (Sν ∝ ν−0.1) if we are missing∼34 percent of the flux detected
at 3.4-cm.
We also searched for 22 GHz water maser emission across the filament. New masers were detected at six positions, as well as at the three previously known sites adjacent to IRS 1, IRS 3 and IRS 4. Figure4presents a cumulative spectrum from a sin-gle baseline showing the majority of the maser lines detected. Two groupings of lines are observed, the first centred at ap-proximately−115 km s−1 (with two components at −130 and –100 km/,s−1) and the second centred at−30 km s−1. The intense lines at−130 and−100 km s−1have peak amplitudes of∼70 and ∼900 Jy/beam, respectively, and derive from maser sites towards the central HIIregion. Maser sites scattered across the 1.2-mm continuum filament contribute to the group of lines between−60 and−10 km s−1. Figure5presents the maser spectra and illus-trates the positions of individual maser sites superimposed on the NH3(1,1) zeroth-moment image. Precise coordinates, intensities and velocities are noted in Table3.
3.2. Tidbinbilla results
Fig. 4. Cumulative H2O maser spectrum from a single baseline showing lines from across the filament. The two broad maser lines at
−130 km s−1and −102 km s−1 derive from positions M9 and M5, respectively, towards the central H
[image:7.595.78.490.265.579.2]IIregion (see Table3). The bulk of the maser lines concentrated near the systemic velocity at−24 km s−1are scattered across the filament. The units of amplitude are arbitrary.
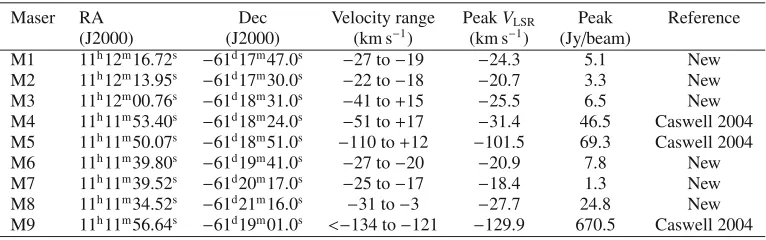
Fig. 5.Positions and spectra for the 22 GHz H2O masers detected in our ATCA EW367 array data. Six masers (M1, M2, M3, M6, M7 and M8) are new detections. Greyscale and black contours are the NH3(1,1) integrated intensity map. The white line is the∼3 Jy/beam contour from of the 1.2-mm continuum map. Individual spectra are sampled from the peak maser pixel in thecleaned images of five ATCA fields.
Table 3.22 GHz H2O masers in NGC 3576.
Maser RA Dec Velocity range PeakVLSR Peak Reference
(J2000) (J2000) (km s−1) (km s−1) (Jy/beam)
[image:7.595.97.480.654.774.2]Fig. 6.NH3(1,1) and (2,2) integrated intensity maps made using the 70-m Tidbinbilla telescope (greyscale and contours). Contours levels are at 10 percent intervals. The single thick black contour shows the extent of the 1.2 mm continuum emission (Hill et al. 2005). The grid inset into the NH3(1,1) map illustrates the spectra which contributed to the map of the S5 field.
Table 4.ATCA NH3percentage flux detected.
Field Percentage flux detected
S1 94
S2 78
S3 80
S4 91
S5 70
one column of field S3, covering the HIIregion. It is immedi-ately evident that the morphology of the emission is similar to that seen in the the ATCA NH3(1,1) data.
We initially intended to use data from the 70-m antenna to “fill in” the missing short-spacings in our ATCA data. For the merging to be successful, the emission in the single-dish dataset must be imaged out to its extremes. Unfortunately, there is still considerable flux at the edge of all fields and, due to time constraints and the experimental nature of the observations, we were unable to enlarge the maps. Instead, the Tidbinbilla data is used to estimate the fraction of missing flux due to ex-tended emission in each of the ATCA fields. To do this we smoothed the final ATCA maps to the same resolution and pixel scale as the Tidbinbilla maps and compared the integrated intensities measured under the same aperture. The percentage ATCA/Tidbinbilla integrated intensity ratios are presented in Table 4. Calibration error on the Tidbinbilla data is approxi-mately 30 percent and the measurements are consistent with less than 10 percent missing flux in the ATCA fields.
The estimates assume a beam-efficiency of 48 per cent for the 70-m telescope (Greenhill et al. 2003) and a (Jy/Beam)/K conversion factor of 0.951.
3.3. Mopra results
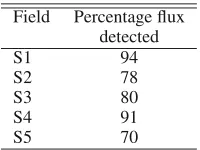
Figure 7 presents integrated intensity maps and sample spec-tra for all six molecules detected by Mopra towards NGC 3576. The data have been smoothed to a velocity resolution of 0.4 km s−1and have a spatial resolution of 40. Sample spec-tra presented alongside each map were exspec-tracted from the data-cubes at the peak positions of the SIMBA clumps (labelled
S1–S5) identified in the 1.2-mm continuum map and marked by filled circles in Fig.7.
As with NH3, the distribution of the other molecular lines closely follow the 1.2-mm emission except to the east of the central HIIregion.13CO (1–0) and HCO+(1–0) trace more ex-tended gas than the other lines, and their spectra appear moder-ately optically thick compared to their isotopologues, C18O (1– 0) and H13CO+(1–0). N
2H+and CS both trace dense gas, how-ever N2H+exhibits optically thin line profiles (τ < 0.1) at all positions while CS appears optically thick in places. The rel-ative intensity of the emission between species varies signifi-cantly over the extent of the cloud, likely due to differences in the chemistry of the clumps. We discuss this possibility further in Sect.5.3.
At position S2 the spectra of all species display three line components, offset in velocity by∼4 km s−1. Spectra sampled at the other positions appear as a single line profile. These lines are not well fit by single Gaussians except at position S5 and are possibly composed of several blended features. Taking the optically thin N2H+ as an example, the peak Vlsr of the emission in the western arm (SIMBA clumps S3–S5) has a mean velocity of −24.1 ±0.5 km s−1, while the eastern arm (SIMBA clumps S1 and S2) has a mean velocity of −25.0± 0.9 km s−1. No large velocity gradients are apparent, but the two arms are offset in velocity by∼1 km s−1. The full-width half-maximum N2H+linewidths ranges between approximately 1 and 3 km s−1 across the filament, with the highest values occurring adjacent to the HIIregion.
4. Derived properties
In this section we derive physical properties, such as temperature and density, from the molecular line data. The detailed method-ology used in the calculations is presented in the appendix. We discuss the results in Sect. 5 where we analyse the morphology, kinematics, relative chemical abundances and star-forming con-tent in detail.
4.1. Physical properties from NH3
Fig. 7.Integrated intensity (zeroth-moment) maps of NGC 3576 in the six molecular transitions observed with the Mopra telescope (left panels). Sample spectra, extracted from the data cube at the positions S1–S5, are presented to the right of each map.13CO is generally optically thick and is a good tracer of the extended molecular envelope. HCO+and H13CO+trace similar gas densities to CO, while CS and N2H+trace denser gas.
Cesaroni et al. 1992;Bourke et al. 1995). Due to its quantum mechanical properties, the NH3inversion spectrum is split into multiple hyperfine components from whose brightness ratios the optical depth may be derived directly, hence removing a major assumption from the calculation of rotational temperatures.
4.1.1. Kinetic temperature
The modified rotational diagram method used to calculate ro-tational temperature (Trot) from NH3has been described in de-tail byHo et al.(1977),Ungerechts et al. (1980) andTownes et al.(1983). We provide a brief summary of the procedure in the appendix, specifically for the NH3(1,1) and (2,2) transitions. The molecular constants used in the calculations are collected in TableA.1.
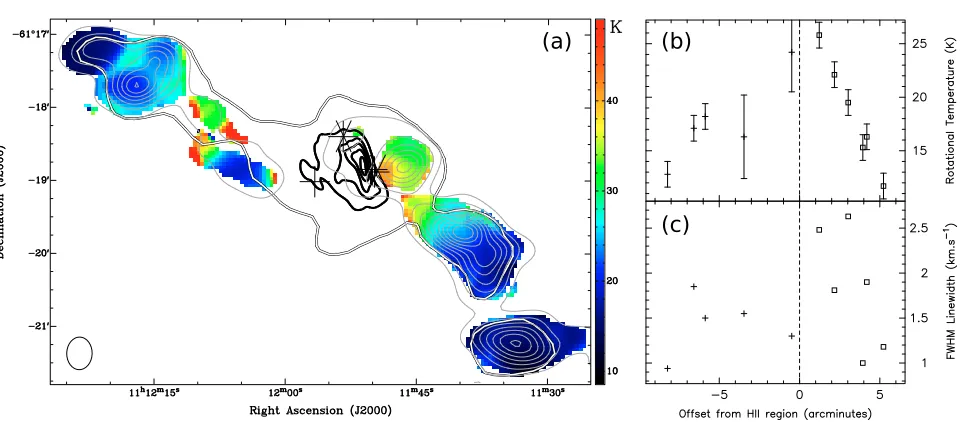
Figure8a presents a kinetic temperature map of NGC 3576 made using the NH3(1,1) and (2,2) data from the ATCA H75 array observations only. At a resolution of ∼23, the map reflects the beam averaged temperature of gas above a den-sity of n ≈ 2 ×104 cm−3 (Swade 1989). Higher resolution observations would doubtlessly reveal regions with hotter or cooler temperatures than average. An obvious temperature gra-dient exists across parts of the filament. Figure8b plots kinetic
temperature as a function of angular offset from the peak of the ionised emission. The data were sampled at 12 positions, corre-sponding roughly to the peaks of the NH3clumps in Fig.2. The median precision on the kinetic temperature values is approxi-mately 2.4 K and stems from the uncertainties in the Gaussian fits. We find that the kinetic temperature is higher towards re-gions adjacent to the HII region. In the outlying positions the kinetic temperature is∼12 K, increasing to≥30 K towards the centre. Some hot spots with temperatures above 40 K exist to the east of the HII region (between RAs of 11h12m00s and 11d12m15s), but the signal-to-noise ratio in this part of the map is poor, hence the derived temperatures are more uncertain (∼8 K). Derived temperatures above∼30 K have a large associated un-certainty because of assumptions made during the calculations (see AppendixA.1). However, below 20 KTafalla et al.(2004) find that kinetic temperatures calculated under the same assump-tions are accurate to better than 5 percent.
4.1.2. NH3column density and core mass
Fig. 8.a) Map of the kinetic temperature derived from the ratio of the NH3(1,1) and (2,2) lines. The beam size is 10.6×11.9. Kinetic temperatures range from>40 K, in the centre of the map, to 10 K at the extremes;b) kinetic temperature; andc) NH3(1,1) linewidth as a function of angular offset from the peak of the HIIregion. Crosses represent positions eastwards of the HIIregion and squares positions to the west. A distinct temperature gradient is evident in the western arm of the filament (top-left).
estimate of the total mass of gas may then be determined from the column density assuming a constant relative abundance to H2.
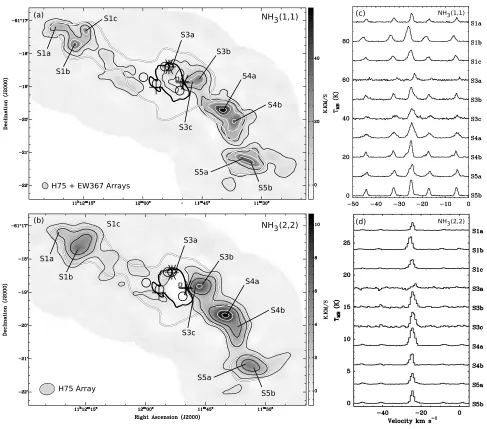
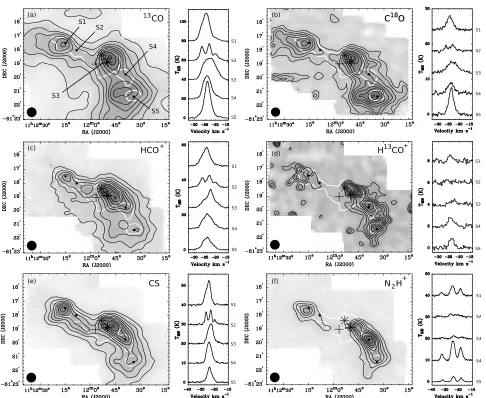
In the∼11 resolution NH3(1,1) map we begin to resolve substructure within the 1.2-mm clumps imaged by SIMBA. We have attempted to decompose the emission using the FELLWALKER3 routine. FELLWALKERattempts to divide regions of emission into cores by searching for positive gradients in the dat-acube. The algorithm considers each pixel in turn above a lower brightness cutoffand “walks uphill”, following the steepest as-cent until an isolated local peak is reached. All pixels visited are assigned to the same core, which may already exist. Finally, cellular automata fill any holes in the cores and clean up the edges by replacing each cores’ index with the the most common value occurring within a 3×3×3 pixel cube. The signal/noise ratio was not constant across the mosaiced NH3(1,1) map, so theFELLWALKERroutine was run on the five SIMBA regions in-dividually (using the mosaicked data-cube), starting at the same lower cutoffof 2-σ, but slightly different tuning parameters. The results were inspected by eye and compared to the original data-cube for consistency. Cores with fewer pixels than the area of the synthesised beam were omitted as unreliable detections.
Twenty-five believable cores were found, whose positions are plotted in Fig.9a. The mass of NH3 in each core was cal-culated from the sum of the integrated intensities of the individ-ual pixels in the core. We assumed excitation temperatures cor-responding to those derived from the 23 resolution H75 data. The total core mass was then estimated assuming an abundance ratio [NH3]/[H2] of 3.0×10⁻⁸(Wang et al. 2008), and a correc-tion factor of 1.38 for the abundance of helium and heavier ele-ments in the interstellar medium (Allen 1973). Table5presents the properties of the detected cores and the distribution of core masses is illustrated in Fig.9b. In Sect.5.2, below, we have cal-culated the NH3 abundance at different positions in the cloud
3 TheFELLWALKERroutine is part of theSTARLINKpackage main-tained athttp://starlink.jach.hawaii.edu/
via a comparison to 450 μm data. Column 11 presents the core masses corrected for these results.
Virial masses were calculated from the velocity width and average radius of the NH3 cores reported by FELLWALKER. Neglecting support from magnetic fields or internal heating sources, the virial mass of a simple spherical system is given by (MacLaren et al. 1988):
Mvir=k rΔV2, (1)
where Mvir is the core mass in M, r is the deconvolved ra-dius of the cloud in parsecs,ΔV is the FW H Mvelocity width in km s−1 andkis an empirical constant depending on the as-sumed density distributionρ(r). Forρ(r)∝1/r−2,k= 126 and forρ(r) =constant,k=210. Enhanced linewidths (e.g., due to optical depth effects or blending) will cause us to overestimate the virial mass and the values quoted here should be considered upper limits. We note thatτvaries between 0.1 and 2.0, so line broadening due to optical depth effects is negligible. Columns 12 and 13 of Table5 present the virial masses derived assuming constant and 1/r2density profiles, respectively.
4.2. Physical properties from other molecules
The molecules observed with Mopra towards NGC 3576 were chosen specifically to probe the physical conditions in different parts of the cloud.13CO (n
Fig. 9.a) The spatial distribution of cores detected in the NH3(1,1) data cube using the FELLWALKER routine overplotted on the integrated intensity image. Circles mark the positions of the cores and the radii are scaled to the core mass, as reported in Table5;b) histogram showing the distribution of core masses assuming a single value of [NH3]/[H2]=3×10−8;c) histogram showing the distribution of core masses corrected for the variable abundances calculated in Sect.5.2.
Table 5.Properties of the NH3(1,1) cores found using theFELLWALKERroutine in the ATCA data.
ID RA Dec ΔRAα ΔDecα ΔV TMB
TMBdv NNH3 MLTE1
β M
LTE2
γ M
vir1
δ M
vir2† Tkin τ (J2000) (J2000) () () (km s−1) K (K km s−1) (×1015cm−2) (M
) (M) (M) (M) K
1 11:12:21.30 –61:17:11.5 12.4 4.9 1.3 20.4 2803.6 20.8 82 79 18 11 15 1.5
2 11:12:16.70 –61:17:39.0 10.0 8.9 1.9 23.0 4989.6 36.7 144 166 41 25 20 0.7
3 11:12:14.18 –61:17:21.2 6.4 8.4 2.4 18.5 2427.1 18.5 73 168 53 32 22 0.7
4 11:12:08.91 –61:18:02.9 6.8 6.1 1.2 6.1 485.6 3.9 15 15 11 7 33 0.1
5 11:12:05.25 –61:18:49.3 18.0 8.8 1.7 5.6 1538.2 11.3 44 44 48 29 19 0.1
6 11:12:04.76 –61:18:24.8 7.1 1.6 0.8 8.5 131.7 1.2 5 5 3 2 47 0.1
7 11:12:01.53 –61:18:58.7 5.8 4.0 1.0 6.0 232.1 1.8 7 7 6 3 25 0.1
8 11:11:52.45 –61:18:30.2 4.2 3.7 0.6 23.9 185.2 1.6 6 47 2 1 31 0.1
9 11:11:51.91 –61:18:22.2 7.3 4.8 1.0 10.0 668.9 5.8 23 171 8 5 31 0.1
10 11:11:48.39 –61:18:54.1 2.8 3.7 1.2 28.4 809.4 7.0 27 91 6 3 40 0.1
11 11:11:46.05 –61:18:43.4 8.9 9.4 1.7 17.8 3990.0 32.5 128 426 32 19 33 0.1
12 11:11:45.66 –61:18:52.0 9.5 9.3 0.9 9.4 1051.4 8.6 34 112 10 6 35 0.1
13 11:11:41.86 –61:19:32.4 12.8 7.7 1.9 23.2 4935.5 37.8 148 62 44 27 26 0.4
14 11:11:39.38 –61:19:44.2 8.0 5.6 1.5 30.2 4757.6 35.5 139 59 20 12 23 0.7
15 11:11:38.90 –61:20:15.6 3.3 4.1 0.8 23.3 647.6 4.8 19 16 3 2 21 1.2
16 11:11:38.11 –61:21:55.7 3.9 4.6 1.6 4.3 222.1 1.8 7 14 13 8 – 0.1
17 11:11:37.94 –61:21:06.5 1.3 2.8 0.8 85.9 595.2 4.5 18 35 1 1 15 1.2
18 11:11:37.92 –61:19:35.1 6.6 4.4 1.0 17.5 975.2 7.3 29 12 7 4 24 1.0
19 11:11:36.49 –61:20:07.0 7.6 12.3 1.7 25.9 6502.5 47.9 188 166 36 22 17 1.0
20 11:11:35.62 –61:21:30.0 7.9 2.6 0.6 20.5 422.7 3.2 12 25 3 2 15 2.2
21 11:11:33.11 –61:21:11.6 13.2 8.4 2.4 27.9 8117.8 65.7 258 516 78 47 15 1.9
22 11:11:32.84 –61:19:53.0 1.2 0.3 0.8 321.3 231.1 1.7 7 6 1 0 17 1.0
23 11:11:27.13 –61:21:07.3 5.6 2.0 0.7 32.3 517.0 3.9 15 30 2 1 16 1.6
24 11:11:24.25 –61:21:18.7 5.2 6.2 0.8 4.4 109.9 0.9 3 7 5 3 – 0.1
25 11:11:24.03 –61:21:25.3 6.5 6.6 0.9 8.6 534.0 4.2 17 33 7 4 – 0.1
αDeconvolved full-width half-maximum (FW H M) core size asumming an average beamFW H Mof 11.2;βLTE-mass derived from the integrated
intensity of NH3(1,1) assuming a relative abundance [NH3]/[H2]=3×10−8.γCorrected LTE-mass, derived using the [NH3]/[H2] abundance ratios calculated in Sect.5.2via a comparison between NH3 and 450μm p-ArTéMiS data;δ Mvirderived assuming a constant density profile; †M
virderived assuming a 1/r2density profile.
Assuming LTE conditions, we independently solved for the optical depth, excitation temperature and total column density of CO and HCO+via the procedure detailed in the AppendixA.3. Figure 10 presents the final column density maps towards NGC 3576. The13CO peak optical depth ranges from 0.1 to 4.4 and the excitation temperature from 6.4 to 36 K. Peak HCO+ op-tical depth ranges from 1.9 to 13.1 and excitation temperatures
We calculated the total mass of the molecular cloud by as-suming the following abundance ratios to H2: [13CO]/[H2]= 6.0×10⁻⁶ (Goldsmith et al. 1997, assuming an abundance ra-tio of [12CO]/[H
2]=45 at a galactocentric radius of 8 kpc – seeLanger & Penzias 1990), [HCO+]/[H2] =2.0×10⁻⁹ (Zhu et al. 2007), [CS]/[H2]=1.1×10−9 (Pirogov et al. 2007), and [N2H+]/[H2]=5.0×10−10(Pirogov et al. 2007). The values for total cloud mass derived from the CO, HCO+and N2H+ observa-tions are all approximately 8300M. The mass derived from CS is 12 700M. These values assume calibration onto the Mopra “extended beam” temperature scale, which includes power received from the first sidelobe and is appropriate for data more extended than 80(see Sect. 2.1 ofLadd et al. 2005).
5. Analysis and discussion
5.1. H2O masers
The three well-known water maser sites within the central HII re-gion (labelled M4, M5 and M9 in Fig.5) have been investigated byCaswell(2004), who summarises their properties. At the M4 site (G291.274−0.709) the H2O maser coexists with 6.67 GHz CH3OH and 1.67 GHz OH masers. In the H2O maser spec-trum we detect bright maser features ranging from−37 km s−1to 23 km s−1, in agreement with Caswell, however, we also de-tect weak (<5 Jy) lines out to velocities of −51 km s−1 and
+20 km s−1. The M5 site (G291.270−0.719) hosts a weak CH3OH maser at−26 km s−1 and a bright H2O maser at a ve-locity of−102 km s−1. First reported by Caswell et al.(1989), we find this H2O maser has an unusually broad linewidth (2.9 km s−1) and a peak flux density of 69 Jy, consistent with the original observations. The VLSR of this spectral feature is reported to have become increasingly negative since its dis-covery in 1989 when it had a velocity of −88 km s−1. This has been interpreted as being due to acceleration of the emit-ting gas, perhaps in a high velocity outflow (Caswell 2004; Caswell & Phillips 2008). Alternatively, we suggest that the −102 km s−1 line may be a new maser feature not associated with the component seen at−88 km s−1, which may have been quenched in the intervening time. The final known site, M9 (G291.284-0.716), exhibits a single intense maser at a velocity of−130 km s−1and with a linewidth of 4.8 km s−1. We measure an intensity of 670 Jy in contrast to the earlier value of 945 Jy (Caswell et al. 1989), perhaps reflecting a real decrease in the intensity over the intervening time. We note that this maser fea-ture falls on the edge of our bandpass, which may make the flux density measurement unreliable.
The six new maser sites reported here (M1, M2, M3, M6, M7 and M8) are located in the “arms” of the filament. As can be seen from Fig. 5 all sites are within a few arc-seconds of NH3 emission peaks. With the exception of M8, it is notable that the spectra of these new masers exhibit, at most, two bright features. These features have velocities close to the systemic ve-locity and intensities below 10 Jy. In contrast, the maser spec-trum of M8 has four strong peaks spread over∼35 km s−1, the brightest of which has an intensity of 25 Jy. The mid-infrared im-age of the host SIMBA clump (S5) also exhibits some nebulous emission, on the south-west edge (see Fig.1a), while the dense molecular gas tracers (see Sects.3.1,3.2and3.3) show a “notch” in the emission at the same site. We interpret these features as evidence of a deeply embedded young stellar cluster evacuating an open-ended cavity.
5.2. Core masses
Core masses derived from NH3 rely on the assumption of a constant [NH3]/[H2] abundance ratio, whose value may vary across the cloud. Independent estimates of the gas+dust-mass in NGC 3576 have been made byAndré et al.(2008), who mapped the 450 μm thermal emission using the P-ArTéMiS4bolometer camera on APEX5. With a beam size of 10 the 450μm map
has a comparable resolution to our NH3(1,1) observations and the morphology of the 450μm emission corresponds almost ex-actly to the integrated molecular emission.
We expanded the analysis ofAndré et al.(2008) by decom-posing the 2-D 450μm emission into cores usingFELLWALKER and deriving their individual masses via the relation:
M = S450μmD
2
κ450Bν(Td)450
, (2)
whereS450 is the measured flux density,κ450 is the dust opac-ity per unit (gas + dust) mass column density at 450 μm,
Bν(Td) is the Planck function Bν(T) at a dust temperatureTd and D is the distance to the source. We setκ450=0.04cm2g−1, a value generally adopted in sub-mm studies of pre-stellar cores (e.g.Motte et al. 1998, Ward-Thompson et al. 1999) and ap-propriate in regions of moderately high gas densities (around 105 cm−3 – cf. Henning et al. 1995). For consistency, we set
Tdto the kinetic temperatures derived from our NH3data. A di-rect comparison between the masses derived from 450μm and NH3emission integrated over the same apertures results in esti-mates of the average [NH3]/[H2] abundance ratio in each core, assuming no depletion.
Eight equivalent cores were detected in the 450 μm P-ArtéMiS and ATCA NH3(1,1) integrated intensity maps, whose positions and masses are presented in Table 6. Mass values from 450 μm data range from ∼89 M to ∼712 M. Some 450 μm cores encompass two or more NH3(1,1) cores and in such cases we summed the masses of the components quoted in Col. 10 of Table5. Relative [NH3]/[H2] abundance values range from 0.4×10⁻⁸to 7.1×10⁻⁸and are distinctly different in adja-cent cores. We note that the error on the abundance values is ap-proximately a factor of 3, including the calibration uncertainty of the P-ArtéMiS data, assumptions about the dust emissivity and opacity, dust-to-gas ratio, temperature and relative angular size. The abundance differences may also be attributed to environ-mental factors. Cores S3-a and -b exhibit the lowest abundance values, but lie adjacent to the HIIregion. Here they may be ex-posed to the ultraviolet-radiation field from the central cluster, leading to enhanced destruction of large molecules. Core S4-a, and to a much lesser extent S4-b, have elevated abundances of NH3. Interestingly, this SIMBA clump also has an enhanced abundance of N2H+, possibly due to depletion of CO onto the dust grain surface (see Sect. 5.3, below). In light of the vary-ing abundance values we have attempted to correct the masses derived for thecoresfound in the 3-D NH3data-cube. Where an equivalent 450μm core does not exist we revert to the canonical value of 3.0×10⁻⁸(Wang et al. 2008). These “corrected” values are presented in Col. 11 of Table5.
Figure11compares the corrected LTE and virial masses for the NH3cores in Table5. The factor f = Mcorrected/Mvir1
mea-sures the ratio of gravitational to kinetic energy. Values less than 4 See http://irfu.cea.fr/Sap/en/Phocea/Vie_des_labos/ Ast/ast_technique.php?id_ast=2295
Fig. 10.Column density maps of the four species targeted by the Mopra telescope. Contours are set at 10 per cent intervals, beginning at 10 per cent, except in the HCO+column density map, where they start at 30 per cent of the peak value.
Table 6.Comparison of masses derived from p-ArTéMiS 450μm and ATCA NH3(1,1) emission.
Clump RA Dec Mass Mass [NH3]/[H2]α Average Aliases
ID (J2000) (J2000) 450μm NH3LTE Abundance Tdust (André et al. 2008) (M) (M)
S1-a 11:12:21.09 –61:17:09.50 89 91 3.1×10⁻⁸ 15 –
S1-b 11:12:17.21 –61:17:43.50 161 140 2.6×10⁻⁸ 21 S1-M1 S1-c 11:12:14.43 –61:17:17.50 193 82 1.3×10⁻⁸ 23 S1-M2 S3-a 11:11:53.05 –61:18:31.37 357 51 0.4×10⁻⁸ 40 S3-M4 S3-b 11:11:45.54 –61:18:45.27 682 211 0.9×10⁻⁸ 38 S3-C3 S4-a 11:11:39.69 –61:19:43.18 161 383 7.1×10⁻⁸ 24 S4-M6
S4-b 11:11:36.91 –61:20:03.13 247 279 3.4×10⁻⁸ 19 –
S5 11:11:34.66 –61:21:11.09 712 339 1.4×10⁻⁸ 15 S5-M8
αRelative abundance of NH3to H2via a direct comparison of clump masses derived from NH3and 450 μm emission.
one indicate that the core may be a transient structure or con-fined by an over-pressured external medium, while a value of
f ∼ 1 suggests that the core is close to gravitational equilib-rium. Cores withf 1 are likely to be gravitationally unstable, meaning that internal magnetic fields are required to counteract the effects of self-gravity. We find that in all cases f ≥1 (within errors) and seventeen cores have f-values between three and thirty. The magnetic field strength necessary to support each core may be calculated afterBot et al.(2007) via
B2−B20= 9
10
1− 10 9 f
G M2μ 0
R4π , (3)
[image:13.595.77.501.480.600.2]Fig. 11.Distributions of Mcorrected/Mvir for the 25 cores found in the NH3data. TheMcorrectedvalues have been derived from the MLTEmasses scaled to the 450μm core masses.Mvirwas calculated assuming a as-suming a r−2density profile. For a constant density profile virial masses would be 1.7 times larger. All cores have ratiosMcorrected/Mvir≥1 and are at least consistent with being gravitationally bound. Cores with ra-tios much greater than one are likely to be gravitationally unstable and may be undergoing collapse unless supported by magnetic fields on the order of milli-Gauss
.
André et al.(2008) estimated the envelope mass of the domi-nantprotostellar object in each 450μm core by scaling the mass corresponding to the peak flux density to a uniform diameter of 6000 AU, assuming a density profileρ(r) ∝r−2. The values range from 21 to 45M. They also estimated the bolometric lu-minosities by fitting the SIMBA, P-ArTéMiS and MSX6 data with a grid of spectral energy distribution models computed by Robitaille et al. (2006,2007). When plotted on a Menv versus
Lbol diagram (see Fig. 4 ofAndré et al. 2008) the objects are bracketed by evolutionary tracks corresponding to final stellar masses of 15 to 50 M, implying that the cores are undergo-ing high-mass star-formation. The relative positions of the cores on the diagram also indicates their relative evolutionary ages. Interestingly, the cores furthest from the HII region, at posi-tions S1-b, S1-c, S4-a, and S5, are significantly less evolved than the adjacent cores at S3-a and S3-b. This evolutionary gradient is consistent with the hypothesis that the central HIIregion has triggered sequential star-formation in the filament.
5.3. Chemistry
Once the physical conditions of temperature, density and optical-depth have been determined, we can begin to examine the chemistry in NGC 3576. Ratios of column density provide beam-averaged measures of the relative abundances between two species. For key molecules this ratio is tied directly to the physical conditions and hence to the embedded star formation activity.
Figure 12 presents maps of the relative abundance of [N2H+]/[CO] and [N2H+]/[CS] made by taking the ratios of the column density maps. The abundance ratios are beam-averaged and assumes all of the gas is above the critical density for each species. Immediately clump S4 stands out in the [N2H+]/[CO] map, as it has an over-abundance of N2H+ compared to the other SIMBA clumps. The difference is not as pronounced in the [N2H+]/[CS] map, however, we note the optical depth of
6 Midcourse Space Experiment (MSX)
http://irsa.ipac.caltech.edu/applications/MSX/
CS is not known and hence there are significant uncertainties in the column density across the map. A comparison between the N2H+and HCO+column densities also reveals the same en-hancement in clump S4, which we believe to be a real chemical difference. Because of the low signal-to-noise we do not show this map.
The abundance of N2H+is predicted to be enhanced in cold (≤10 K) or dense clumps. This is because its parent molecule N2is one of the least affected by the condensation process and N2H+survives in the gas phase, at least for densities in the range 105–106 cm−3. In such environments its main destruction partner CO depletes onto the grains and the abundance of N2H+ conse-quently increases (Bergin et al. 2002). Interestingly,13CO and C18O emission are noticeably absent from clump S4, provid-ing further confidence in this interpretation. Conditions such as these are found in starless cores, but particularly in cold col-lapsing clumps evolving towards forming stars. Clump S4 has an average kinetic temperature of∼25 K according to our anal-ysis of NH3 data. This seems high for an infrared dark cloud (see Fig.1a) undergoing collapse, however, CO depletion may still occur at these temperatures if the density is high enough (Aikawa et al. 2001). In the following sub-section we will exam-ine the evidence for inflowing gas motions in this clump.
5.4. Morphology and kinematics
We have examined the molecular emission for evidence of veloc-ity gradients indicating bulk gas motions, expansion or contrac-tion. Figure13presents position-velocity (PV) diagrams made using the 13CO Mopra data and annotated on the inset inte-grated intensity map. Panel 1 was made using thekshelltool7and
shows the azimuthly averaged intensity as a function of veloc-ity and angular offset from position 11h11m58.0s−61d18m35.0s J2000. The ‘C’ shaped profile is a classic indicator of an ex-panding shell of gas, in this case centred approximately on the HII region. Towards the centre position (zero offset) the spa-tial pixels sample gas moving directly towards and away from the observer, hence the average spectrum peaks at the systemic velocity±the shell expansion velocity. At offsets approaching the shell radius the pixels sample gas moving perpendicular to the observer, hence the emission peaks at the systemic velocity (−24 km s−1). The clumpy shell seen here in13CO is approxi-mately 1 arcminute in diameter and encompasses the free-free emission from the HIIregion. We see exactly the same C-shape in C18O, although the plot is noisier.
Panels 2–4 present the PV-slices indicated on the in-set 13CO moment map (top-left). The first cut, (centred at 11h11m09.90s,−61d15m45.6sJ2000 and at a position angleΘ = 244.5◦) is a longitudinal slice through the eastern arm of the
fila-ment and reveals a forked cross-section: two tenuous tentacles of emission merge into the eastern-most SIMBA clump (S1). PV-slices through the dense gas tracers (NH3and CS) show the same structure, meaning that this morphology is not due to op-tical depth or chemical effects. Ionised gas from the HIIregion overlays this part of the eastern arm, likely inter-penetrating the molecular emission. Combined with the existence of an expand-ing shell and a temperature gradient, we conclude that the HII re-gion is expanding eastwards, and has played a significant role in sculpting these features.
Fig. 12.Maps of the relative abundance of [N2H+]/[CO] (left) and [N2H+]/[CS] (right) made from individual column density maps. Greyscale and contours are set at 10 per cent intervals, starting at 30 per cent of peak. The N2H+abundance is significantly enhanced towards clump S4. This difference is especially pronounced in the [N2H+]/[CO] map but is not as clear when comparing N2H+and CS. We note that the column density of CS is the least well known of the three species.
Fig. 13.Position-velocity cuts through the13CO data-cube. Thetop-left panelis an integrated intensity map of13CO showing the orientations and positions of the PV-slices presented in panels 1–4. Centre positions of the slices are marked with black and white filled circles. Panel 1 shows the azimuthly averaged intensity as a function of velocity and angular offset from position 11h11m58.0s−61d18m35.0sJ2000. The “C” shaped profile is indicative of an expanding shell of emitting gas. Panels 2, 3 and 4 present PV-slices along the axes of emission and in cross-section through the western arm, respectively. Several distinct filamentary structures are evident, merging into the bright emission adjacent to the HIIregion.
The second cut (11h11m48.60s,−61d20m57.6sJ2000,Θ = 174◦) follows the line of emission evident in Fig. 13 at −20 km s−1. It is clear from the PV-diagram that two velocity components exist, separated by∼4 km s−1. Both appear to merge into the strong emission immediately west of the HII region.
These two velocity features are clearly visible in the third cut (11h11m39.50s,−61h21m46.9sJ2000,Θ =268◦), which presents
[image:15.595.133.444.298.631.2]Fig. 14.a) Map of the difference between the peak intensities of the F+2 ↔F−1 (blue) minus F+1 ↔F−2 (red)innersatellite lines of NH3(1,1) for SIMBA clump S4, where F is the total angular momentum quantum number (see Fig. 1 inRydbeck et al. 1977). Only spectra with differences greater than 0.2 K (∼3-σ) are plotted as colourscale, while contours represent the integrated intensity map. The inset histogram shows the distribu-tion of difference values over the whole of the clump and is clearly dominated by significant numbers of blue-skewed spectra. (b) Sample spectra from the positions marked i, ii and iii on the difference map.
the dense gas tracers NH3, N2H+or CS. Considering the dense gas only, we see the peak Vlsrof the filament is approximately constant between−24 to−25 km s−1over its length. No large op-posing velocity gradients or discontinuities are evident and small variations may be explained by optical depth effects or motions on small scales (<30). We see no evidence for large scale flows
of gas, at least in the 40resolution Mopra data, and conclude that the majority of the emission derives from the same cloud and is not merely a projection or line-of-sight effect. The veloc-ity structure in the 11resolution NH3 data is complex within the bounds of each SIMBA clump and will be analysed in detail in a separate paper.
We are interested in probing for bulk gas motions in clump S4, where we find an over-abundance of N2H+, common in col-lapsing clumps. Asymmetric spectra towards star forming re-gions are often interpreted as indicators of inward or outward motions. In the case of NH3(1,1) asymmetries may be produced by a combination of non-LTE effects and bulk motions. Park (2001) has modelled NH3(1,1) spectra over a wide range of physical conditions, predicting that asymmetries between the in-nersatellite lines indicates inward or outward flows of gas. On the other hand, asymmetries between the outer satellites are in-dicative of selective radiative trapping and non-LTE excitation (Stutzki & Winnewisser 1985). The amount by which both ef-fects skew the profiles increases with optical depth. Figure14a presents a map showing the difference between the blue mi-nus red peak intensities of theinnersatellite NH3(1,1) lines, for SIMBA clump S4. Only pixels with absolute differences greater than 0.2 K (∼3-σabove the spectral noise) have been plotted. Asymmetries on the order of∼10 percent are observed over dis-tinct regions within the SIMBA clump. We note that there are few pixels with significant red-skewed spectra (values less than −0.2 K in Fig.14a) and the map is dominated by regions of blue-skewed spectra which cover angular areas greater than the beam. Sample spectra from the three largest regions are presented in Fig.14b. The optical depth of NH3(1,1) in this clump ranges between 0.4 ≤ τ ≤ 1.0 and we do not expect large asymme-tries under these conditions, hence, we believe the differences are significant and tentatively imply inward gas motions.
5.5. HIIregion – cloud interaction
It is clear from the temperature map presented in Fig.8that the central star-forming complex is heating the gas in its immedi-ate surroundings. The heating is gradual on the western side of the filament and the temperature decreases linearly towards the extremes. The gradient in temperature strongly suggests that the HIIregion is embedded within the filament and is not merely a line of sight projection. The temperature fluctuates between∼15 and∼30 K in the S2 clump, immediately east of the HIIregion’s peak. Diffuse free-free emission is observed to extend into this region and the molecular gas has a clumpy distribution and is less evenly heated. It is interesting to note that there is a weak linewidth gradient in the western arm also, as plotted in Fig.8c. This may reflect the turbulent energy injected into the cloud via shocks driven by the expanding ionised gas in the HII re-gion. Clear evidence for this continuing expansion is seen in the 13CO data as an expanding shell of molecular gas surrounding the free-free emission.
5.6. Infrared excess stars
Previous studies have focused on the infrared properties of em-bedded stars in NGC 3576. Emission in theK (2.2μm) andL
(3.6μm) bands, which cannot be accounted for by interstellar reddening, has been interpreted as the signature of thermal emis-sion from a dusty disk.Maercker et al.(2006) imaged the region inJ(1.3μm), H(1.7μm), K andL, and found 113 stars with infrared excess. Their distribution is plotted in Fig.15over the 13CO (1–0) integrated intensity map. Foreground stars have been filtered from the list. A dense cluster of IR-excess stars is cen-tred on the Giant HII region, as reported in work byPersi et al. (1994) using Las Campanas Observatory. It is clear that the dis-tribution of IR-excess stars is anti-correlated with the molecular gas in the dense arms of the filament. The high extinction in this area likely makes it impossible to detect even bright IR-excess sources behind or embedded in the filament. This suggests that the clumps are not associated with star-formation at anadvanced
Fig. 15.The distribution of stars with infrared excess determined by
Maercker et al. (2006), plotted over the molecular gas traced by 13CO (1–0) emission.
they are probably at such a young age that they are still deeply embedded and not yet visible in the near-infrared.
5.7. Triggered star formation in NGC 3576?
Our observations provide an interesting glimpse into star forma-tion activity within NGC 3576. It is clear that the HIIregion is embedded within the dusty filament and is exerting a powerful influence on its immediate surroundings. We have investigated whether the HIIregion expansion into the ambient molecular cloud is consistent with triggering the formation of high-mass stars along the dusty filament.
By comparing the morphology of the HII region (traced by the 23 GHz continuum emission) to the dense molecular gas (traced by NH3, CS and N2H+) and thermal dust emission (traced by 1.2-mm and 450 μm continuum), we see that the young star cluster at the heart of the complex has destroyed or dispersed much of the gas in the central clump. There is also clear evidence for an expanding shell in the13CO and C18O data, centred on the HIIregion.
To the east of the HIIregion, molecular gas is sparse and does not follow the morphology of the dust, while at 3.4-cm wavelengths the ionised gas is observed to extend throughout most of field S2 (see Fig.1c). In contrast, the western edge of the free-free continuum emission is observed to have a well de-fined boundary. We find from our molecular-line observations that this edge coincides with a dense molecular clump, imply-ing that the HIIregion is pressure-confined on this side. At the same time, the HIIregion appears to be heating the arms of the filament and the western arm exhibits a clear temperature gradi-ent, peaking adjacent to the HIIregion. In the eastern arm, the clumpy nature of the gas gives rise to “hot spots” with higher temperatures, consistent with our “dispersal” interpretation. The gradients in temperature strongly suggest that the HIIregion is embedded within the filament. Some of the structures visible in the eastern arm are reminiscent of the “elephant’s trunks” pillars in the Eagle Nebula (White et al. 1999).
Besides the heating evidence, there is also evidence for kine-matical interaction between the HII region and the ambient molecular cloud. We do see evidence that the HIIregion is ex-panding into the eastern arm, sweeping up a clumpy shell of gas.
clumps. Water masers have always been associated with star for-mation (seeBeuther et al. 2002for a summary). That we detect water-maser emission towards the arms of the filament confirms the presence of shocks and hence that stars are forming within the molecular gas. However, unlike 6.67 GHz CH3OH masers, 22 GHz water masers are not a clear confirmation of high-mass star formation as they are also found towards sites where in-termediate mass (4–8 M) stars are forming. Water masers are thought to originate in the shocked gas associated with outflows and are collisionally pumped (e.g.,Kylafis & Pavlakis 1992). Core masses derived from NH3 range from 5Mto∼516M,
with a median value of∼45M. Seven cores have masses greater than 100Mand for a typical star formation efficiency of 0.3 (c.f. Lada & Lada 2003) are likely to form stars with masses greater than 8M.
We have confirmed that protostellar objects are likely form-ing in the arms of the filament and that the HIIregion is clearly influencing the conditions in the bulk of the cloud, as evidenced by the temperature gradients and gas-morphology. Whether the formation of the new stars is triggered by the expansion of the HIIregion is difficult to prove categorically, but to be consistent requires evidence of an “age gradient”, as argued byPersi et al. (1994). Recent 450-μm continuum observations (André et al. 2008) partially resolved the 1.2-mm continuum SIMBA clumps and detected continuum emission counterparts to the NH3cores. Based on a “protostellar mass envelope vs. bolometric luminos-ity diagram” (hereafterMenv–Lboldiagram),André et al.(2008) estimated the evolutionary stage of these candidate massive pro-tostars and positioned them on evolutionary tracks for high mass star formation. Interestingly, S3-a and S3-b, the closest candi-date protostars to the HIIregion, appear to be the most evolved objects on theMenv–Lbol diagram. In contrast, the other candi-date protostars, those in the arms, appear to be less evolved on the diagram and are possibly class 0-type protostars. The non detection of ionised gas toward these protostars confirms their very early evolutionary stage. All detected protostars will evolve into stars of masses between 15 and 50Maccording to the evo-lutionary tracks on theMenv–Lboldiagram.
Another signature of early phases of star formation is the evidence for collapsing cores. On examination of the relative molecular abundances, SIMBA clump S4 stands out as having an over-abundance of N2H+and an under-abundance of CO. Such a chemical signature is typical of dense and cold regions, which is often found towards collapsing cores. We searched for signatures of inflowing motions in the NH3 line profiles. Asymmetries on the order of∼10 per cent are observed between the inner satel-lites for discrete regions in clump S4.
Fig. 16.Schematic of the environment of NGC 3576 (right panel).13CO integrated intensity contours tracing the extended molecular cloud, overlaid on a H-αimage (left panel), which highlights the large scale structure of the interstellar medium around the star-forming complex. The molecular emission is correlated exactly with the extincted regions of the H-α. Loops of H-αemission are seen to extend north and south from the vicinity of the ionised HIIregion (thick black contour), likely shaped by the energetic young cluster at the heart of the complex. The ionised gas is expanding into the molecular cloud, sweeping up a clumpy shell of gas and heating the filamentary cloud in which it is embedded. Dense cores containing tens to hundreds of solar masses have formed along the length of the cloud and exhibit 22 GHz water maser emission, signifying star-formation in progress.
triggering star formation in NGC 3576. The geometry of the HIIregion and associated clumps does not resemble the typ-ical collect and collapse scenario, hence the observations are also in agreement with spontaneous star formation, at least in the clumps further away from the ionisation front. However, it is also possible that the HIIregion is responsible for initiating star formation in these clumps via shock driven globule squeezing. Further investigation is necessary to distinguish between these two cases.
6. Summary and conclusions
We have mapped the molecular environment of the giant HII re-gion NGC 3576 in lines of NH3, CO, HCO+, CS and N2H+. In addition, we have searched for UCHIIregions via 23 GHz free-free emission and for 22 GHz water masers. Figure16 sum-marises our observational results as a schematic, overlaid on an amateur H-αimage (Schedler, 2009) which illustrates the large scale structure of the ISM in the region. Our main conclusions are as follows:
1. We have detected molecular emission from all clumps identi-fied in the 1.2-mm SIMBA map (Hill et al. 2005). Dense gas tracers (NH3, N2H+ and CS) follow th
![Fig. 9. adistribution of core masses assuming a single value of [NHintensity image. Circles mark the positions of the cores and the radii are scaled to the core mass, as reported in Tablethe variable abundances calculated in Sect.) The spatial distribution of cores detected in the NH3 (1,1) data cube using the FELLWALKER routine overplotted on the integrated 5; b) histogram showing the3] / [H2] = 3 × 10⁻⁸; c) histogram showing the distribution of core masses corrected for 5.2.](https://thumb-us.123doks.com/thumbv2/123dok_us/178102.50187/11.595.64.534.67.268/adistribution-nhintensity-abundances-calculated-distribution-fellwalker-overplotted-distribution.webp)