1
A CROSS SECTIONAL STUDY TO ASSESS
PSYCHOPATHOLOGY IN CHILDREN OF
MALE PATIENTS WITH ALCOHOL
DEPENDENCE SYNDROME AND THEIR
FAMILY FUNCTIONING
DISSERTATION SUBMITTED TO
THE TAMIL NADU DR. M. G. R MEDICAL UNIVERSITY
IN PARTIAL FULFILLMENT OF THE
2
CERTIFICATE
I hereby declare that this dissertation titled “A cross sectional study to assess psychopathology in children of male patients with alcohol dependence syndrome and their family functioning.” is a bonafide work done by Dr. Ranjit Krishnadas at the Department of Psychiatry, Christian Medical College. This work has not been submitted to any University in part or full.
Dr. Anju Kuruvilla Dr. Anna B. Pulimood Professor and Head Principal
3
CERTIFICATE
I hereby declare that this dissertation titled “A cross sectional study to assess psychopathology in children of male patients with alcohol dependence syndrome and their family functioning.” is a bonafide work done by Dr. Ranjit Krishnadas under my guidance at the Department of Psychiatry, Christian Medical College. This work has not been submitted to any University in part or full.
Dr. Priya Mammen Professor of Psychiatry
Child and Adolescent Psychiatry unit Department of Psychiatry
4
DECLARATION
I hereby declare that this dissertation titled “A cross sectional study to assess psychopathology in children of male patients with alcohol dependence syndrome and their family functioning.” is a bonafide work done by me under the guidance of Dr. Priya Mammen, Professor of Psychiatry, Christian Medical College. This work has not been submitted to any University in part or full.
9
ACKNOWLEDGEMENTS
I would like to express my deep felt gratitude:
To my guide, Dr. Priya Mammen, who supported me throughout my thesis with patience and knowledge. Without her inspiration, resourcefulness and help this thesis could not have been completed or written.
To Dr. Sherab Tsheringla who helped me immensely walking the extra mile and guiding me right from the start giving me that push when I thought I couldn’t cross that final line and helped me with my write up. He has been a constant source of knowledge, practical help, encouragement, support and an excellent co-guide.
To Dr. Anju Kuruvilla, Dr. Deepa Braganza and Dr. Anna Tharyan for allowing me to recruit patients and their valuable suggestions and support at crucial junctures without which I would not have been able to come this far.
10
To Mr. Suresh, Secretary of Department of Psychiatry Unit II, who untiringly did the meticulous alignment of the entire thesis.
To Mr. Palani (Senior Programmer) and Mr. Jayapal (Librarian, Department of Psychiatry) who gladly offered me their helping hands in taking print out and photo copies.
To all my colleagues and staff of MHC, for their unconditional help in referring patients to recruit for the thesis.
To Dr. Visalakshi from the department of biostatistics for her help in the designing and the statistical analysis of the study.
To my parents Dr. P.S Krishnadas and Dr. Mary Krishnadas, my brother Dr. Rajeev Krishnadas and especially to my wife Mrs. Archana Sriraman, who stood by me and inspired me in difficult times.
11
12
13
INDEX
1. Introduction 14
2. Review of Literature 17
3. Aims and Objectives 48
4. Materials and Methods 50
5. Results 61
6. Discussion 84
7. Strengths and Limitations 94
8. Summary and Conclusions 96
9. Bibliography 102
10. Annexure
1. Sociodemographic and clinical data sheet 112
2. Modified Kuppuswamy Scale 113
3. McMaster Family Assessment Device 114
4. CBCL Questionnaire and Scoring Sheet 116
5. Addiction Severity Index 120
6. Information Sheet, Informed Consent form and Child assent form – English 123
7. Information Sheet, Informed Consent form and Child assent form – Tamil 128
14 1. INTRODUCTION
Childhood and adolescence is a physically and emotionally dynamic and challenging part of a person’s life. A healthy childhood paves the way for wellbeing in the present and the future. A child’s growth and development is influenced by both biological and environmental factors. The environmental factors are also known as the psychosocial factors. Parenting, home and family environment play the major part in a child’s psychosocial or environmental factors. Healthy parenting with a good family and adequate social support can provide a milieu for healthy growth and development. Contrarily, a disturbed childhood, broken family and poor social structure can predispose a child for dysfunctional mental and physical problems during childhood, as well as influence his/her adulthood.
15
There is strong scientific evidence for alcoholism running in families and the genetic factors which influence the growth and development of children with alcoholic family members. Children of Alcoholics (COAs) have four times the chance of developing alcoholism compared to children of non-alcoholics. It has also been seen that almost a third of all alcoholics have had at least one parent who is or was an alcoholic. The capability of the non-alcoholic spouse to recover quickly from difficulties and overall functional ability can be an important factor influencing the effect of problems affecting children.
16
COAs have more chances of being raised in an environment lacking adequate stimulation and their parents may be lacking skills or cognitive abilities to provide a nurturing environment. This could lead to poor scholastic and social adaptive behaviours in such children. Children of alcoholics may benefit from efforts and adequate intervention from adults to avoid dysfunctional developmental patterns. They can be helped to be self-sufficient and independent. Developing better social skills and orientation can in turn assist them in facing emotionally hazardous experiences and develop better long-term coping strategies. COAs can be safeguarded from the deleterious effects of a family member with alcoholism if there are consistent significant others in the family, and an adequate family functioning can be maintained. Many times the family can cope up with these stresses and can function well. This minimises the adverse impact on the growth and development of the child from the family and social fronts. However, if the family resources are not able to keep up with the stress demanded by the presence of an alcoholic, the family environment becomes unhealthy and puts the child into further emotional and social stress.
17 2. REVIEW OF LITERATURE
2.1 History of Alcoholism
Humans have consumed psychoactive substances from prehistoric times. However, addiction may not have begun until humans developed agriculture and farming (about thirteen thousand years ago). Before that time hunter-gatherer groups did not have access to psychoactive substances in necessary quantities to cause addiction or dependence. Once humans became able to produce alcohol and cultivate other addictive substances (peyote, marijuana, opium) in greater quantities it then became possible for addiction to ascend. Alcohol consumption has been a part of human life since very long and has probably been the most extensively available addictive substance. There is no clear proof as to when humans started manufacturing or consuming alcohol. Honey or berries may have been used to prepare the most primitive alcoholic drinks (ethyl alcohol or ethanol). Stone-age beer containers unearthed, dating as back as 8000 BCE establishes that humans have been preparing alcoholic beverages for at least 10 millennia. (3). There is further proof of fermented drinks existing in early Egyptian civilization. The Chinese had alcoholic drinks as early as 7000BCE. Indians consumed an alcoholic drink extracted from rice called Sura, in the 3rd century BCE(4).
18
alcoholic beverages before the arrival of Christopher Columbus in America in 1492. “Chicha” is an assortment of fermented beverages from the Andes region of South America, produced from corn, grapes or apples. Alcohol (called “spirits”) was used mainly for medicinal purposes in the sixteenth century. The British government passed a law encouraging the use of grain for distilling spirits in the beginning of the 18th century. This led to a surge in quantities of cheap alcohol in the market and resulted in gin drinking reaching up to 18 million gallons. This paved the way for widespread alcoholism.
The 29th century saw a gradual change in attitudes and approaches to alcohol. Temperance movement which typically criticized excessive indulgence in alcohol, gained popularity and slowly resulted in a drive for total prohibition.
Manufacture, sale, import and export of alcohol was made illegal in USA in 1920. This led to an exponential rise of illegal trade and the prohibition had to be cancelled in 1933(5). Currently, alcohol is not prohibited in most countries except for Muslim-Majority nations and some regions in India.
19
there persists a difference in opinion as to whether alcohol is an ‘attractive elixir’ or a ‘dangerous poison’(6). Although addiction cannot be considered a new problem, some people have advocated that it is a growing problem; a problem of contemporary society. Historically, addiction to chemical substances seems to rise and fall in phases. Some cultures seem to have lesser problems with addiction than do others. For example, the Greek, Jewish, Italian, Spanish, French, and Chinese have a lower possibility for alcoholism and other addictions than do the citizens of America. Some people would claim this is an indication of a genetic basis for addiction. However, there are other equally satisfactory explanations for the differences observed between cultures(7).
2.2 Diagnosis of Alcoholism
20
or one 12-ounce bottle of beer. A report in the National Survey on Drug Use and Health in 2014 found that only 10% of either binge drinkers or heavy drinkers, according to the above criteria met the criteria for alcohol dependence, while only 1.3% of non-binge drinkers met this criterion, despite the risks. A conclusion drawn from this study is that evidence-based policies and clinical preventive amenities may effectively decrease binge drinking without needing addiction treatment in most cases.(8)The National Council on Alcoholism and Drug Dependence, Inc. (NCADD) and the American Society of Addiction Medicine(ASAM) in 1992 defined alcoholism as "a primary, chronic disease characterized by diminished control over drinking, obsession with the drug - alcohol, use of alcohol in spite of adverse consequences, and variations in thought."(9). In the past, disease concepts of alcoholism came from the works of Jellinek(10) and the clinical syndrome was described in detail by Edwards and Gross(11). ICD-10 published by the WHO defines Dependence Syndrome to any psychoactive substance as “an assembly of physiological, cognitive and behavioural phenomena in which the use of a substance or a class of substances takes on a greater priority for a given individual than other behaviours that once had higher value.” ICD-10 endorses that a definite diagnosis of dependence should typically be made only if three or more of the following have been existing together at some time during the last year:
21
(c) A state of physiological withdrawal when substance consumption has stopped or been decreased, as shown by: the distinctive withdrawal syndrome for the substance; or use of the same or a closely related substance with the aim of getting rid of or evading withdrawal symptoms;
(d) Evidence of tolerance, such that greater doses of the psychoactive substances are essential in order to attain effects formerly produced by lower doses
(e) Progressive disregard of alternate pleasures or interests because of psychoactive substance use, greater amount of time necessary to obtain or consume the substance or to recuperate from its effects;
(f) Persisting with substance use regardless of clear evidence of obviously harmful consequences (12).
DSM-IV categories of substance abuse and substance dependence are combined into a single disorder called Substance use disorder in DSM-5 published in 2013, measured on a continuum from mild to severe. The eleven symptoms listed include:
1. Alcohol is often taken in higher amounts or over a lengthier period than was intended.
2. There is a persistent yearning or futile efforts to decrease or control alcohol use.
3. A great deal of time is spent in actions necessary to acquire alcohol, consume alcohol, or recuperate from its effects.
4. Craving, or a strong yearning or urge to use alcohol.
22
6. Continued alcohol consumption despite having persistent or recurrent social or interpersonal problems caused or worsened by the effects of alcohol use.
7. Significant social, work-related, or recreational activities are given up or decreased because of alcohol use.
8. Repeated alcohol use in situations in which it is physically hazardous.
9. Alcohol use is sustained despite knowledge of having a persistent or continuing physical or psychological problem that is likely to have been caused or worsened by alcohol.
10.Tolerance, as defined by either of the following: a) A need for markedly higher amounts of alcohol to achieve inebriation or desired effect b) A markedly diminished effect with persistent use of the same amount of alcohol.
11.Withdrawal, as demonstrated by either of the following: a) The characteristic withdrawal pattern for alcohol b) Alcohol (or a closely related substance, like as a benzodiazepine) is taken to get rid of or avoid withdrawal symptoms.
The presence of at least 2 of these symptoms point to an alcohol use disorder (AUD). The severity of an AUD is graded mild, moderate, or severe:
23 Disorder state — Modifiers for diagnosis include:
• In early remission — After full criteria for alcohol use disorder were formerly met, none of the criteria for alcohol use disorder have been met (with the exception of craving) for at least 3 months but less than 12 months.
• In sustained remission — After full criteria for alcohol use disorder were formerly met, none of the criteria for alcohol use disorder have been met (with the exception of craving) during a period of 12 months or longer.
• In a controlled environment — The person is in a situation where access to alcohol is restricted.
The diagnostic criteria changes in DSM 5 from DSM-IV included removing of separate categories for diagnosis of alcohol abuse and dependence. The DSM-5 also removed legal problems, but added craving as one of the eleven symptoms of Alcohol Use Disorder(13).
2.3 Classification of Alcohol Use and methods to quantify severity.
24
25
forward that new technologies should be used in developing more effective assessment tools which can look into individual differences and attributes which may be hidden or missed (18). Sweetman et al identified and reviewed the currently available comprehensive assessment tools. They found that no single tool was adequate enough to evaluate all properties. They commented that it is better to refine small number of tools which can be applied broadly than create completely new packages. Another strategy they suggested, which could be effective, was using custom-built ones from time-tested and proven single construct scales than using ‘off-the-shelf’ ones (19). A summary of the various tools widely used in measuring severity of alcohol use are listed below:
Instrument
What it
Measures Operationalization of Severity
Item-Selection Methodology Addiction Severity Instrument (ASI) Severity of alcohol and drug use
Need for treatment across 6 domains Clinical judgment
Alcohol Dependence Scale (ADS)
Severity of
alcohol
dependence
DSM symptomatology, loss of
control, obsessive drinking style,
two aspects of withdrawal
Clinical judgment,
item/factor
correlation
Chemical Use, Abuse, and Dependence Scale
(CUAD)
Severity of
alcohol and
drug use
DSM symptomatology Clinical judgment
Drug Use Screening Inventory (DUSI)
Severity of
alcohol and
drug use
26
Instrument
What it
Measures Operationalization of Severity
Item-Selection Methodology Global Appraisal of
Individual Needs (GAIN)
Severity of
alcohol and
drug use
DSM symptomatology, substance
use frequency, behavioral
complexity
Clinical judgment
Severity of Alcohol Dependence Questionnaire (SADQ)
Severity of
alcohol
dependence
DSM symptomatology, three aspects
of withdrawal, rapidity of
reinstatement after abstinence
Clinical judgment,
item/factor
correlation
Severity of Dependence Scale (SDS)
Severity of drug
dependence
DSM symptomatology, compulsivity
of drug use
Clinical judgment,
item/factor
correlation
Substance Dependence Severity Scale (SDSS)
Severity of drug
dependence
DSM symptomatology Clinical judgment
Table 1: Summary of the various tools widely used in measuring severity of alcohol use
2.4 Epidemiology of Alcoholism in Worldwide Population
[image:26.595.69.528.69.425.2]27
(22). Alcohol consumption is one of world’s leading risk factors for morbidity, disability and mortality. More than 200 conditions listed in ICD-10 have alcohol as a causal component. It causes 3.3 million deaths annually. This is even after adjusting for some beneficial effect of alcohol use in low amounts described in some diseases. The number of deaths related to alcohol is higher than those described for HIV/AIDS, violence or tuberculosis(20). In addition to Alcohol Use Disorders and foetal alcohol syndrome, which are completely attributed to alcohol, there is high degree of attribution to alcohol in hepatic diseases like hepatic cirrhosis. Alcohol related liver disease is one of the top 20 causes of death worldwide. (23,24). There are other illnesses in addition to the above which have less than 20% of the corresponding disease burden attributable to alcohol for most alcohol-attributable causes of mortality or burden of disease categories. It adds on to the worldwide disease burden in cancers, tuberculosis, CVA, epileptic illnesses and hypertension-related cardiac illness (20). The relative effect of alcohol consumption on disease burden from neuropsychiatric disorders is far more pronounced than its effect on mortality. About a quarter of all alcohol-attributable DALYs are due to neuropsychiatric disorders contrasted with 4% for all alcohol-attributable deaths. This is mainly due to AUDs, which cause more disability than mortality compared to other chronic diseases (23).
2.5 Epidemiology of Alcoholism in Indian population
28
consumption of pure alcohol was 4.3 litres in total in the period 2008-2010. Considering only males, per capita consumption was 8 litres compared to 0.5 litres in women. The total consumption between 2003 to 2005 was 3.6 litres. 93% of the alcohol consumed were spirits, 7% was beer and less than 1% was wine.
Taking into consideration only people who drink, per capita consumption was 32.1 litres for males, 10.6 litres for females and 28.7 litres for both combined. Prevalence of heavy episodic drinking (defined as consumption of pure alcohol, at least 60 grams or more not less than on one occasion in the past 30 days) was 1.7% in the total population and 11% among drinkers only (3.2% males in total population and 12.9% among drinkers; females <0.1 in population and 0.7 % among drinkers). The 1-year prevalence rate of alcohol use disorders and alcohol dependence in 2010 was 2.6% (4.5% males and 0.6% females). 2.1% fulfilled criteria for AUDs (3.8% males and 0.4 % females). These figures were higher than the total figures in South East Asia (2.2% AUDs and 1.7% Alcohol dependence) as reported by WHO (20).
29
Blood Alcohol Concentration (BAC) limit anyone can have while driving an automobile is 0.03%. There are legally binding guidelines on alcohol advertising and marketing, product placement, sponsorship of alcohol and sales promotion. Companies are also legally required to exhibit health warnings on alcohol advertisements or containers. However even though the National Government support of community action and National Monitoring systems are in place, alcohol consumption and prevalence of AUDs are steadily on the rise compared to developed countries (20).
Murthy et al in their review of substance use and addiction research in India, reported the prevalence rates of various types of alcohol use. Alcohol use/abuse ranged from 167 to 370/1000 population, addiction/alcoholism ranged between 2.36 to 24.5/1000 and alcohol along with other drug use/abuse was 21.4 to 28.8/1000 (25). Reddy et al conducted a meta-analysis in which they reported prevalence of overall substance use in India as 6.9/1000. The urban rates were 5.8/1000 and rural were 7.3/1000. The prevalence in males was 11.9% compared to 1.7% in females (26). Multiple regional studies showed comparable prevalence rates (27–29).
30
Gujarat at 7% and highest (75%) in Arunachal Pradesh. Tobacco use prevalence was high at 55.8% among males, with maximum use in the age group 41-50 years (30). The National Family Health Survey(NFHS) provided insights on changing trends in substance use reflecting increasing alcohol use among males between NFHS2 and NFHS3. Increasing trends on Alcohol use by females was revealed in the GENACIS study where close to 6 % of females reported alcohol use in the past one year (31). Studies have reported the implication of alcohol use with brain injury (20%) and all injuries in casualty setting (60%) (32). Of total psychiatric emergencies, substance related ones formed 1.6% (33).
31
seeking populations. Only few have explored dual disorders in the general population (38).
In addition, these studies have investigated only a limited geographical region. A cross-sectional observational design has been used in the majority of the published studies with only a few studies which used a case-control design. Some studies have followed up study subjects prospectively. Case reports are only a handful and only one RCT, the findings of which are yet to be published. There are no comprehensive reviews, and the reviews which have been published have examined only selected issues related to dual disorders (39).
2.6 Studies on alcohol use disorders and comorbid psychiatric disorders from
India
32
prevalence of mood disorders ranged from 26% to 71% across reviewed studies. Depressive disorders were reported as a commonly associated comorbidity. The presentation of anxiety spectrum disorders ranged between 10% and 45.8% and contained agoraphobia and panic disorders. Psychosexual disorders are prevalent in patients with alcohol dependence and individuals frequently reported multiple complaints of sexual dysfunction. It has also been observed that symptoms of depression, anxiety and stress have existed before the onset of alcohol use. Vulnerability to developing alcohol use disorders in individuals with ADHD and ADD have been demonstrated through retrospective analysis. A variable course has been reported regarding alcoholic hallucinosis along with a large constellation of symptoms, which are different from those of schizophrenia. Studies have also plotted the course of schizophrenia and substance use among patients with dual disorders and have discovered a significant association between the two (39).
33 2.7 Epidemiology of Child Psychopathology
2.7.1 International Studies
Up to 2 out of 10 children are affected by mental health problems worldwide. Between 15 to 30% of Disability Adjusted Life Years are lost in the first 30 years of life, contributed by neuropsychiatric disorders (42). A systematic review of worldwide, community-based research done by Merikangas et al revealed a prevalence of approximately 25% in the last year prevalence and 33 % lifetime prevalence of mental disorders in children and adolescents(43). Another comprehensive review revealed that the number of observations in population-based studies in children increased 4-fold in studies between 1993-2002 when they compared those published between 1980-1993. They also suggested that 25-33% of young people are projected to have psychiatric disorders in their life time, according to DSM (44,45). Rates of approximately 10% have been reported to meet the Substance Abuse and Mental Health Services Administration (SAMHSA) criteria for a Serious Emotional Disturbance (SRD)(45,46).
Depressive Disorders: Though studies before 2004 have shown a wide prevalence
34
some have shown higher rates in preadolescent boys. In contrast, depression is higher in adolescent girls than boys. This difference continues till middle adulthood. The average age of onset of MDD and depressive disorder, reported in longitudinal studies is between 11 to 14 years. Increased prevalence of MDD after 11 years of age is substantiated by evidence from prospective research. Data from the Oregon Adolescent Depression Project reported incidence of depression to increase from 1 to 2% at age 13 to 3 to 7% at age 15. This increase is reflected throughout early adult life. No differences between either sexes were seen in average age of onset in the National Comorbidity Survey (43,47). Significant differences and associations between social class and ethnicity have been reported in various studies (48).
Bipolar Disorder: The lifetime prevalence in children from community samples have
been reported as ranging from 0 to 2.1% for BPAD and 0.2 to 0.4% for hypomania (43). These rates are similar in males and females. The current/1-year prevalence in children between 14-18 years in the community was reported to between 0 to 0.9% (44,49). Lewinsohn et al reported that incidence of BPAD is highest at 14 years of age for both boys and girls. This rate gradually decreases later in age (50). Soutullo et al reported incidence rates ranging from 1.7 to 2.2 per 100,000 per year (51). Strong associations of BPAD with other childhood disorders (ADHD, ODD, Conduct, disruptive and anxiety disorder) have been observed in prominent studies (43,50). Anxiety Disorders: Costello et al reviewed all anxiety disorders in children and found
35
years of age. Girls are found to have more anxiety disorder across all age ranges. This is similar to what is seen in adults. No substantial differences in age of onset is seen between boys and girls (43). However, rates of anxiety disorders increase sharply in girls starting at 5 years and continues going up through adolescence. Boys show a rather gradual increase which levels off later in adolescence. Therefore, higher degrees of anxiety are seen in girls by age 6. No significant differences attributed to social class or ethnicity is reported in anxiety disorders (53).
Behavior Disorders
ADHD: Costello et al reported a point prevalence ranging from 1.7 to 17.8% in
ADHD (median = 4%)(45). ADHD is undoubtedly more common in boys than girls. This has been observed by multiple studies (44,54–56). Froehlich et al found that poorer children are twice as likely to have ADHD than wealthier ones (54).
Conduct and oppositional disorder : Costello et al reported the 12 month prevalence
36
Substance Use Disorders: Costello et al reports that the prevalence of alcohol/drug
use in community-based research of adolescents ranges between 1 to 24% (median = 5%) (44). Studies show variable gender differences of substance use. While Angold et al reported equal rates in males and females (59), Roberts et al observed higher rates
in males (60). Merikangas et al reported SUDs (Substance Use Disorders) to be more common in white youths and distributed equally by social class of parents (61).
2.7.2 Indian Studies
India has a large population of children. According to the census in 2011, about 160 million children are between 0 to 6 years of age. This constitutes close to 15 % of the population. Children between 0 to 14 years form 30% of the total population. About 25% of India’s population are adolescents. 35-50% of the total global population is constituted by children and adolescents from Low and Middle Income Countries (LAMIC). Up to 50% of all psychiatric disorders in lifetime is found to start before the age of 14(62,63).
37
and parents’ assessment rated the prevalence higher at 10.17 and 7.48% respectively. Enuresis was the most common disorder found (65).
Srinath et al studied 2064 children in Bangalore aged 0-16 years who were selected by stratified random sampling from urban middle-class, urban slum and rural areas. Total prevalence of psychiatric disorders found was 12.5% (13.8% on 0-3 years and 12.0% in 4-16years). Differences between children from various living areas were insignificant. The described the frequencies of common disorders found in the age group. Only 37.5% of families recognized problems in their children. Physical abuse and psychiatric disorder in parents showed positive associations with disorders in children (66).
Malhotra et al reported the annual incidence of psychiatric problems as 18per 1000 per year. Children with and without disorders on follow-up did not differ significantly in their sociodemographic or psychological characteristics at the time of enrolling for the study (67). Multiple epidemiological studies looked at psychiatric morbidity of children in various populations and settings and found that conduct disorder, enuresis and ADHD were the most commonly diagnosed (68–71)
Depression: Srinath et al reported that depressive episodes occurred in 0.1% of
38
Anxiety: Nair et al reported the prevalence for all anxiety disorders in children of a
rural community population in India. They used multiple criteria for prevalence including international and DSM. The prevalence rate using different measures ranged between 8.6% to 25.8%. Prevalence was uniformly higher in girls. All anxiety disorders, separation anxiety disorder and social anxiety disorder showed significant gender differences. Panic disorder and generalized anxiety were significantly higher in older children (74).
ADHD: Gada reported a study of 321 primary school children between 5-10 years of
age. The prevalence of ADHD was found to be 8.1 %. The ratio of boys to girls was 7.6:1. ADHD was significantly associated with age group 8 to 10 years in boys and in the total sample. The ADHD had significantly more first-born children (75).
Conduct Disorder: The prevalence of conduct disorder varies among the Indian
studies, with Deivasigamani et al finding prevalence rates of 11.13%,(68) and Sarkar et al. 7.1% (73). Malhothra et al had reported a prevalence of 4.94% in a retrospective
39
Substance use: Systematic review of 15 studies across India aged 13-15 yrs. showed
a median prevalence of tobacco use (ever users) to be 18.2 per cent; 14 per cent among males and 6.3 per cent among females (77). Data from the National Household Survey (NHS) by United Nations Office on Drugs and Crime (UNODC) in 2002 encompassing urban and rural areas of 24 States of India, revealed a prevalence of 21.4 per cent of alcohol use among men aged 12 to 18 yrs. (78).
2.8 Risk Factors affecting Childhood Psychopathology
40
2.9 Psychopathology in children of people with mental illness
41
assessing psychopathology in parents and children, type of sample recruited and familial composition) (82).
2.10 Psychopathology in Children of Alcoholics
2.10.1 International Studies
Children who live with non-recovering alcoholics experience greater amounts of discord within the family. The prevalence of alcoholism among adults over 18 years of age is approximately 7%. Still, most COAs do not develop alcoholism or other substance abuse problems, and most of them do not develop any kind of behavioral problems or psychiatric illness at all. This discovery has led to an intense interest in identifying risk factors or pathways that lead to either psychopathology or health, so that valuable prevention and treatment strategies can be developed (83). COAs score poorly on measures of intellectual-cultural orientation, independence, family cohesion and, active-recreational orientation. Many children of alcoholics (COAs) encounter other family members as distant and non-communicative. Children of alcoholics may be disadvantaged by their inability to grow in developmentally healthy ways(84–87).
42
abuse, truancy and delinquency; (b) hyperactivity and conduct disorder; (c) cognitive functioning; (d) somatic problems; (e) dysfunctional family interactions (f) depressive and anxiety symptoms; (g) physical abuse; and (h) social inadequacy. The literature as a whole maintained the argument that parental alcoholism is linked with an amplified incidence of child symptoms of psychopathology, in contrast with no increased incidence in offspring of non-disturbed parents (89).
Sher et al in 1991, concluded that COAs reported more alcohol and drug problems, higher alcohol expectancies, greater levels of behavioral under-control and neuroticism, and more psychiatric distress in relation to COAs. Compared to non-COAs they also showed lower scholastic accomplishment and poorer verbal ability. COAs were given Diagnostic Interview Schedule alcohol diagnoses in more frequency than non-COAs. Behavioral under-control and alcohol expectancies mediated the relationship between paternal alcoholism and offspring alcohol involvement. There were few gender vs. family history interactions, even though gender differences were found. The effects of family history of alcoholism were similar for men and women. Greater family history effects for women was shown when gender effects were found. (90).
43
Leiberman updated the review of literature on children of alcoholics. One of four children in the United States lives in a family where the child is exposed to alcoholism. He reported that children of alcoholics (COAs) are at risk of developing alcoholism, 2 to 10 times more than non-COAs (83). Studies that have attempted to identify risk factors that facilitate the raised vulnerability and the protective factors that control the risk have been reviewed in this paper. Factors involved include antisocial personality disorder in parent, externalizing behavior, internalizing symptoms, positive and negative alcohol-related expectancies and differential response to the influences of alcohol.
Christensen and Bilenberg in their study in Danish children of alcoholics found that in the subjects scored higher on symptoms on 17 out of the 118 items on CBCL. Girl children had higher scores than boys in most items. Girls showed higher scores for internalizing disorders and depression when the mother was the alcoholic. When the father was the alcoholic, it was the boys who showed higher scores on the same domains. These children demonstrated higher risk of having clinically significant scores on depression, internalizing and social deviance. Half of the children performed comparably well as the average reference population. Overall the study suggests how even though the children of alcoholics are clearly a high risk group, they might have diverse consequences due to the effects of alcoholism in parents (93).
44
children with alcoholic relatives apparently have a slightly larger propensity for drug abuse or dependence than those without relatives who consume alcohol (94). Dube et al reported that the adjusted odds ratio for each category of Adverse Childhood
Experiences (ACE) was approximately 2 to 13 times higher if either the father, mother, or both parents abused alcohol compared to persons who grew up with no parental alcohol abuse. Those who grew up with both parents as alcoholics had the highest chance of ACEs. The mean number of Adverse Childhood Experiences for persons with no parental alcohol abuse was 1.4. Those with alcohol abuse in father only had 2.6. Children with alcohol abuse in mother had 3.2. When they had both parents as alcoholics the number was 3.8 (95)
Ohannessian et al measured psychological symptomatology and clinical diagnosis in adolescents with alcoholic parents with and without comorbid drug use/psychopathology. They found that when parental psychopathology was absent, the adolescents with parents with only alcohol use did not show higher psychopathology than children with parents with no psychopathology. However, those who had parents with alcoholism along with drug use or depression showed higher psychopathology. When all 3 were present the risk of psychopathology was highest (96).
45
dependence was also associated with lower math achievement scores. Evidence indicated that adolescents' task orientation mediated the relation between parental alcohol dependence and adolescent grades, and between parental alcohol dependence and adolescent math achievement (98)
2.10.2 Indian Studies
46
duration and ESS. These preliminary findings suggested that high risk subjects have relative impairments in cortico-cortical and transcallosal inhibitory mechanisms. The resulting condition of CNS hyper excitability may be etiologically related to the excess of externalizing behaviors noted in this population, which might be a predisposition to a higher risk of developing early-onset alcoholism (101). Mahato et al compared the parent and child relationship in COAs and non-alcoholic parents.
Substantial difference was found in parent-child relationship, in the domains of symbolic punishment, rejecting, objective punishment, demanding, indifference, symbolic incentive, love, and neglect for father. In the child’s relationship with mother, significant difference was found in the domains of symbolic sentence, rejecting, object punishment, indifference and neglect (102). Stanley and Vanitha compared adolescent COAs and non-COAs for self-esteem and adjustment. COAs had poorer self-esteem. and poorer adjustment in all domains than non-COAs. This differences in the authors’ opinion was probably due to higher stress and dysfunctional domestic environment in families of COAs. They recommended better psychosocial intervention in population of COAs (103).
47
teetotallers/social drinkers’ children. In the study group, there was an elevated number of school dropouts among boys (52.73%) as compared to girls (35.37%). Parental illiteracy and school dropout children showed significant statistical association in both the groups (105).
2.11 Conclusion
48 3. AIMS AND OBJECTIVES
3.1 Aim: To assess the psychopathology and family functioning among children of
male patients with alcohol dependence 3.2 Objectives:
1. To estimate the prevalence of psychopathology in children of male patients with alcohol dependence
2. To assess the family functioning in families of alcohol dependent patients
3. To assess the sociodemographic and substance abuse related factors associated with child psychopathology in families of patients with alcohol dependence
4. To compare the family functioning in children with and without psychopathology in families of alcohol dependent patients.
3.3 Hypothesis:
1. Child psychopathology is associated with specific socio-demographic and substance abuse related factors in families of patients with alcohol dependence. 2. There is poorer family functioning in children with psychopathology in families of
49 3.4 Null Hypothesis
1. There is no significant association between child psychopathology and specific socio-socio-demographic and substance abuse related factors in families of patients with alcohol dependence.
50 4. MATERIALS AND METHODS
The study was done in the Department of Psychiatry of Christian Medical College, Vellore. Approval for the study was obtained from the Institutional Review Board Research and Ethics Committee of Christian Medical College, Vellore, Tamil Nadu. 4.1 Setting
The participants of the study were enrolled from the department of Psychiatry of CMC, Vellore. The department offers treatment for various psychiatric disorders including alcohol dependence syndrome. The age group of patients attending the clinic is above 18 years. The patients mainly hail from Vellore and adjoining areas, various parts of Tamil Nadu, nearby states of Kerala, Andhra Pradesh and Karnataka. as well as from distant North Indian states like West Bengal, Jharkhand, Assam and Chhattisgarh. Some patients come from foreign countries like Bhutan, Nepal, Bangladesh and the countries from the Middle East. The diagnosis and treatment is offered by the consultant Psychiatrists and the trainee doctors, with the help of Psychologists, Occupational therapists and Nurses.
4.2 Study Design
A cross sectional observational study design was followed for this study. 4.3 Participants
4.3.1 Inclusion Criteria
4.3.1.1 Parent:
Father: Diagnosed with Alcohol Dependence Syndrome according to ICD-10 clinical
51
Three or more of the following have been existing together at some time through the preceding year:
(a) A strong craving or sense of compulsion to consume the substance; (b) Difficulty in controlling substance-taking behavior in terms of its onset, cessation, or levels of use
(c) A physiological withdrawal state when substance consumption has stopped or been decreased, as shown by: the characteristic withdrawal syndrome for the substance; or consumption of the same or a closely related substance with the aim of getting rid of or evading withdrawal symptoms
(d) Evidence of tolerance, such that greater doses of the psychoactive substances are essential in order to attain effects formerly produced by lower doses
(e) Progressive disregard of alternative pleasures or interests because of psychoactive substance use, greater amount of time necessary to obtain or consume the substance or to recuperate from its effects
(f) Persisting with substance use regardless of clear evidence of obviously harmful consequences.
Mother: staying with child for at least past 6 months
4.3.1.2 Child:
1. Children of age group 6 to 18 years (Random selection, by picking lots, if multiple children in specified age group in same family)
2. Children with their primary caregivers (parents)
3. Child staying with mother for the past 6 months (and not in hostel)
52 4.3.2 Exclusion Criteria
1. Presence of severe sensory special sensory impairment, organic impairment or below moderate level of intellectual disability in child assessed clinically. 2. Informed consent/assent not obtained.
3. Current major mental illness in mother.
4.4 Sampling Technique
The sampling technique used for this study was purposive sampling technique. Consecutive patients presenting in the Psychiatry OPD with Alcohol Dependence Syndrome were identified. Those who fulfilled the criteria after the inclusion and exclusion criteria were applied were recruited for the study.
4.5 Sample Size
The required sample size to show that the prevalence of psychopathology among children whose father was alcoholic was found to be 110 children with 7.5% precision and 95% confidence limits
Prevalence
Single Proportion – Absolute Precision
Expected proportion 0.18
Precision 7.5
Desired confidence level (1- alpha) % 95
53 Risk Factors
Regression Methods – Multiple Logistic Regression
Proportion of disease 0.18
Anticipated odds ratio 2.5
Power (1- beta) % 80
Alpha error (%) 5
1 or 2 sided 2
Multiple correlation coefficient of the exposure 0.2
Required sample size 108
4.6. Variables Studied
4.6.1 Dependent Variable: Psychopathology as assessed by Child Behaviour
Check List (CBCL)
4.6.2 Independent variables:
1. Socio-demographic variables of child and family members: age, gender, religion, socio-economic status, residence, educational level, occupation of primary caregiver, type of family (nuclear/ joint), number, age and gender of siblings, birth order of the child.
2. Alcohol related variables: Presence of comorbidity, severity index, duration of alcohol dependence, current use, periods of abstinence,
54 4.7 Data Measures
The following Instruments were used to collect data:
4.7.1 Sociodemographic and Clinical Data Form (vide annexure 1) 4.7.2 Modified Kuppuswamy Scale (vide annexure 2)
4.7.3 McMaster Family Assessment Device (vide Annexure 3) 4.7.4 Child Behavior Check List (CBCL) (vide annexure 4) 4.7.5 Addiction Severity Index (vide annexure 5)
4.7.1 Sociodemographic and clinical data form
55
recorded. This included age, educational level, occupation, period of time mother was staying with the child and presence of any previously diagnosed psychiatric illness in mother. The approximate time required for collecting data for sociodemographic and clinical data was about 15 minutes.
Socioeconomic status
4.7.2 The Modified Kuppuswamy scale (with revised income ranges for 2014).
This scaledetermines the socioeconomic status of the family based on the education, occupation of head of the family and per capita income per month. Originally created by Kuppuswamy in 1976 (99), the form underwent revisions in 2003, 2007, 2012 and 2014. Each of the three domains has seven items arranged in decreasing order of score. One item is selected from each domain, and the corresponding scores are added to give a total score, which is graded in 5 levels to represent socioeconomic status from lower (score of less than 5) to upper (score of 26 to 29) (100).
Family Functioning
4.7.3 McMaster Family Assessment Device:
56
response options comprise of strongly disagree, disagree, agree, and strongly agree. Items are reverse scored as needed, such that higher the score worse is the family functioning. The FAD general functioning scale was scored and according to Ryan et al a score of 2.00 or above indicates problematic family functioning. The higher the
score, the more problematic the family member perceives the family's overall functioning (103). In addition to a General Functioning Index, the MFAD generates scores on six dimensions namely problem solving, communication, roles, affective responsiveness, affective involvement, and behavioral control.
The MFAD has been widely used in research as well as and clinical practice. Uses include: (1) screening to detect families experiencing problems, (2) recognizing specific domains in which families are experiencing problems, and (3) evaluating change following treatment.
Child psychopathology
4.7.4 Child Behaviour Checklist (CBCL):
57
breaking behavior, aggressive behavior, other problems. It is also divided into Internalizing and Externalizing behavior along with a total score indicating presence or absence of any psychopathology. The CBCL 6-18years version also has an option of DSM –IV oriented scales. The six DSM-Oriented Scales include: (1) Affective Problems (major depressive disorders and Dysthymia), (2) Anxiety Problems [Generalized Anxiety Disorder (GAD), Separation Anxiety Disorder (SAD), and Specific Phobia], (3) Attention Deficit Hyperactivity Problems (Hyperactive-Impulsive and Inattentive subtypes), (4) Conduct Problems [Conduct Disorder (CD)], (5) Oppositional Defiant Problems [Oppositional Defiant Disorder (ODD)], and (6) Somatic Problems (Somatization and Somatoform Disorders).
Severity index for alcohol dependence
4.7.5 Addiction Severity Index:
Addiction Severity Index (ASI) was developed by McLellan and co-workers in 1980 (104), the ASI has been translated into seventeen languages and was designed to be administered by a skilled assessor. The version currently in use is the 5th edition which was published in 1992 (105). This is a semi structured interview intended to provide vital information about characteristics of the life of patients that may influence their substance-abuse problems. It has been shown to be useful especially in diagnosis and treatment of alcohol use problems.
58
These functional areas have been extensively validated to be associated with substance use and are central to understanding alcohol dependence. In each domain, individual data is collected regarding frequency, duration and severity. ASI takes into consideration the various aspects of each subscale for its characteristic over the lifetime and in the 30-day period before the interview. This is based on the knowledge that severity of substance related problems are best reflected when life events before, during and subsequent to substance use are taken into consideration. Within each subdomain, ASI provides 2 ratings. First is a 10-point severity rating determined by the interviewer. This is a rating of lifetime problems. Second, is a multi-item, composite score which can be calculated manually or can be computer-generated (106). This is a rating of severity of problems in the past 30 days.
59 4.8 Data Collection Procedure
All data were collected by the primary investigator, except for the alcohol-related clinical variables which were collected by an independent assessor. The sources of information were, the father with alcohol dependence syndrome, mother of the child and occasionally the child. The patients were diagnosed as having Alcohol Dependence Syndrome by the Psychiatrists using the ICD-10 criteria. They were then referred to the primary investigator by the treating Psychiatrist. Inclusion and exclusion criteria were applied and suitable candidates were recruited for the study after obtaining the consent from the parents and assent from the child when feasible. To reduce bias, the data were collected in the following order. At first the Sociodemographic and clinical data sheet was applied, followed by the Modified Kuppuswamy Scale, then the Child Behavior Checklist(CBCL), followed by McMaster Family assessment device and then the Addiction Severity Index. The conversion of the CBCL raw scores to T score to determine caseness, was done by an independent assessor after data collection, in order to reduce bias. The time taken to complete each case was between 40 minutes to 1 hour.
4.9 Statistical Method
continuous variables. Univariate logistic regression was done for variables found to be significant in the bivariate analysis. All data was analysed using SPSS version 17. 4.10 Ethical issues
The study was conducted only after it was approved a
Review Board and Ethics Committee of Christian Medical College, Vellore.
Written informed consent from the patients and written assent from the child was taken before proceeding to recruit the child for the study.
[image:60.595.75.531.300.739.2]4.11 Algorithm
Figure 1. Algorithm Showing Methodology Setting: Psychiatry Out Patient
Department of CMC Vellore.
If both consent and assent is obtained, then recruited in the study.
Filling up of Sociodemographic Data Sheets and administering Modified Kuppuswamy Scale with revised
income ranges.
Preparation of Final Thesis Document.
60
continuous variables. Univariate logistic regression was done for variables found to be significant in the bivariate analysis. All data was analysed using SPSS version 17.
The study was conducted only after it was approved and accepted by the Institutional Review Board and Ethics Committee of Christian Medical College, Vellore.
Written informed consent from the patients and written assent from the child was taken before proceeding to recruit the child for the study.
Figure 1. Algorithm Showing Methodology Consecutive cases diagnosed by
Psychiatrist as Alcohol Dependence Syndrome according to ICD-10 Criteria who have children between 6
to 18 years of age, from December 2015 to September 2016.
Application of Inclusion and Exclusion
Providing information sheet and Obtaining consent from primary
caregiver and assent from the child or adolescent for participation in the
study.
Primary outcome variable assessed first ie, Child Behaviour Check
List(CBCL).
Family functioning assessed with McMaster Family Assessment Device.
Administering Addiction Severity Data entry and Statistical analysis.
continuous variables. Univariate logistic regression was done for variables found to be significant in the bivariate analysis. All data was analysed using SPSS version 17.
nd accepted by the Institutional Review Board and Ethics Committee of Christian Medical College, Vellore.
Written informed consent from the patients and written assent from the child was
Application of Inclusion and Exclusion Criteria.
Providing information sheet and clarifying doubts if any.
Family functioning assessed with McMaster Family Assessment Device.
5. RESULTS
The cross-sectional study was done in the Psychiatry department of Christian Medical College, Vellore, India from March 2016 to September 2016. A total sample of 72 patients with alcohol dependence syndrome along with their spouse and child were recruited during the study period.
Diagnosed with Alcohol Dependence Syndrome according to ICD
Inclusion Criteria met for recruitment in study
(n = 91)
Declined Participation in
Study (n = 19)
Number of participants interviewed with Sociodemographic Data Sheet, Modified Kuppuswamy Scale with revised income ranges, Child Behaviour Check List(CBCL), Family functioning assessed with McMaster Family Assessment Device and Addiction Severity
61
sectional study was done in the Psychiatry department of Christian Medical College, Vellore, India from March 2016 to September 2016. A total sample of 72 dependence syndrome along with their spouse and child were recruited during the study period.
Strobe diagram of the study
Diagnosed with Alcohol Dependence Syndrome according to ICD-10 Criteria who have children
between 6 to 18 years of age (n = 93)
Inclusion Criteria met for recruitment in study
Informed Consent and Assent obtained
(n = 72)
Number of participants interviewed with Sociodemographic Data Sheet, Modified Kuppuswamy Scale with revised income ranges, Child Behaviour Check List(CBCL), Family functioning assessed with McMaster Family Assessment Device and Addiction Severity
Index. (n = 72)
Excluded from study (n = 2)
Reason for exclusion: Current major mental illness in
Mother (n = 2)
sectional study was done in the Psychiatry department of Christian Medical College, Vellore, India from March 2016 to September 2016. A total sample of 72 dependence syndrome along with their spouse and child were
Diagnosed with Alcohol Dependence Syndrome 10 Criteria who have children
Number of participants interviewed with Sociodemographic Data Sheet, Modified Kuppuswamy Scale with revised income ranges, Child Behaviour Check List(CBCL), Family functioning assessed with McMaster Family Assessment Device and Addiction Severity
Excluded from study (n = 2)
Reason for exclusion: Current major mental illness in
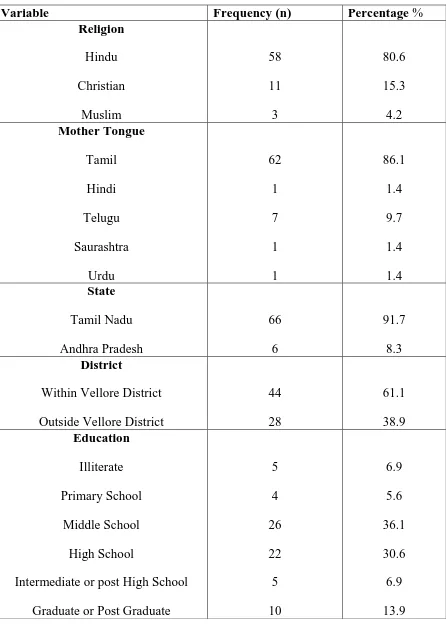
62 5.1 PATIENT DEMOGRAPHICS
Table 1: Socio demographic characteristics of patient diagnosed with alcohol dependence syndrome.
Variable Frequency (n) Percentage %
Religion Hindu Christian Muslim 58 11 3 80.6 15.3 4.2 Mother Tongue Tamil Hindi Telugu Saurashtra Urdu 62 1 7 1 1 86.1 1.4 9.7 1.4 1.4 State Tamil Nadu Andhra Pradesh 66 6 91.7 8.3 District
Within Vellore District Outside Vellore District
44 28 61.1 38.9 Education Illiterate Primary School Middle School High School
Intermediate or post High School Graduate or Post Graduate
[image:62.595.77.523.140.767.2]63 Occupation
Unskilled worker Semiskilled worker
Skilled worker
Clerical, Shop Owner, Farmer Semi-Profession Profession 17 6 27 15 1 6 23.6 8.3 37.5 20.8 1.4 8.3 Income Rs. 1866-4446 Rs. 4447-9248 Rs. 9249-13873 Rs. 13874-18497 Rs. 18498-36996 >/= Rs.36997 8 27 19 8 7 3 11.1 37.5 26.4 11.1 9.7 4.2 Socio-Economic Status Upper Upper-Middle Middle/Lower-Middle Lower/Upper-Lower 2 13 27 30 2.8 18.1 37.5 41.7
Variable Mean Standard
Deviation
Age of Patient (years) 40.14 5.70
64
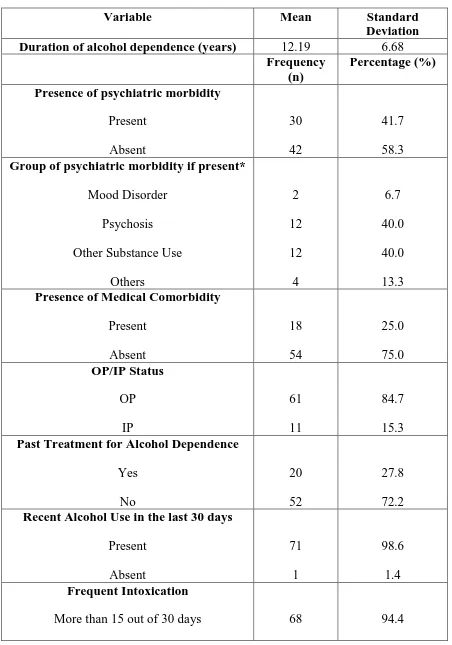
[image:64.595.65.517.122.767.2]5.2 CLINICAL CHARACTERISTICS OF PATIENT
Table 2a: Clinical Characteristics of the patient with alcohol dependence
Variable Mean Standard
Deviation
Duration of alcohol dependence (years) 12.19 6.68
Frequency (n)
Percentage (%)
Presence of psychiatric morbidity
Present Absent 30 42 41.7 58.3 Group of psychiatric morbidity if present*
Mood Disorder Psychosis Other Substance Use
Others 2 12 12 4 6.7 40.0 40.0 13.3 Presence of Medical Comorbidity
Present Absent 18 54 25.0 75.0 OP/IP Status OP IP 61 11 84.7 15.3 Past Treatment for Alcohol Dependence
Yes No 20 52 27.8 72.2 Recent Alcohol Use in the last 30 days
Present Absent 71 1 98.6 1.4 Frequent Intoxication
65
Less than 15 out of 30 days 4 5.6
Number of Delirium Tremens
0 1 2
58 13 1
80.6 18.1 1.4 Comorbid Nicotine Dependence
Present Absent
17 55
23.6 76.4 *n only of patients with psychiatric morbidity
66
Table 2b: Addiction Severity Index Scores- Composite scores and Interviewer rated mean scores
Variable Mean Median SD
Composite Medical ASI
0.11 0.00 0.24
Composite Employment/Support
ASI
0.42 0.29 0.28
Composite Alcohol ASI
0.67 0.7! 0.17
Composite Drug ASI 0.01 0.00 0.06
Composite Legal ASI 0.41 0.00 0.14
Composite Family/Social ASI
0.31 0.30 0.23
Composite Psychiatric ASI
0.13 0.00 0.24
Mean Medical Status Interviewer rating
ASI
1.11 0.00 2.26
Mean
Employment/Support Status Interviewer
rating ASI
2.74 2.00 2.76
Mean Alcohol Status Interviewer rating
ASI
6.46 7.00 1.83
Mean Drug Status Interviewer rating
ASI
0.11 0.00 0.94
Mean Legal Status Interviewer rating
ASI
0.58 0.00 1.82
Mean Family/Social Status Interviewer
rating ASI
2.79 3.00 2.04
Mean Psychiatric Status Interviewer
rating ASI
1.42 0.00 2.55
[image:66.595.69.518.112.662.2]67
Table 2c: Correlation of ASI means and composite scores
Variable Mean
Scores (means)
Composite scores (means)
Spearmans rho
p value
Medical ASI 1.11 0.12 0.99 0.000
Employment/Support ASI
2.74 0.42 0.71 0.000
Alcohol ASI 6.46 0.68 0.79 0.000
Drug ASI 0.11 0.01 0.57 0.000
Legal ASI 0.58 0.41 0.94 0.000
Family/Social ASI 2.79 0.311 0.83 0.000
Composite Psychiatric ASI
1.42 0.13 0.98 0.000
p value taken significant at <0.05
There was significant correlation between the interviewer rated means and the composite scores for all subdomains
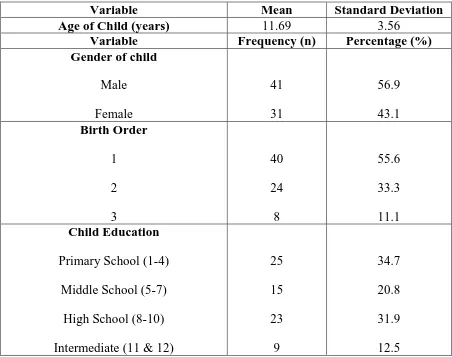
[image:67.595.187.417.372.734.2]68 5.3 CHILD DEMOGRAPHICS
Table 3: Sociodemographic characteristics of children of patients with alcohol dependence
Variable Mean Standard Deviation
Age of Child (years) 11.69 3.56
Variable Frequency (n) Percentage (%)
Gender of child
Male Female 41 31 56.9 43.1 Birth Order 1 2 3 40 24 8 55.6 33.3 11.1 Child Education
Primary School (1-4) Middle School (5-7)
High School (8-10) Intermediate (11 & 12)
25 15 23 9 34.7 20.8 31.9 12.5
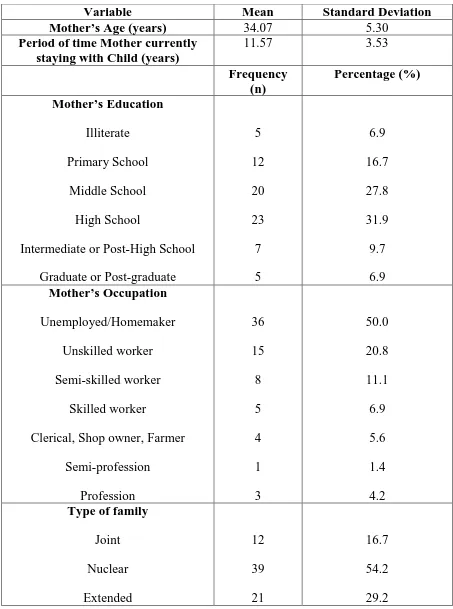
[image:68.595.66.518.143.500.2]69
[image:69.595.65.518.155.764.2]5.4 MOTHER AND FAMILY RELATED VARIABLES Table 4: Characteristics of the mothers of children in study
Variable Mean Standard Deviation
Mother’s Age (years) 34.07 5.30
Period of time Mother currently staying with Child (years)
11.57 3.53
Frequency (n) Percentage (%) Mother’s Education Illiterate Primary School Middle School High School
Intermediate or Post-High School Graduate or Post-graduate
5 12 20 23 7 5 6.9 16.7 27.8 31.9 9.7 6.9 Mother’s Occupation Unemployed/Homemaker Unskilled worker Semi-skilled worker Skilled worker
Clerical, Shop owner, Farmer Semi-profession Profession 36 15 8 5 4 1 3 50.0 20.8 11.1 6.9 5.6 1.4 4.2 Type of family
70 Number of Children
1 2 3 4 4 47 20 1 5.6 65.3 27.8 1.4 Psychiatric Morbidity in extended
family Present Absent 40 32 55.6 44.4 Group of Psychiatric illness in
family Psychosis Substance Use 4 36 10.0 90.0
5.5. ASSESSMENT OF FAMILY FUNCTIONING
Family functioning was assessed using McMaster’s Family Assessment Device (MFAD). It is a 60 item self
aspects of family relationships based on McMaster model of family functioning. The rating is done on a Likert scale from 1 to 4. The FAD general functioning scale was scored and a score of 2.00 or above indic
[image:71.595.67.513.249.297.2]higher the score, the more problematic the family member perceives the family's overall functioning. Mean, median and standard deviation are described.
Table 5a: FAD General Functioning Score Variable
FAD General Functioning Score
Figure 2: Distribution of General Functioning Scores in the study population
71
AMILY FUNCTIONING
[image:71.595.78.522.361.717.2]Family functioning was assessed using McMaster’s Family Assessment Device (MFAD). It is a 60 item self-report questionnaire aimed at evaluating a number of aspects of family relationships based on McMaster model of family functioning. The rating is done on a Likert scale from 1 to 4. The FAD general functioning scale was scored and a score of 2.00 or above indicates problematic family functioning. The higher the score, the more problematic the family member perceives the family's overall functioning. Mean, median and standard deviation are described.
Table 5a: FAD General Functioning Score
Mean Median Standard Deviation
FAD General Functioning 2.43 2.30
Figure 2: Distribution of General Functioning Scores in the study population
Family functioning was assessed using McMaster’s Family Assessment Device t questionnaire aimed at evaluating a number of aspects of family relationships based on McMaster model of family functioning. The rating is done on a Likert scale from 1 to 4. The FAD general functioning scale was ates problematic family functioning. The higher the score, the more problematic the family member perceives the family's overall functioning. Mean, median and standard deviation are described.
Standard Deviation 0.79
72 Table5b:
FAD General Functioning Score Number (n) Percentage (%) Problematic family functioning
(G F Score ≥2.00)
47 65.3
Non-problematic family functioning (G F Score <2.00
25 35.7
Almost 2/3rd of the study population had problematic family functioning as rated by the general functioning score.