New light on literacy
and numeracy
SUMMARY REPORT
This document is also available in pdf and text only format from the NRDC's website, www.nrdc.org.uk. It is the summary version
of the project’s full report, New Light on Literacy and Numeracy, Bynner, J and Parsons, S (2006), which will be published in November 2006.
For information on alternative formats, please contact:
Emily Brewer
Marketing and Publications Officer Institute of Education
University of London Tel: 020 7911 5501 Email: [email protected]
We welcome feedback on the content and accessibility of this publication. This should be sent to:
Publications NRDC
Institute of Education 20 Bedford Way
London WC1H 0AL.
Telephone: +44 (0)20 7612 6476 Fax: +44 (0)20 7612 6671 email: [email protected]
ISBN 1-905188-20-X
©Crown Copyright 2006
on condition that the source is acknowledged.
NRDC is a consortium of partners led by the Institute of Education, University of London (see back cover for a list of members) and is part of the Bedford Group for Lifecourse and Statistical Studies at the IoE.
www.ioe.ac.uk/bedfordgroup
Design: [email protected] Print: Redlin
4
Introduction
7
Why don’t more adults go
on courses?
11
Who has poor skills?
16
What happens to adults
whose skills change over
time?
20
How does dyslexia relate to
problems with literacy and
numeracy?
25
From generation to
generation
29
What does this mean for
policy and research?
33
Tables: literacy and
numeracy levels
New light on
literacy and
numeracy
SUMMARY REPORT
John Bynner and Samantha Parsons
Previous research has shown that poor basic skills are a major obstacle to achievement in many areas of adult life. It follows that enhancing literacy and numeracy skills will produce both social and economic benefits. The research reported here has taken place against the background of a major government initiative in Britain, Skills for Life, that is tackling the problem of poor basic skills in a substantial minority of the
population. An important goal of this programme is to investigate in much greater depth than previously the ways in which poor basic skills impede social and economic life in modern Britain.
This report is the latest in a series drawing on data from the 1958 and 1970 British birth cohort studies, which have followed up individuals throughout their lives, with new data about the cohort
members collected at regular intervals1.
The National Child Development Study (NCDS) has followed up all 17,000 individuals born in a single week in 1958. The 1970 British Cohort Study (BCS70), which is the subject of this report, has followed up all 16,500 individuals born in a single week in 1970. In 1981, when the NCDS cohort members were aged 23, they were asked to appraise their own basic skills difficulties. This identified a small but significant minority who acknowledged serious problems with written communications and number work. It was then possible to show the extent to which self-assessed basic skills difficulties were correlated with a range of indicators of disadvantage in adult life.
This work was followed, first at age 21 in BCS70 (1991), and later, at age 37 in
1 Bynner, J. and Parsons, S. (1997) It Doesn't Get Any Better: the impact of poor basic skills on the lives of 37 year olds, London: Basic Skills Agency.
Phot
o: T
om Pils
An important goal of this programme is to investigate in much greater depth than previously the ways in which poor basic skills impede social and economic life in modern Britain
2 Parsons, S. and Bynner, J. (2005) Measuring Basic Skills for Longitudinal Study: The design and development of instruments for use with cohort members in the age 34 follow-up in the 1970 British Cohort Study (BCS70). London: National Research and Development Centre for Adult Literacy and Numeracy
http://www.nrdc.org.uk/c ontent.asp?CategoryI D=424
NCDS (1995), by objective assessments of the literacy and numeracy skills of a representative 10 per cent sample of the cohort members. This showed much more widespread problems with literacy and, particularly, numeracy than the earlier self-appraisal data had indicated, together with disadvantaged education careers, patchy work histories, low grade jobs, casual work and unemployment of the adults involved. Women in this situation frequently left the labour market, opting for early partnership and early child-bearing.
The BCS70 follow-up survey at age 34 in 2004 included, for the first time, a major basic skills component. Two
developments made this possible – an Economic and Social Research Council funded follow-up survey of BCS70 and the establishment of the NRDC, with a budget from the Skills for Life Strategy Unit to carry out large-scale research.
■First, the entire BCS70 cohort was assessed.
■Second, new tests were developed which would be fit for the specific purpose of this research.
■Third, the work focused on the longer-term consequences of basic skills weaknesses in adults, and on the socio-economic benefits to be gained from improving these skills.
■Fourth, through additional funding from the European Social Fund, it was possible to assess the cognitive development and reading and maths performance of the children of a representative 1 in 2 sample of cohort members.
The BCS70 2004 survey
New assessment instruments were developed for the 2004 survey. These included some test items from the Skills for Life Survey (2003)2
, so that it was possible to compare our results. The national standards for adult literacy and numeracy are specified at three levels: Entry Level, Level 1 and Level 2. Entry level is further divided into three sub-levels: Entry 1, Entry 2 and Entry 3 to describe in detail the small steps required for adults to make progress. (See tables A1 and A2 in the Appendix which set the skills required at these different levels.) The comparison between survey results showed that the literacy and numeracy standards of the BCS70 cohort at age 34 were slightly higher than those of the respondents in the Skills for Life survey, with just 8 per cent having below Level 1 literacy compared with 13 per cent of the 30 to 35-year-olds in the Skills for Life survey. The distributions were more similar for numeracy, but slightly fewer BCS70 cohort members performed at the lowest level (at or below Entry Level 2).
The two main parts of the survey comprised the Core Interview, which was completed by 9,665 cohort members, and the Parent and Child Interview, which was completed by 2,846 cohort members including information on 5,207 of their children. These samples were fully representative of the original cohort.
The Core Interview involved:
■A personal interview that updated the cohort members’ lives in respect of education, housing, health, work, home and family life, social attitudes and opinions. Respondents were also asked to report any basic skills difficulties.
■Adult assessments. These specially-designed assessments measured the cohort members’ literacy and numeracy skills and the presence of some symptoms associated with dyslexia.
The Parent and Child Interview contained:
■An interview in which cohort members answered questions about the health, care and education experiences of each of their resident natural or adopted children aged up to 16 years 11 months.
■A parent self-completion paper questionnaire about parenting styles, the development of their children, and their educational aspirations for them.
■A self-completion paper questionnaire for children aged between 10 years and 16 years 11 months, in which they answered questions about their activities at home and at school, their attitudes, self-esteem and own educational aspirations.
■Assessments of the cognitive skills of the children aged between 3 years and 16 years 11 months (British Ability Scales Second Edition, BAS II, published by NFER-Nelson).
Following extensive piloting of the new assessment instruments, the main fieldwork was carried out between February 2004 and May 2005.
It needs to be stressed that the primary aim of this report is descriptive. We present patterns of relationships between basic skills and other variables, without any implications of cause and effect. Other factors may also be involved which we shall investigate in later work. Nevertheless, our analyses pointing to strong relationships between poor basic skills and other variables, signal the areas where significant policy challenges are likely to arise.
Our analyses pointing to strong relationships between poor basic skills and other variables, signal the areas where significant policy
Why don’t more
adults go on
courses?
If adults are going to want to improve their literacy and numeracy skills, they must first recognise that they have poor skills, and then see this as a problem. Such recognition is rare, even where objective tests show a considerable problem. Yet without it, motivation to attend literacy and numeracy classes is likely to be poor.
Over the years, in both NCDS and BCS70 surveys, the proportion of cohort members reporting problems with basic skills has been remarkably consistent: 3 per cent to 4 per cent reading, 3 per cent to 5 per cent numbers, and between 4 per cent and 12 per cent for writing and/or spelling.
However, many respondents who perform very poorly on objective tests do not acknowledge any difficulty, and some who acknowledge a difficulty have average or better scores on tests. Nevertheless, self-appraisal is closely linked to the
Table 1a: % reporting difficulties in response to the Reading questions
READING
NCDS age 42 BCS70 age 30 BCS70 age 34 (2000) (2000) (2004)% % %
Any reading difficulty? 3% 3% 8%
Can you usually read and understand what
is written in a magazine or newspaper? 3% 3% 2%
Can you read aloud to a child from a children's storybook? * * 2%
Can you usually read and understand any
paperwork or forms you would have to deal with? * * 7%
[image:8.496.36.464.267.426.2]n(100%) 11,419 11,261 9,349
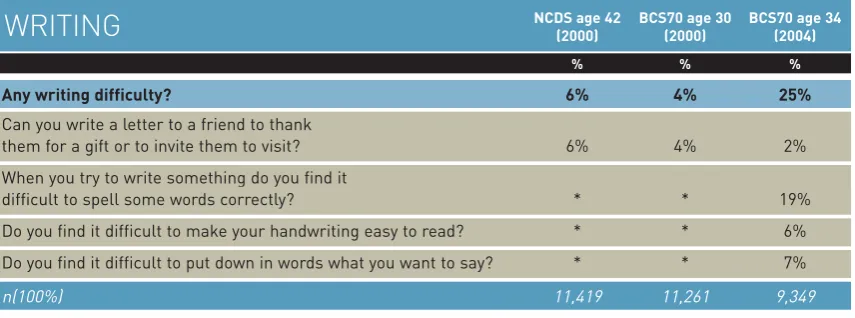
Table 1 b: % reporting difficulties in response to the Writing questions
WRITING
NCDS age 42 BCS70 age 30 BCS70 age 34 (2000) (2000) (2004)% % %
Any writing difficulty? 6% 4% 25%
Can you write a letter to a friend to thank
them for a gift or to invite them to visit? 6% 4% 2%
When you try to write something do you find it
difficult to spell some words correctly? * * 19%
Do you find it difficult to make your handwriting easy to read? * * 6%
Do you find it difficult to put down in words what you want to say? * * 7%
n(100%) 11,419 11,261 9,349
Table 1 c: % reporting difficulties in response to the Number questions
MATHS, NUMBERS AND ARITHMETIC
NCDS age 42 BCS70 age 30 BCS70 age 34 (2000) (2000) (2004)% % %
Any number / maths difficulty? 2% 2% 11%
When you buy things in shops with a five or ten pound note,
can you usually tell if you have the right change? 2% 2% 1%
Do you find it difficult to recognise numbers when you see them? * * 1%
Do you ever have difficulty adding up? * * 2%
Do you ever have difficulty with subtraction – that is taking
one number away from another? * * 3%
Do you ever have difficulty with multiplication? * * 6%
Do you ever have difficulty with division? * * 9%
n(100%) 11,419 11,261 9,630
[image:8.496.39.463.450.637.2]WHY DON’T ADULTS GO ON MORE COURSES?
What did the 2004 survey show? Respondents were asked three questions on reading difficulties, four questions on writing difficulties and six on number and maths difficulties.
The results are shown in Tables 1a, 1b and 1c, which compare the results for the
same questions in the 1999/2000 NCDS and BCS70 surveys. The 2004 figures are higher than those from the earlier survey as all of the 2004 respondents were asked specific questions about reading, writing and numbers problems rather than just about general difficulties, as in the previous surveys.
Closer analysis of the differences between men and women showed that:
■for the three aspects of reading, marginally more men than women reported difficulties
■24 per cent of men and 15 per cent of women reported difficulties with spelling, and 10 per cent of men and 3 per cent of women with
handwriting
For number, the differences between men and women were reversed:
■4 per cent of men and 8 per cent of women said they had difficulties with multiplication
■7 per cent of men and 10 per cent of women reported difficulties with division
Phot
o: iSt
Conclusion
This low self-awareness of basic skills
difficulties is not surprising among adults, most
of whom manage their lives well and learn to
cope with any skills difficulties that they have.
However, by putting questions about highly
specific difficulties to the whole sample, not, as
in the past, just to those who acknowledged
difficulties generally, the proportions increased.
The significance for policy is that, once their
awareness is raised, people appear likely to
become interested in improving their skills. The
very low number of adults who report difficulties
with reading, writing or numbers should be set
against the significant proportion of those
acknowledging a problem who say that they
want to improve their skills.
This is both a challenge and an opportunity for
the Skills for Life strategy.
Going on courses and wanting to improve basic skills
Although the figures are very low, more of the men and women who reported skills difficulties in 2004 also reported that they had been on a course in the past four years to help overcome these difficulties (about 3 per cent), compared with those who did not report difficulties (1 per cent).
As many as 20 per cent of the men and women in the whole cohort wanted to improve their reading, writing or number skills, with more men reporting that they wanted to improve their writing skills (12 per cent men, 7 per cent women) and more women their grasp of numbers (10 per cent men, 15 per cent women).
Who has
poor skills?
To be able to cross-reference our findings to earlier NCDS (age 37) and BCS70 (age 21) surveys, but also to benchmark against the new Skills for Life standards, new literacy and
numeracy assessment instruments were designed for the BCS70 2004 (age 34) survey. The SfL survey used multiple-choice test items that were presented on the interviewer’s lap-top computer. In the previous cohort study literacy and numeracy assessments, the test items were presented by the interviewer as visual stimuli and responded to in ‘open response’ mode (that is, without seeing any predetermined range of possible answers). The new assessments
combined both methods. Multiple-choice items were included from the Skills for Life survey at the different performance levels reflecting the SfL standards. A
selection of open response test items was taken from the earlier BCS70 age-21 survey, again to reflect the SfL standards. For each type of test, a score was constructed for each performance level and for performance in the assessment as a whole.
Self-awareness of skills difficulties and the desire to improve
Literacy
Overall, 8 per cent of cohort members reported difficulties with reading. However, this increased to as many as 30 per cent of men and 22 per cent of women with Entry Level 2 literacy. The difficulties were most likely to be related to understanding paperwork and forms. Notably, as many as 70 per cent of men and 88 per cent of women did not acknowledge any difficulty. Similarly, whereas 25 per cent of all cohort members reported some difficulty with writing, this increased to 61 per cent of men and 39 per cent of women assessed with Entry Level 2 literacy. Most of the reported difficulties were associated with spelling, but 25 per cent of men and 13 per cent of women with Entry Level 2 literacy said they struggled ‘to put down in words’ what they wanted to say.
Men and women with Entry Level 2 literacy were the most likely to want to improve their reading or writing skills but only 6 per cent of men and 3 per cent of women had been on a course to help them to do so.
Numeracy
As many as 25 per cent of men and women with Entry Level 2 numeracy reported having some difficulties with numbers and mathematical calculations in comparison with just 3 per cent with Level 2 numeracy. As expected, most of the difficulties were associated with
multiplication and division. Notably, around three-and-a-half times as many men and women with Entry Level 2 numeracy wanted to improve their numeracy skills, compared with men and women with Level 2 numeracy (18 per cent to 5 per cent for men, 26 per cent to 7 per cent for women). However, only 2 per cent of men and women with Entry Level 2 numeracy had been on a course to help improve their grasp of numbers.
Academic qualifications
As might be expected, there were considerable differences in highest-achieved academic qualification between the literacy and numeracy skills groups. Whereas one in three men and women with Level 2 literacy had a degree, just 7 per cent of women and 4 per cent of men with Entry Level 2 literacy were qualified at this level. Differences by numeracy for those holding a degree or higher were even greater.
At the other end of the academic scale, nearly one in two men with Entry Level 2 literacy had no academic qualifications at all, compared with just 6 per cent with Level 2 literacy. For women, 41 per cent with Entry Level 2 literacy had no academic qualifications compared with just 4 per cent of women with Level 2 literacy.
WHO HAS POOR SKILLS?
Employment Men
Men with a poor grasp of literacy or numeracy were the least likely to be in full-time work, particularly in modern service-sector jobs, at age 34. In comparison with men with Level 2 numeracy, men with Entry Level 2 were half as likely to have used a computer at work (43 per cent to 84 per cent) or to have received work-related training from their employer (18 per cent to 38 per cent). Men with Entry Level 2 literacy were one third as likely to have used a computer at work (26 per cent to 78 per cent) or to have received work-related training from their current employer (12 per cent to 35 per cent).
Women
Almost one in four women (24 per cent) with Entry Level 2 literacy had a full-time job at age 34 compared with around half (48 per cent) of women with Level 2 skills. Those with poor skills were less likely to be in the more desirable office-based secretarial/administrative positions. Whereas more than 80 per cent of women with Level 2 skills used a computer at work, this declined to 56 per cent for women with Entry Level 2 numeracy and just 39 per cent for women with Entry Level 2 literacy.
Only about one in five women in work had received work-related training, but this reduced to one in ten for women with Entry Level 2 literacy and one in six for those with Entry Level 2 numeracy, probably as a result of the high numbers in low-skilled casual work.
Family life
Men and women with the poorest grasp of literacy were the least likely to be married or cohabiting at age 34 (52 per cent men, 61 per cent women, compared with 68 per cent men and 70 per cent women overall). Whereas the majority of such men had no children, more of the women in this position had become parents (5 per cent men, 23 per cent women). Almost one in four women (24 per cent) with Entry Level 2 literacy had three or more children by age 34, compared with 10 per cent of all women with Level 2 literacy or numeracy, and they were twice as likely to have been a teenage mother.
Differences of this kind were far less evident between numeracy groups.
Almost one in four women with Entry Level 2 literacy had three or more children by age 34, compared with 10 per cent of women with Level 2 literacy or numeracy, and they were twice as likely to have been a teenage mother
Phot
o: John Bir
d
Socio-economic status At home
Just over eight in ten men and women with Level 2 literacy skills were home-owners, but this fell to less than half of men and women with Entry Level 2 literacy. Also, whereas 4 per cent of men and women with Level 2 numeracy and 6 per cent with Level 2 literacy lived in an overcrowded home (more than one person per room), this increased at least threefold for men and women with Entry Level 2 literacy or numeracy, and was highest at 21 per cent for women with Entry Level 2 literacy.
Local area
The BCS70 survey in 2004 was the first to include questions about cohort members’ local area. These showed that those with poor literacy and numeracy felt less safe living in their area. Their poor local environment was another source of disadvantage in their lives.
Finances
Men and women with Entry Level 2 literacy or numeracy, or their partner if they had one, were more likely to receive state benefits such as income support, housing benefit, and council tax benefit. Differences were strongest between literacy groups. Men and women with Entry Level 2 literacy or numeracy were less likely, or less able, to make regular savings from their income, and far less likely to have any investments. They were also three times more likely to have borrowed money from a pawnbroker,
moneylender, friends or family members. Almost a quarter of men (22 per cent) and 30 per cent of women with Entry Level 2 literacy were part of a non-working household compared with just 4 per cent of men and 6 per cent of women with Level 2 literacy.
Health and wellbeing
Relatively poor physical health and mental wellbeing were associated with poor basic skills. Poor skills were also related to poor health-related practices. While fewer than one in five men and women with Level 2 skills reported that they did not exercise, this increased to just over one in three men with Entry Level 2 literacy and just under one in three with Entry Level 2 numeracy. Women with Entry Level 2 literacy or numeracy were more than twice as likely as women with Level 2 skills to smoke every day – 42 per cent compared with 19 per cent. Similar, but less pronounced, differences were apparent between men. Men and women with Entry Level skills were also more than twice as likely to report being in ‘very poor’ or ‘poor’ health in comparison with men and women with Level 2 skills.
A far higher proportion of the men and women with Entry Level 2 literacy or numeracy reported four or more symptoms of depression out of a
maximum of nine from the Malaise scale (Rutter, 1970)3
, the largest proportion being one in three women with Entry Level 2 literacy. Compared with those
Women with Entry Level 2 literacy or numeracy were more than twice as likely as women with Level 2 skills to smoke every day – 42 per cent compared with 19 per cent
WHO HAS POOR SKILLS?
with Level 2 skills, Entry Level 2 men and women were more than twice as likely to feel that they ‘never got what they wanted from life’ and up to four times as many felt that ‘whatever they did had no effect on what happened to them’. Differences were most marked among skills groups for men.
Community and social participation Community participation, measured across activities such as involvement in some sort of community, charitable, interest or activity club or group, voting, and/or interest in politics, was lowest among men and women with the poorest grasp of literacy or numeracy.
Differences between groups were once again most pronounced for literacy.
Men and women with Entry Level 2 literacy and this time Entry Level 3 numeracy were at least twice as likely as those with Level 2 literacy or numeracy skills to be ‘not at all’ interested in politics. Men and women with Entry Level 2 or 3 literacy were nearly twice as likely never to have signed a petition as those at Level 2.
Conclusion
These findings show the kinds of disadvantage
that are associated with basic skills difficulties.
The Entry Level 2 group appeared exceptionally
disadvantaged. This group had rarely had any
exposure to basic literacy or numeracy courses
and therefore present a major challenge for the
Skills for Life strategy.
Men and women with the poorest grasp of literacy or numeracy were least likely to vote
Phot
os: iSt
whose skills change
over time?
To answer this question, we compared the results of the 10 per cent of the BCS70 cohort (1,627 adults) who had their literacy and numeracy skills assessed in 1991 with the results for the entire cohort in 2004 (9,529 for literacy and 9,484 for numeracy). We then focused in particular on those who had their skills assessed in both 1991 and 2004 (1,189 for literacy and 1,185 for numeracy). We classified these into four groups:
■Poor non-movers: poor at 21, poor at 34 (poor skills remained poor)
■Improvers: poor at 21, good at 34 (poor skills improved)
■Deteriorators: good at 21, poor at 34 (good skills deteriorated)
■Good non-movers: good at 21, good at 34 (good skills remained good).
The distribution of cohort members across these four groups is given in Table 2. This shows that one in five cohort members (10 per cent + 10 per cent) had changed literacy skills and one in three (24 per cent + 12 per cent) had changed numeracy skills between age 21 and 34.
What are the consequences of improvement and deterioration? The most interesting comparisons are between the experiences and attributes of the cohort members whose skills improved or deteriorated and those of the non-movers.
WHAT HAPPENS TO ADULTS WHOSE SKILLS CHANGE OVER TIME?
of improvement and the consequences of deterioration. This includes the possible role of changes in basic skills in processes of social exclusion and inclusion.
Improvers: Men
Work and family economic status Compared with men who had a poor grasp of literacy or numeracy at both 21 and 34 (poor non-movers), men who had improved their literacy or numeracy by age 34 were:
■more likely to own their home (78 per cent to 40 per cent – literacy)
■less likely to have borrowed money from a friend, family member, pawnbroker or other source (20 per cent to 39 per cent – literacy)
■less likely to be living on state benefits or to be part of a non-working
household (6 per cent to 19 per cent – literacy)
■more likely to be in full-time employment (94 per cent to 81 per cent - literacy).
Family life and civic participation Literacy improvers were:
■more likely than non-movers to be married at age 34 or to be currently cohabiting, and/or to have had children (36 per cent improvers were living alone with no children compared with 65 per cent non-movers – literacy)
■more likely than non-movers to have had some contact with a government or other official (16 per cent to 0 per cent – literacy)
[image:17.496.109.462.161.229.2]■less likely to say that they were ‘not at all’ interested in politics (15 per cent to 28 per cent – literacy).
Table 2: Distribution of cohort members by good and poor skills at age 21 and 34
LITERACY
NUMERACY
Poor at 34 Good at 34 Poor at 34 Good at 34
% % % %
Poor at 21 6 10 19 24
Good at 21 10 74 12 45
Literacy improvers were more likely than non-movers to be married at age 34 or to be currently cohabiting
Phot
o: St
ock
Health and wellbeing
There were no differences in reported smoking, poor health or long-term health problems. However, fewer improvers reported that ‘whatever I do has no effect on what happens to me’ (2 per cent to 13 per cent – literacy). Men with improved skills at age 34 were also less likely to report that ‘I never really get what I want out of life’ (23 per cent to 34 per cent – numeracy).
Improvers: Women
Work and family economic status Much the same picture was found for women, with improvement in literacy and numeracy again appearing to be
associated with positive statuses at age 34. Although the improvers were no more likely than the non-movers to own their own homes they were:
■more likely to be generally better off;
■more likely to have savings and investments (37 per cent to 18 per cent – numeracy)
■less likely to receive state benefits -housing benefit (6 per cent to 15 per cent - numeracy)
■more likely to be in a full-time job at 34 (43 per cent to 27 per cent - numeracy);
■far less likely to lack formal
qualifications (3 per cent to 20 per cent – numeracy, 11 per cent to 30 per cent – literacy)
■more likely to have used a computer at work (73 per cent to 42 per cent – literacy, 80 per cent to 61 per cent – numeracy).
Family life and civic participation Improvers were:
■less likely than non-movers to have never married (23 per cent to 44 per cent - literacy)
■more likely to have signed a petition or been on a rally or demonstration (31 per cent to 17 per cent – numeracy)
■more likely to be involved in social or community organisations (55 per cent to 41 per cent – numeracy).
Health and wellbeing
There were no statistically significant differences between the improvers and the others in relation to smoking. However, the improvers were:
■less likely to have symptoms
associated with depression (17 per cent to 34 per cent – literacy);
■less likely to report that they ‘never’ exercised (14 per cent to 31 per cent – numeracy); and
■less likely to report that they had poor health or long-term health problems (25 per cent to 38 per cent – literacy).
Women with improved numeracy were less likely to report that they ‘never’
exercised
Phot
o: John Bir
WHAT HAPPENS TO ADULTS WHOSE SKILLS CHANGE OVER TIME?
Conclusion
These results point to powerful relationships
between basic skills movements and other
variables. However, we do not know whether the
basic skills change lies behind the experience or
status at age 34 or whether the status change
lies behind the basic skills change. It does
appear that skills enhancement may have the
potential to open up opportunities and improve
self-confidence, while deterioration of literacy
skills among women is associated with the
opposite effect. This is in line with the Skills for
Life strategy of skills enhancement to support
economic wellbeing and social inclusion.
Deteriorators
There were fewer differences in outcomes at age 34 between the ‘deteriorators’ and the ‘non-mover’ group, particularly among the men.
Men
Compared with the good non-movers, the deteriorators were:
■more likely to have no formal
qualifications (17 per cent to 6 per cent – literacy)
■less likely to have been using a PC at work (58 per cent to 77 per cent – literacy)
■more likely to be a parent with three or more children (11 per cent to 4 per cent).
Women
For women there were more negative associations. They were:
■more likely to live in rented
accommodation (25 per cent to 14 per cent – literacy)
■less likely to have savings or
investments (15 per cent to 42 per cent – literacy)
■less likely to be in full-time work (27 per cent to 47 per cent – literacy; 35 per cent to 50 per cent – numeracy);
■if in work, less likely to have received work-related training (6 per cent to 23 per cent – literacy)
■more likely to be single parents (25 per cent to 11 per cent – literacy).
Women who suffered a decline in iteracy skills between 21 and 34 were more likely to live in rented accommodation
Phot
o: Andr
e
w
relate to problems with
literacy and numeracy?
The final part of the adult assessment was to measure the prevalence of some of the symptoms associated with dyslexia. The word 'dyslexia' is Greek in origin and means 'difficulty with words'. Though the precise origins and meaning of the syndrome have attracted
controversy, it is generally believed that dyslexia arises from a variation in the brain area that processes language-based information and affects the underlying skills that are needed for learning to read, write and spell. It is estimated that about 4 per cent of the population is severely dyslexic, with a further 6 per cent having mild to moderate problems. In 1980, when BCS70 cohort members were aged 10, between 2 and 4 per cent were dyslexic to some degree.
Having the opportunity to assess the BCS70 cohort members in 2004 meant that we could:
■estimate the level of dyslexic symptoms in a representative adult population of 34-year-olds
■compare the past experiences and adult outcomes for dyslexic adults with those of their non-dyslexic peers
■analyse the relationship between dyslexia, literacy and numeracy
HOW DOES DYSLEXIA RELATE TO PROBLEMS WITH LITERACY AND NUMERACY?
The Dyslexia Adult Screening Test For the 2004 survey, we used four of the 11 tests in the Dyslexia Adult Screening Test (DAST)4:
■1-minute Reading
■2-minute Spelling (revised to 1-minute)
■Spoonerisms
■Nonsense Passage Reading
The Reading exercise comprised a list of 120 words, graded in difficulty, which the respondents had to read aloud as fast and as accurately as they could in one minute. The exercise distinguished between those who completed the exercise without difficulty and the substantial minority who struggled – 16 per cent read no more than 80 words.
For the Spelling exercise, respondents had to spell 16 words, with four additional easier words for those who struggled at the start, making a maximum of 20 words to spell correctly in one minute. Just over 50 per cent got at least 17 right and 5 per cent scored between 1 and 10 correctly.
Spoonerisms can be used as a measure of the ability to split words into their constituent sounds (‘phonemic
segmentation’) and are a sensitive index of skills associated with dyslexia. In our test, the interviewer read out two words and respondents had to swap over the sounds at the beginning of each word. ‘…so if I say ‘Car Park’ you would say
‘Par Cark’, and so on…’. The
spoonerisms used in the exercise were the names of three famous people. Just over 60 per cent of cohort members got all three right, but as many as 12 per cent could not manage any of the three.
The Nonsense Passage Reading exercise is based on the fact that dyslexic adults find it especially difficult to read words that they have never seen before. In this exercise, respondents were given three minutes to read a passage of text containing ‘made up’ or ‘nonsense’ words. There was a maximum score of 99, based on a combination of speed and accuracy. While 39 per cent scored at or near the maximum, about 12 per cent of respondents scored 60 or less.
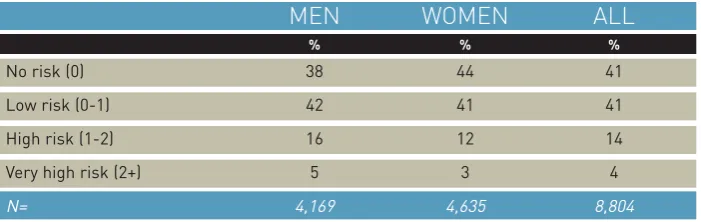
The ‘at risk quotient’ score for BCS70 To identify those who were most ‘at risk’ of dyslexia, ‘At Risk Quotient’ (ARQ) scores were calculated. Scores of 0, 1, 2 or 3 were assigned to performance in each of the four exercises. For example, cohort members who scored ‘0’ in the Spoonerism exercise (they could not swap over the sounds at the beginning of the words in any of the three examples) had a ‘very high risk’ of being dyslexic and were awarded three points. The total score for the four exercises was then divided by four to obtain the ARQ for each cohort member. We then put these scores into four groups, as shown in Table 3.
Respondents had to swap over the sounds at the beginning of each word. ‘…so if I say ‘Car Park’ you would say ‘Par Cark’, and so on…
How is ‘risk of dyslexia’ linked to lifestyle at age 34?
Literacy and numeracy
Our first statistical calculations showed, unsurprisingly, that a high score in the literacy and numeracy assessments was associated with a low ARQ score, ie, less risk of dyslexia.
However, whereas less than 1 per cent of men and women with ‘no risk’ of dyslexia (ARQ = 0) had Entry Level 2 literacy, 28 per cent of men and 33 per cent of women with a ‘very high risk’ of dyslexia (an ARQ of 2+) had Entry Level 2 literacy. Conversely, nearly three-quarters of those with ‘no risk’ of dyslexia had Level 2 literacy, compared with one-fifth of men and one-sixth of women of women with a ‘very high risk’ of dyslexia.
Similarly for numeracy, 4 per cent of men and 9 per cent of women with ‘no risk’ of dyslexia were at Entry Level 2, whereas this increased to 36 per cent of
men and 56 per cent of women among those with a ‘very high risk’ of dyslexia.
Self-awareness of literacy and numeracy difficulties
Reading
Among those with a ‘very high risk’ of dyslexia:
■one in three women and one in two men reported that they never read books
■34 per cent of men and 27 per cent of women reported difficulties with reading, compared with 3 per cent of men and 2 per cent of women with ‘no risk’ of dyslexia
[image:22.496.34.385.160.271.2]■22 per cent of men and 17 per cent of women wanted to improve their reading skills but only 4 per cent of them had been on a course to help tackle these difficulties.
Table 3: Distribution of dyslexia risk (ARQ) among the BCS70 cohort
MEN
WOMEN
ALL
% % %
No risk (0) 38 44 41
Low risk (0-1) 42 41 41
High risk (1-2) 16 12 14
Very high risk (2+) 5 3 4
N= 4,169 4,635 8,804
HOW DOES DYSLEXIA RELATE TO PROBLEMS WITH LITERACY AND NUMERACY?
Writing
Among those with a ‘very high risk’ of dyslexia:
■three in four men and two in three women reported difficulties with writing
■18 per cent of men reported that their poor handwriting was a problem
■34 per cent of men and 31 per cent of women said they would like to improve their writing but only 5 per cent of men and 4 per cent of women had been on a course to help them do so.
Number
Not surprisingly, there was a weaker link between risk of dyslexia and self-reported difficulties with numbers and mathematical calculations.
■19 per cent of men and 29 per cent of women with a ‘very high risk’ of dyslexia reported difficulties with numbers, compared with 5 per cent of men and 8 per cent of women with no risk of dyslexia
■17 per cent of men and 20 per cent of women with a ‘very high risk’ of dyslexia said that they would like to improve their numerical skills, compared with 6 per cent of men and 11 per cent of women without risk
Qualifications
■32 per cent of men and 37 per cent of women with a very high risk of dyslexia had no formal qualifications,
compared with 16 per cent of men and 17 per cent of women classified with a ‘high risk’, 7 per cent of men and 6 per cent of women with ‘low risk’, and 3 per cent of men and 4 per cent of women with ‘no risk’
Eighteen per cent of men with a ‘very high risk’ of dyslexia reported that their poor handwriting was a problem
Phot
o: iSt
Other outcomes at age 34
For both men and women a ‘very high risk’ of dyslexia had a statistically significant negative association with employment, qualifications and
employment-related training. There was also a negative relationship with statuses such as social participation, health and wellbeing. Even a ‘risk’ (as opposed to a ‘very high’ or ‘high’ risk) of dyslexia has a negative association with these statuses for both men and women. Further analysis enabled us to isolate the possible effect of poor literacy and numeracy from that of dyslexia risk on a number of other variables. Once poor literacy and numeracy was taken into account, the association between dyslexia and these outcomes was much reduced. ‘Risk of dyslexia’ did, however, maintain an independent association over and above literacy and numeracy in some important areas of adult life. For both men and women these were:
■attaining qualifications
■being in employment that requires the use of a computer
■social and political engagement; and
■dissatisfaction, or feeling ‘I never seem to get what I want out of life’.
Conclusion
Adults with poor basic skills who also have the
difficulties identified with dyslexia are subject to
even greater social isolation and exclusion in
some areas of their life.
From generation
to generation
As part of the BCS70 2004 survey, we wanted to investigate the relationship between the literacy and numeracy scores of parents and the cognitive skills of their children. Is there any transfer of advantage or disadvantage between the generations?
Out of a representative 1 in 2 sample of all cohort members, 2,846 members provided information on 5,207 of their children between age 0 and 16 years 11 months. The children’s average (mean) age was 6 years 4 months. Three-quarters of these children were aged 3 and above and were eligible for assessment.
Child assessments
For children aged between 3 and 5 years 11 months (1,359) the assessments were taken from the British Ability Scales (BAS) Early Years Battery and for children
aged 6 to 16 years 11 months (2,522) from the BAS School Years Battery. Scores from these tests have been standardised on large populations to establish 'age-equivalent' scores. The results from the BCS70 (2004) survey can therefore be benchmarked against these 'age-equivalent' norms.
However, it is important to note that as all cohort members (parents) were aged 34 in 2004, the older children in our sample are a product of young
parenthood, and young parents are more likely to have less education and
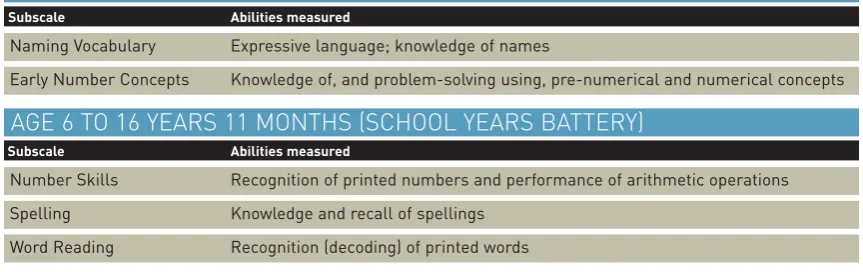
Table 4 shows the tests (or subscales) that we used, together with the abilities that they measure.
Early Years
The ‘Naming Vocabulary’ and ‘Early Number Concepts’ assessments were completed by all 1,359 children aged between 3 and 5 years 11 months. Raw scores were converted to an age-based ‘ability score’ so that the children’s performance could be compared with BAS age-equivalent scores.
Naming Vocabulary
■For this exercise, the child was shown a series of pictures and asked to say what it was, for example, a picture of a shoe, chair or pair of scissors. There were 36 pictures in total, but the number of items a child answered depended on his / her performance. There were different starting and
stopping points depending on age and performance but, on the whole, the better the children did, the more items they were given.
Early Number Concepts
In this exercise, the child was again shown a series of pictures and answered questions about number, size and other numerical concepts. The youngest children also used ten green plastic tiles for counting. There were 30 questions in total, but no standard number of items for a child to try to answer. As for Naming Vocabulary, there were different starting and stopping points depending on age and performance.
School Age
[image:26.496.32.464.171.307.2]The Number Skills, Spelling, and Word Reading assessments from the BAS II School Years Battery were completed by 2,248 of the 2,522 children aged 6 to 16 Table 4: British Ability Scales
AGE 3 TO 5 YEARS 11 MONTHS (EARLY YEARS BATTERY)
Subscale Abilities measured
Naming Vocabulary Expressive language; knowledge of names
Early Number Concepts Knowledge of, and problem-solving using, pre-numerical and numerical concepts
AGE 6 TO 16 YEARS 11 MONTHS (SCHOOL YEARS BATTERY)
Subscale Abilities measured
Number Skills Recognition of printed numbers and performance of arithmetic operations
Spelling Knowledge and recall of spellings
FROM GENERATION TO GENERATION
years 11 months, with lower participation rates in the older age groups. Some of these tests had to be updated to ensure they were relevant to the contemporary world. Again, the ‘ability score’ enabled comparison with the BAS
age-equivalents.
Number Skills
In this exercise, the child performed various number-based tasks, such as pointing to numbers presented orally, naming numbers presented visually, and performing written calculations. There were 46 items in total, arranged in six sections. As with the other scales, the number of sections a child attempted depended on the child’s performance in the previous section.
Spelling
In a modified version of the original BAS II assessment, all the children in a defined age-band were asked to spell a fixed number of words. The interviewer read the word, then a sentence with the word in it (slightly stressing the target word), and then the word alone for a second time. For example:
“Was…[pause]…It was my birthday on Saturday…[pause]…Was”.
Word Reading
In this exercise, the child read aloud a number of words presented on a card. The child had to pronounce words correctly according to locally accepted standards, with emphasis on the correct
syllable or syllables. There were 90 words on the card, and, on the whole, the better the child did, the more words they read. The words ranged in difficulty from such words as ‘up’, ‘he’, and ‘you’, to
‘mnemonic’ and ‘facetious’.
Parents and children
Parents’ performance in the literacy and numeracy assessments correlated with their children’s performance in the cognitive assessments. All the
correlations are relatively weak, but they are statistically significant and confirm that there is a relationship between poor basic skills performance by parents and poor test performance by their children.
The special significance of Entry Level 2 Closer analysis of the data revealed that the relationship between parents’ literacy and numeracy scores and children’s BAS scores was substantially stronger at Entry Level 2 (and to a certain extent Entry Level 3) than at higher levels. In other words, the correlation between parents and children was most apparent at the lowest parental literacy and numeracy levels. This statistically significant result was sustained even when parents’ highest qualification was taken into account.
For children aged 3 to 5 years 11 months:
Conclusion
Much more penetrating analysis will be needed
to understand fully the nature of the
intergenerational transfers involved. But these
results point to parents’ literacy and numeracy
as key components of influence on children’s
educational achievements, particularly at the
lowest parental literacy and numeracy levels.
The fact that the intergenerational relationship
between the performance of children and
parents at Entry Level 2 literacy or numeracy,
and to a lesser extent Entry Level 3 literacy, was
sustained even when parents’ highest
qualification was taken into account was
particularly striking.
assessment as were children of parents with Level 2 literacy
■Where parents were at Entry Level 2 for numeracy, their children were more than twice as likely as were children of parents with Level 2 numeracy of being in the bottom 20 per cent in the Early Number Concepts assessment
■Where parents were at Entry Level 3 for literacy, their children were about twice as likely to perform poorly in the Naming Vocabulary and Early Number Concepts assessments as were children of parents with Level 2 literacy.
For children aged 6 to 16 years 11 months
■Where parents were at Entry Level 2 for literacy, their children were more than two-and-a-half times as likely as were children of parents with Level 2 literacy to perform poorly in the Reading assessment. The children were also more than 1.7 times as likely to be in the bottom 20 per cent in the Spelling and Number Skills assessments
■Where parents were at Entry Level 3 literacy, their children were about twice as likely as were children of parents with Level 2 literacy to perform poorly in the Word Reading assessments
■Where parents were at Entry Level 2 numeracy, their children were twice as likely to perform poorly in the Number Skills assessment and more than 1.7 times as likely to perform poorly in the Reading and Spelling assessments as were children of parents with Level 2 numeracy.
Where parents were at Entry Level 3 literacy, their children were about twice as likely as children of parents with Level 2 literacy to perform poorly in the Word Reading assessments
Phot
o: St
What does this
mean for policy
and research?
The findings from this research have some powerful messages for Skills for Life policy and throw up numerous questions for further research.
Adults’ self-awareness of difficulties The rate of self-reported literacy, numeracy and writing problems among cohort members has remained
remarkably constant at about 5 per cent since such questions were first asked of NCDS cohort members in 1981. In the BCS70 survey in 2004 a different question format resulted in a somewhat higher figure. However, there was still a marked gap between the self-reported figures and what the objective tests revealed,
From the policy perspective, it is particularly notable that those who acknowledged skills problems were far more likely to express the desire to improve their skills than those who did
not. Among those who were classified objectively, the relationship between having a problem and wanting to improve was very much weaker. The challenge for policy-makers is therefore to find ways of raising awareness of the skills problem and the need for improvement. Without such awareness, meeting Skills for Life targets for take-up of courses is likely to remain difficult, if not impossible, to achieve.
The challenge for researchers is to use the data to analyse in much more detail the factors that trigger the
The challenge of Entry Level 2
In this research, the literacy test assessed 4 per cent of the cohort at Entry Level 2 and 4 per cent at Entry Level 3; the numeracy test assessed 15 per cent at Entry Level 2 and 25 per cent at Entry Level 3 – marginally below the levels established through the Skills for Life baseline survey.
Major economic disadvantage, poor psychological wellbeing, and lack of civic participation were concentrated among those with Entry Level 2 or below skills. This points to a syndrome of attributes identified with social exclusion that includes poor basic skills.
It also suggests that policy-makers should focus their attention on the Entry Level groups, especially those at Entry Level 2 or below. This should not only involve encouraging participation in courses but acknowledging the highly disadvantaged contexts in which many of these adults live.
Research should include case studies of cohort members at Entry Level 2. It should also model the role of literacy and numeracy problems to identify more precisely the strength of their independent effects on those who could be classified as ‘socially excluded’ at age 34. A further extension will be to use the new basic skills data, and the data collected earlier in the cohort members’ lives, to forecast the likely impact of Skills for Life and the literacy and numeracy strategy in schools.
Continuities and discontinuities As described earlier, we were able to construct a fourfold typology in which ‘improvers’, and ‘deteriorators’ could be set against ‘non-movers’ (those with no change in their level of skill). We showed that there are substantial relationships between ‘movement’, socio-economic statuses, and other personal attributes and statuses at age 34. It is likely that there are virtuous (and vicious) circles in process, in which literacy or numeracy enhancement (or loss) may play a crucial part.
For policy the message is clear: understanding the socio-economic and relational context in which learners are located, and how it is changing, is crucial to understanding how best to meet their learning needs.
Future research will use the full range of longitudinal information – including learning experience and occupational, partnership and family formation histories going back to age 16 – to tease out the main direction and strength of effects. In addition, qualitative case studies of cohort members in the ‘mover’ groups should be undertaken, to throw more light on the role of literacy and numeracy in any accompanying life-course changes.
Major economic disadvantage, poor
psychological wellbeing, and lack of civic participation were
WHAT DOES THIS MEAN FOR POLICY AND RESEARCH?
Is dyslexia an added problem? Our research identified a massive concentration of dyslexia risk at Entry Level 2, though many adults showing symptoms associated with dyslexia are apparently able to overcome their difficulties and gain the skills they need for high achievement. More detailed analysis revealed a degree of independence of dyslexia from poor literacy and numeracy skills.
For policy, these results point to a separate learning difficulties component in literacy and numeracy test
performance. This needs to be taken into account in the design of educational provision and the pedagogical approaches to learners at every level. This is particularly necessary for those at Entry Level 2 or below. Tutors need to be aware that such difficulties may lie behind a learner’s poor acquisition of literacy and numeracy skills, rather than the more recognisable social and health factors that typically lead to falling behind at school. This could include routine screening for dyslexia, using tests such as DAST, when preparing adult learners for literacy and numeracy courses.
The research programme that follows from this is threefold.
■First, longitudinal analysis to investigate the continuities and discontinuities in dyslexia risk from the ages of 10 to 34 and to model the influences that affect it
■Second, attempt to unpack, both quantitatively and qualitatively, the life histories of dyslexic individuals with a particular focus on how those who have been successful in adult life overcame their difficulties
■Third, investigate the somewhat puzzling finding of high levels of dyslexia risk among those, especially women, at the lowest numeracy levels.
Intergenerational transfer
The data clearly suggest that children in families with parents at Entry Level 2 literacy and numeracy are quite seriously disadvantaged and likely to fall behind their peers whatever the level of their parents’ qualifications.
The policy implication of this finding is that the Government should continue supporting initiatives for young children and parents such as Sure Start and the various provisions advocated in Every Child Matters, such as family learning. The finding also suggests that strong literacy and numeracy provision should be maintained throughout the school career – and that education for parents
with poor literacy and numeracy is critical to the success of initiatives targeted at children.
A possible line of research will be to uncover the mediating factors in skill transmission from parents to children, where it exists. These might include pre-school parent-child activities, as well as parents’ engagement with their children’s education at school, and their own participation in adult learning.
The main messages
It is clear from the BCS70 (2004) work completed so far that Entry Level performance limits, for a substantial minority of people, full participation in mainstream adult life. Their literacy and numeracy difficulties also disadvantage their children.
The major policy and research challenge for Skills for Life is to find the means of motivating these adults to improve their skills and to develop curricula that will best match their needs. ■
The research suggests that the Government should continue
supporting initiatives for young children and
parents such as Sure Start
Phot
Appendix
Table A1 Aspects covered by the adult literacy curriculum
ADULT LITERACY
CURRICULUM
Speaking and Listening: Listen and respond
Entry Level 2 Listen and respondto spoken language, including straightforward information, short narratives,
explanations and instructions
Entry Level 3 Listen and respondto spoken language, including straightforward information and narratives, and
follow straightforward explanations and instructions, both face-to-face and on the telephone
Level 1 Listen and respondto spoken language, including information and narratives, and follow explanations
and instructions of varying lengths, adapting response to speaker, medium and context
Level 2 Listen and respondto spoken language, including extended information and narratives, and follow
detailed explanations and multi-step instructions of varying length, adapting response to speaker, medium and context
Speaking and Listening: Speak to communicate
Entry Level 2 Speak to communicateinformation, feelings and opinions on familiar topics
Entry Level 3 Speak to communicateinformation, feelings and opinions on familiar topics, using appropriate
formality, both face-to-face and on the telephone
Level 1 Speak to communicateinformation, ideas and opinions, adapting speech and content to take account of
the listener(s) and medium
Level 2 Speak to communicatestraightforward and detailed information, ideas and opinions clearly, adapting
speech and content to take account of the listener(s), medium, purpose and situation
Speaking and Listening: Engage in discussion
Entry Level 2 Engage in discussionwith one or more people in a familiar situation to establish shared understanding
about familiar topics
Entry Level 3 Engage in discussionwith one or more people in a familiar situation, making relevant points and
responding to what others say to reach a shared understanding about familiar topics
Level 1 Engage in discussionwith one or more people in familiar and unfamiliar situations, making clear and
relevant contributions that respond to what others say and produce a shared understanding about different topics
Level 2 Engage in discussionwith one or more people in a variety of different situations, making clear and
effective contributions that produce outcomes appropriate to purpose and topic
Reading: Read and understand
Entry Level 2 Read and understandshort, straightforward texts on familiar topics
Entry Level 3 Read and understandshort, straightforward texts on familiar topics accurately and independently
Level 1 Read and understandstraightforward texts of varying length on a variety of topics accurately and
independently
Level 2 Read and understanda range of texts of varying complexity accurately and independently
Reading: Read and obtain information
Entry Level 2 Read and obtain informationfrom short documents, familiar sources and signs and symbols
Entry Level 3 Read and obtain information from everyday sources
Level 1 Read and obtain informationfrom different sources
Level 2 Read and obtain information of varying length and detail from different sources
Writing: Write to communicate
Entry Level 2 Write to communicateinformation with some awareness of the intended audience
Entry Level 3 Write to communicateinformation and opinions with some adaptation to the intended audience
Level 1 Write to communicateinformation, ideas and opinions clearly using length, format and style
appropriate to purpose and audience
Level 2 Write to communicateinformation, ideas and opinions clearly and effectively, using length, format and
Table A2 Aspects covered by the adult numeracy curriculum
ADULT NUMERACY
CURRICULUM
Understanding and using mathematical information: Read and understand
Entry Level 2 Read and understandinformation given by numbers, symbols, simple diagrams and charts
in graphical, numerical and written material
Entry Level 3 Read and understandinformation given by numbers, symbols, diagrams and charts used for different
purposes and in different ways in graphical, numerical and written material
Level 1 Read and understandstraightforward mathematical information used for different purposes and
independently select relevant information from given graphical, numerical and written material
Level 2 Read and understandmathematical information used for different purposes and independently select
and compare relevant information from a variety of graphical, numerical and written material
Understanding and using mathematical information: Specify and describe
Entry Level 2 Specify and describea practical problem or task using numbers, measures and simple shapes
to record essential information
Entry Level 3 Specify and describea practical problem or task using numbers, measures and diagrams to
collect and record relevant information
Level 1 Specify and describea practical activity, problem or task using mathematical information and language
to make accurate observations and identify suitable calculations to achieve an appropriate outcome
Level 2 Specify and describea practical activity, problem or task using mathematical information and language
to increase understanding and select appropriate methods for carrying through a substantial activity
Calculating and manipulating mathematical information: Generate results
Entry Level 2 Generate resultsto a given level of accuracy using given methods and given checking procedures
appropriate to the specified purpose
Entry Level 3 Generate resultsto a given level of accuracy using given methods, measures and checking procedures
appropriate to the specified purpose
Level 1 Generate resultsto a given level of accuracy using methods, measures and checking procedures
appropriate to the specified purpose
Level 2 Generate resultsto an appropriate level of accuracy using methods, measures and checking
procedures appropriate to the specified purpose
Interpreting results and communicating mathematical information: Present and explain results
Entry Level 2 Present and explain resultsthat meet the intended purpose using appropriate numbers, simple
diagrams and symbols
Entry Level 3 Present and explain resultsthat meet the intended purpose using appropriate numbers, diagrams,
charts and symbols
Level 1 Present and explain resultsthat meet the intended purpose using an appropriate format to a given
level of accuracy
Level 2 Present and explain resultsclearly and accurately using numerical, graphical and written formats
NEW LIGHT ON LITERACY AND NUMERACY
JOHN BYNNER AND SAMANTHA PARSONS
NRDC
Institute of Education University of London 20 Bedford Way London WC1H 0AL
Telephone: +44 (0)20 7612 6476 Fax: +44 (0)20 7612 6671
email: info@nrdc.org.uk
website: www.nrdc.org.uk
NRDC is a consortium of partners led by the Institute of Education, University of London with: • Lancaster University • The University of Nottingham • The University of Sheffield • East London Pathfinder • Liverpool Lifelong Learning
Partnership
• Basic Skills Agency • Learning and Skills
Network
• LLU+, London South Bank University • National Institute of
Adult Continuing Education • King’s College London • University of Leeds
Funded by the Department for Education and Skills as part of Skills for Life: the national strategy for improving adult literacy and numeracy skills.