A report to the DfES by Bruce Hayward, Carys Alty, Stephen Pearson and Chris Martin, NFO System Three Social Research
Findings from a survey conducted in Autumn 2002
This research on which this report is based was managed by the British Educational Communications and Technology Agency (Becta) on behalf of the Department for Education and Skills (DfES), and conducted by:
Bridget Somekh and Derek Woodrow (Manchester Metropolitan University); Sally Barnes, Pat Triggs and Rosamund Sutherland (University of Bristol); Don Passey and Hilary Holt (University of Lancaster); Colin Harrison, Tony Fisher, Andy Flett and Gordon Joyes (University of Nottingham).
It is the final report from the Pathfinders Evaluation. The Preliminary Report1 and the Second Report2are available on the Becta Research web site at:
www.becta.org.uk/research/reports/pathfinders
A series of Information Sheets based around issues relating to the study are forthcoming and will be published on the Becta Research web site, where other reports in the ICT in Schools Research and Evaluation Series can also be found.
1
Becta (2001). NGfL Pathfinders: Preliminary Report on the roll out of the NGfL Programme in ten Pathfinders LEAs.
(Becta, Coventry: www.becta.org.uk/research/reports/pathfinders)
2
Becta (2001).NGfL Pathfinders: Second Report on the roll out of the NGfL Programme in ten Pathfinders LEAs.
1
1 Executive summary 2
Introduction Findings
1.1 Access to ICT at home 1.2 Young people’s use of computers 1.3 Young people’s use of the Internet 1.4 Use of computers for schoolwork
1.5 Attitudes towards computers and the Internet 1.6 Early years and ICT
2 Introduction 4
2.1 Background 2.2 Survey objectives
3 Survey method 5
4 Young people’s use of computers and the Internet – An overview 7
4.1 Computer use
4.2 Use of computers other than at home or at school 4.3 Time spent using computers
4.4 Use of the Internet
4.5 Use of the Internet other than at home or at school 4.6 Young people’s aptitude in using computers
5 ICT in the home 10
5.1 Household access to ICT 5.2 Household access to computers 5.3 Computers in the home 5.4 Internet access at home 5.5 Mode of access to the Internet 5.6 Young people’s use of ICT in the home 5.7 Young people and computers in the home 5.8 Barriers to computer use at home
6 Facing challenges at LEA level: what has been learnt 19
6.1 Young people’s use of computers in schools 6.2 Circumstances in which computers are used in school 6.3 Computer activities at school
6.4 Software packages used at school 6.5 Use of ICT by teachers
6.6 Use of ICT by subject
6.7 Barriers to use of computers at school
7 Young people and the Internet 26
7.1 Frequency of using the Internet 7.2 Reasons for using the Internet 7.3 Internet safety
8 Home-school links 29
8.1 Awareness and use of school web sites 8.2 On-line communication with teachers and parents 8.3 ICT support provided by schools and colleges
8.4 Purchasing and hiring of ICT equipment to help with child’s school/college work
9 Attitudes towards the role of computers in learning and child development 31
9.1 Attitudes of parents
9.2 Attitudes of children in Key Stages 1 and 2 9.3 Attitudes of children in Key Stage 3 and above
10 Early years and ICT 36
10.1 Household ownership of ICT
10.2 Access to computers and the Internet at home 10.3 Children’s use of computers in the home 10.4 Ownership and use of electronic toys 10.5 Parents’ purchasing of educational software 10.6 Children’s use of ICT in early years settings 10.7 Parents’ attitudes towards ICT
Technical appendix 40
Acknowledgements 43
1 Executive summary
Introduction
In July 2002 the Department for Education and Skills (DfES) commissioned NFO System Three to undertake the second Young People and ICT survey, which updates the baseline Young People and ICT survey conducted in autumn 2001. The survey explored the attitudes and experiences of young people aged 5-18 and their parents, in relation to the use of information and
communications technology (ICT) at home and at school. Parents of 3-4-year-olds were also interviewed. The research was undertaken in England during September and October 2002.
Findings
The main findings reported in this summary are based on 5-18-year-olds and their parents. Findings relating to parents of 3-4-year-olds are reported in a separate section at the end of the summary.
1.1 Access to ICT at home
Household access to most forms of ICT equipment has increased since 2001. The proportions of households that owned ICT equipment were:
• mobile phone 92% • games console 77% • DVD player 43%
• Interactive digital TV 33% • Digital camera 23% • WAP/3G phone 21% • Palmtop computer 5%
81% of households had access to a personal or laptop computer in the home, compared with 78% in 2001. There was a strong relationship between access to ICT in the home and social grade of the household’s chief income earner, with ownership levels higher for a majority of items among those in higher social grades. Parents aged 35+ in social class AB were the group most likely to have a computer at home (96%). Those aged under 35, in social class DE and with no educational
qualifications, were the least likely (33% overall). Access to a home computer increased with key stage, with 68% of those in Key Stage 1 having a computer, rising to 87% of those in Key Stage 4 and post-16s.
68% of households had access to the Internet at home, compared with 64% in 2001.
Like access to a computer, Internet access at home increased in line with social grade, educational qualifications of the parents and key stage, rising from 56% of those in Key Stage 1 to 76% of post-16s. 92% of AB households, compared with 78% of C1, 64% of C2 and 43% of DE households, had access to the Internet. 82% of households with Internet access at home accessed the Internet via a telephone line using a modem, although the proportion using ADSL/broadband increased from 6% in 2001 to 10% in 2002.
Financial barriers, mentioned by 63% of respondents, remained the overriding factor that prevented parents who did not have a computer at home from buying one. Presence of a computer at home, and in particular, a computer that had Internet access, enhanced a child’s perception of their computing skills.
1.2 Young people’s use of computers
98% of young people aged 5-18 used computers at home, at school or elsewhere, and there is no evidence of change in patterns of use since 2001.
92% of children used computers at school and 75% used them at home. 49% of young people used computers in a location other than at home or at school.
22% of 5-18-year-olds used computers at school but not at home.
On average, young people in Key Stage 3 and above spent around 10 hours using computers in the week prior to the survey. Of these, 6 hours were spent using computers at home, 3 hours using them at school and 1 hour using them elsewhere. About a third of the time was accounted for by games playing.
1.3 Young people’s use of the Internet
84% of young people used the Internet at home, at school or elsewhere, compared with 73% in 2001. The proportion of young people using the Internet has increased since 2001, both at home, from 45% to 56%, and at school, from 56% to 71%.
26% of young people used the Internet at school but not at home.
The proportion of young people that used the Internet generally increased with age, from 42% of those in Key 2
Stage 1 to 84% at Key Stage 2, 94% at Key Stage 3, 97% at Key Stage 4 and 96% among post-16s.
1.4 Use of computers for schoolwork
In 2002, children of all ages undertook a wider range of computer activities at home than in 2001.
Among children in Key Stage 2 who used a computer at home, 40% – compared with 7% in 2001 – said that they did homework on the computer.
Among those in Key Stage 3 and above who used a computer at home, 90% used it for schoolwork. The subjects in which this group was most likely to do homework on a computer were English, science, history and ICT.
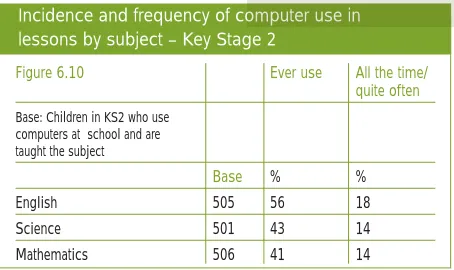
Among children in Key Stage 2 who used computers at school, 56% said that teachers used computers in English lessons, with science lessons mentioned by 43%, and mathematics lessons by 41%.
At Key Stage 3 and above, computers were most widely used in ICT lessons, mentioned by 87% of respondents who took this subject. Computers were also widely used in English (52%), design and technology (49%), science (47%) and mathematics lessons (43%).
As in 2001, the main factors that prevented greater use of computers at school among those in Key Stage 3 and above were lack of time, mentioned by 36% of
respondents, and the limited number of computers, mentioned by 25%.
1.5 Attitudes towards computers and the Internet
As in 2001, the attitudes of both parents and children towards computers were generally positive.
54% of parents without a computer at home felt that their child would achieve better results at school if they had access to a computer at home. Among parents with access to a computer at home, 41% felt that this helped their child achieve better results at school. Among both groups, only 1% thought that access to a computer led to, or would lead to, their children achieving worse results at school.
76% of children in Key Stages 1 and 2 said that using computers made schoolwork more fun and 89% of those in Key Stage 3 and above said that they enjoyed using computers.
87% of children in Key Stage 3 and above felt that computers would be at least ‘quite important’ in their future working lives.
57% of parents said that they thought their child knew how to use the Internet safely. This proportion was lowest among parents of children in Key Stage 1 (15%) and highest among parents of children in Key Stage 4 (88%). 82% of young people in Key Stage 3 and above who were aware of Internet safety issues agreed that it was very important to be aware of these issues.
1.6 Early years and ICT
Among parents of 3-4-year-olds, 64% had a personal or laptop computer at home.
84% of parents of 3-4-year-olds with a computer at home (45% of all parents of 3-4s) said that their child used a computer at home.
56% of parents of 3-4-year-olds had Internet access at home.
70% of parents of 3-4-year-olds who attended an early years setting said that their child used computers in at least one of the settings that they attended.
2 Introduction
2.1 Background
A key strand of the Government’s education strategy is to stimulate and support the use of information and
communications technology (ICT) in teaching and learning as a means of raising educational standards. The cornerstone of the strategy is the ICT in Schools Programme, which supports the Government’s vision for delivering higher standards of education and increasing employability through the use of ICT.
The first Young People and ICT Survey was undertaken in September and October 2001 to create a baseline of the attitudes and experiences of young people aged 5-18 and their parents with regard to the use of ICT both in and out of school. Young People and ICT 2002 is the second survey in the series.
Fieldwork was conducted in September and October 2002, using CAPI (computer-assisted personal interviewing). 2073 interviews were completed, 1804 paired interviews with both parent and child (aged 5-18) and 269 interviews with parents of 3-4-year-olds. 2.2 Survey objectives
The key aims of the research were to:
• examine the extent and pattern of use of ICT by young people, both in and out of school, particularly
educational use
• examine the extent of ICT penetration in the home and wider out-of-school environment, and young people’s access to these technologies
• identify as far as possible the impact of ICT on learning and attainment
• explore the change over time in the above measures through comparison between the 2001 and 2002 survey findings
• explore differences in ownership, use and attitudes between sub-groups within the survey population, in particular in relation to ethnicity, age, key stage, gender, special educational needs (SEN), disability, socio-economic background, region and urban/rural location.
4
3 Survey method
As Young People and ICTis a time-series, it is essential that a comparable research approach is maintained. The methodological approach used in this survey replicated that used in 2001, as far as possible. The survey was conducted using face-to-face paired interviews in the home with a sample of young people in England aged between 5 and 18 in full-time education and with one of their parents. Young people studying away from home and those in tertiary education, were not included. In addition, this year interviews were undertaken with a sample of parents of 3- and 4-year-olds. The research was undertaken in England during September and October 2002, that is, during the same months as the baseline survey.
Fieldwork was conducted using CAPI (computer-assisted personal interviewing). 2073 interviews were completed, 1804 paired interviews with both parent and child (aged 5-18), and 269 interviews with parents of 3-4-year-olds.
The sampling approach undertaken delivered a representative sample of the target population, allowing reliable and robust conclusions to be drawn in relation to several key variables. One of these key variables is the key stage of the child, which is defined as follows:
Throughout the report we refer to social grade, which is based on the chief income earner in the household - that is, the person with the largest income, whether from employment, pensions, state benefits, investments or any other source.
In terms of sub-group analysis, the report focuses mainly on results by key stage and gender of the child; social grade of the household; and access to computers/the Internet at home.
Other sub-group differences were explored in relation to: • gender and age of the parent
• ethnicity of the child and parent • the parent’s educational attainment • whether the child has SEN
• whether the child has a disability
• whether the child lives in a single parent household • number of children in the household
• region • and rurality.
Notable sub-group differences in terms of these variables are highlighted in the report.
Multivariate analysis techniques (multiple regression and CHAID) were also used, for a number of key measures, to further explore relationships between variables in the survey data. The key findings of the multivariate analysis are presented within the relevant chapters.
With regard to analysis by ethnicity, the sample sizes for different ethnic groups were insufficient to permit reliable reporting. Comments on differences by ethnicity are therefore restricted to the findings of the multivariate analysis. Further details of the research method are provided in
the Appendix. 5
Figure 3.1: Definition of key stage of child
Date of birth Age School year Key stage
1/9/97 – 31/8/99 3-5 Early years Foundation
1/9/95 – 31/8/97 5-7 1-2 1
1/9/91 – 31/8/95 7-11 3-6 2
1/9/88 – 31/8/91 11-14 7-9 3 1/9/86 – 31/8/88 14-16 10-11 4 1/9/84 – 31/8/86 16-18 12-13 Post-16
Figure 3.2: Definition of social grade
Social Social Status Chief Income Earner’s
Grade Occupation
A Upper Middle Class Higher managerial, administrative or professional
B Middle Class Intermediate managerial, administrative or professional
C1 Lower Middle Class Supervisory or clerical, and junior managerial, administrative or professional
C2 Skilled Working Class Skilled manual workers
D Working Class Semi and unskilled manual workers
Note on reporting of survey data
The following should be noted about data presented in tables and charts in this report:
• the base shown is, in all cases, the unweighted base for the group concerned
• a ‘*’ symbol denotes a percentage of less than 0.5% (but not zero)
• zero is represented by ‘0’
• percentages for single-response questions do not always add to exactly 100 because of rounding or because of the omission of answer categories such as ‘Don’t know’
• because the survey used a quota, rather than random, sampling design, tests for the statistical significance of findings are not strictly valid. This means that any assessment of the validity of changes over time involves judgement on the part of the researcher and this should be borne in mind when interpreting findings.
6
4 Young people’s use of
computers and the Internet –
An overview
4.1 Computer use
The baseline survey established that almost all young people used computers either at home, at school, or elsewhere. The 2002 survey confirms this finding and shows no evidence of change in the use of computers at home, at school and elsewhere (Figure 4.1). As in the baseline survey, more than 90% of children said that they used computers at school and 75% that they used them at home. 49% of young people used computers in a location other than at home or at school.
Schools continued to enable access to computers for most of the young people who did not enjoy home access. 22% of the sample, which equates to 90% of those without access to a computer at home, used computers at school but not at home.
Figure 4.2 breaks down computer use in 2002 by key stage. Whilst use of computers at home increased with key stage, use at school and elsewhere was highest among those in Key Stage 3.
4.2 Use of computers other than at home or at school
40% of children in Key Stages 1 and 2 and 57% of those in Key Stage 3 and above, used computers somewhere other than at home or at school.
A large part of this use is accounted for by young people using computers at other people’s homes. 34% of children in Key Stages 1 and 2, and 46% of those in Key Stage 3 and above, used computers at other people’s homes. Use of computers in public places was less widespread, particularly among younger children, although 19% of children in Key Stage 3 and above used computers in a public library.
4.3 Time spent using computers
The amount of time spent using computers by young people in Key Stage 3 and above was measured by asking respondents how many hours they had spent using computers at home, at school and elsewhere in the seven days prior to the survey. As in the baseline survey, time spent playing games was separated from time spent on other activities.
Figure 4.3 shows the average amount of time spent using computers by location. Results are shown for the 2001 and 2002 surveys.
The results indicate a decline in time spent using computers since the baseline survey. For school use, this can be explained by the slightly earlier fieldwork start in the 2002 survey, which meant that, for respondents interviewed at the beginning of the survey, the seven days prior to the survey would fall mainly or partly before the beginning of term. Indeed, the average number of hours spent on a computer in the week prior to the survey by those interviewed from mid-September onwards was 3.0, the same as in 2001.
The most striking discrepancy between the two surveys
is in time spent using a computer at home, which the 7
Computer use – 2002 vs. 2001
Figure 4.1 2001 2002
Base: All young people 1748 1804
% %
At home 75 75
At school 93 92
Elsewhere n/a 49
Anywhere 99 98
School, not home 23 22
Time spent using computers in the seven days prior to the survey (mean hours) – Key Stage 3+: 2002 vs. 2001
Figure 4.3 2001 2002
Base: All young people in KS3+ 858 974
At home 7.2 5.7
At school 3.0 2.8
Elsewhere 1.3 1.1
Total 11.5 9.5
Computer use by key stage
Figure 4.2 Total KS1 KS2 KS3 KS4 Post-16
Base: All young people 1804 273 557 446 283 245
% % % % % %
At home 75 64 74 78 80 81
At school 92 85 91 97 94 91
Elsewhere 49 30 44 61 55 49
Anywhere 98 96 99 99 99 98
results suggest has fallen by around 20%. There is, however, little else in the survey findings that suggests a genuine trend in this direction. On the contrary, the results suggest that as many young people were using computers at home as in 2001, and that they were using them for a wider range of activities than before. Bearing the general trend in mind, these results should be treated with caution and should not be seen at this stage to represent a downward trend in use.
In spite of the overall difference between time spent in the 2001 and 2002 surveys, the relative time spent on games and other activities was similar in the two surveys, with around a third of time spent playing games. In 2001, 3.6 of the 11.5 hours were spent playing games; in 2002, 3.1 of the 9.5 hours were spent playing games.
Figure 4.4 shows how time spent using computers in any location varied by gender within key stage.
As Figure 4.4 shows, the amount of time spent using computers increased with key stage, ranging from 7.6 hours in the week prior to the survey among those in Key Stage 3 to 12.8 hours among post-16s. Boys spent more time than girls using computers at all key stages, although much of this difference is accounted for by boys spending more time than girls playing games. 4.4 Use of the Internet
In the baseline survey, 73% of young people used the Internet at home, at school or elsewhere. In the 2002
survey, this proportion increased to 84%. As Figure 4.5 shows, Internet use increased both at home and at school. Among young people who did not access the Internet at home, around six in ten, which equates to 26% of the total sample, gained experience of the Internet at school.
Figure 4.6 breaks down Internet use in 2002 by key stage. As with computer use, use of the Internet at home increased with key stage, peaking among those in Key Stage 4 and post-16s. Use at school and elsewhere was highest among children in Key Stage 4.
4.5 Use of the Internet other than at home or at school
19% of children used the Internet somewhere other than at home or at school. This proportion was lowest among children in Key Stage 1 (1%) and highest among those in Key Stage 4 (35%). Among those in Key Stage 3 and above, 18% accessed the Internet at another person’s home, 11% in a public library, and 2% in an Internet café. 4.6 Young people’s aptitude in using computers
Parents of children in Key Stages 1 and 2 were asked to assess their child’s aptitude in using computers, relative to other children of their age, on a five-point scale ranging from “non-existent” through to “expert”. Young people in Key Stage 3 and above were invited to assess their own skills level, using the same scale, but not in relation to other people of their own age (Figure 4.7). 8
Young People and ICT 2002
[image:10.595.313.539.246.375.2]Time spent using computers in the seven days prior to the survey (mean hours) by gender and key stage – Key Stage 3+
Figure 4.4 Base Not games Games Total
Base: All young people in KS3+
All – Boys 498 6.8 4.2 11.0
– Girls 476 6.1 1.9 8.0
– All 974 6.4 3.1 9.5
KS3 – Boys 231 4.8 4.4 9.2
– Girls 215 3.9 2.0 5.9
– All 446 4.3 3.2 7.6
KS4 – Boys 141 7.3 4.0 11.3
– Girls 142 7.0 2.2 9.2
– All 283 7.2 3.1 10.2
Post-16 – Boys 126 10.4 4.2 14.6
– Girls 119 9.6 1.3 10.9
– All 245 10.0 2.8 12.8
Internet use by location – 2002 vs. 2001
Figure 4.5 2001 2002
Base: All young people 1748 1804
% %
At home 45 56
At school 56 71
Elsewhere n/a 19
Anywhere 73 84
School, not home 26 26
Internet use by key stage
Figure 4.6 Total KS1 KS2 KS3 KS4 Post-16
Base: All young people 1804 273 557 446 283 245
% % % % % %
At home 56 30 32 62 70 70
At school 71 23 72 81 88 83
Elsewhere 19 1 5 34 35 30
Anywhere 84 42 84 94 97 96
[image:10.595.70.295.416.642.2]It is worth noting that this question is a self-assessment, and so may reflect confidence in computing more closely than actual skills levels.
The results show a broadly consistent progression through the key stages, from a majority of parents assessing Key Stage 1 children as novices, to around 90% of those in Key Stage 4 and post-16s assessing their skills level as intermediate or above. Post-16s were more likely than those in Key Stage 4 to assess their skills level as ‘advanced’ or ‘expert’, but also more likely to rate their level as ‘non-existent’ or ‘beginner’. Assessment of skills levels varied by the gender of the child. At Key Stage 1 and 2, parents were more likely to rate boys’ skills as being ‘intermediate’ or higher than girls’ skills. At Key Stage 3 and above, boys were more likely than girls to rate their skills level as ‘advanced’ or ‘expert’ (Figure 4.8).
Whether or not the child had access to a computer at home also had a considerable bearing on how they or their parent assessed their skills level (Figure 4.9). Those who had access to a computer at home perceived their ICT skills as more advanced, relative to those without access.
Findings from multivariate analysis
Multivariate analysis was conducted to examine correlations between a child’s perception of their computing skills and a range of other variables. This analysis indicated that the presence of a computer at home, and in particular, a computer that has Internet access, is key to explaining a child’s perception of their computing skills. Additionally, the role of parents is clearly important, with both the parent’s education level, and their perception of their own ICT skills level, significant factors in pupils’ perceptions of their skills levels. There was also a positive association between a child being black or Asian and high self-assessed ICT skills.
Factors that were related to children having low ICT skills levels were the child being identified as having SEN, low parental educational attainment and parents assessing themselves as having no ICT skills.
9 Young people’s aptitude in using computers –
by key stage
Figure 4.7 KS1 KS2 KS3 KS4 Post-16
Base: All young people 273 557 446 283 245
% % % % %
Non-existent 4 1 1 * 2
Beginner level 53 38 22 7 12
Intermediate level 24 44 53 55 46
Advanced level 9 10 19 33 37
Expert 1 1 4 4 3
Don’t know 10 5 2 * 0
[image:11.595.294.528.169.351.2]Young people’s aptitude in using computers – by gender
Figure 4.8 KS1 & 2 KS3+
Boys Girls Boys Girls
Base: All young people 426 404 498 476
% % % %
Non-existent 2 2 1 1
Beginner level 39 46 15 15
Intermediate level 41 34 47 57
Advanced level 11 9 31 24
Expert 1 1 5 2
Don’t know 6 8 1 1
Young people’s aptitude in using computers – by home computer access
Figure 4.9 KS1 & 2 KS3+
Computer at home Computer at home
Yes No Yes No
Base: All young people 624 206 818 156
% % % %
Non-existent 1 4 1 2
Beginner level 38 57 12 30
Intermediate level 43 21 52 52
Advanced level 12 9 30 10
Expert 1 3 4 2
[image:11.595.58.283.571.732.2]5 ICT in the home
5.1 Household access to ICT
Parents were asked what types of ICT they had in their homes. Figure 5.1 shows the results for all households alongside those from the baseline survey.
As in 2001, almost all households had access to at least one type of ICT. Access levels for individual technologies have increased, with the exception of interactive digital TV. The apparent fall in access to the latter might result from the collapse of a major digital television supplier. It might also be explained by a change in wording in the current survey, whereby respondents were asked whether they had interactive digital TV “with Internet access”, a qualifier which was not included in 2001.
For items where penetration was already relatively high, such as computers, mobile phones and games consoles, increases in penetration were relatively small. However, access to the less established technologies, such as DVD players, WAP phones and palmtop computers, has increased considerably. Digital cameras, which were not covered in the baseline survey, were present in 23% of households in 2002. As the baseline survey identified, there is a strong relationship between access to ICT in the home and the social grade of the household’s chief income earner, with ownership levels higher among those in higher social grade households. Ownership was particularly low among DE households, relative to other groups (Figure 5.2). The one exception to this general trend was for games consoles, ownership of which was highest among C2 households (83%), and lowest among AB households (70%).
5.2 Household access to computers
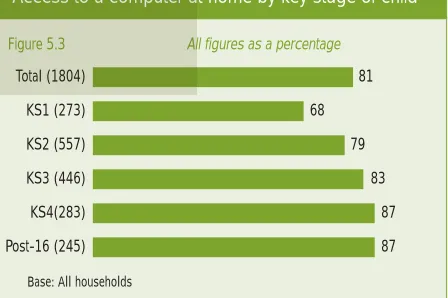
The proportion of households that had access to a personal or laptop computer in the home increased from 78% in 2001 to 81% in 2002. As Figure 5.3 shows, access to a home computer increased with key stage from 68% of Key Stage 1 to 87% of post-16s.
Among households that owned computers, 68% had one computer, 32% two or more. The proportion that owned two or more computers increased with social grade, with 17% of DE households that owned computers owning two or more, rising to 53% of AB households. Findings from multivariate analysis
Multivariate analysis was conducted to examine
correlations between computer ownership and a range of other variables. The analysis suggested that the following variables were related to computer ownership: social 10
Young People and ICT 2002
92 88
76 71
23 43
36 3333 23
8 2 5 21
n/a 77
[image:12.595.312.539.185.404.2]13 16 79
Figure 5.1 All figures as a percentage
Access to ICT at home
PC
2001
Laptop Mobile phone Games console DVD player IDTV Digital camera
WAP/3G phone Palmtop
2002 Base: All households (1,804)
Figure 5.3 All figures as a percentage
Access to a computer at home by key stage of child
Total (1804) 81
KS1 (273) 68
KS2 (557) 79
KS3 (446) 83
KS4(283) 87
Post-16 (245) 87
Base: All households
[image:12.595.315.539.499.648.2]Household access to ICT – by social grade
Figure 5.2 Total AB C1 C2 DE
Base: All young people 1804 379 479 417 529
% % % % %
Personal computer 79 93 86 81 60
Laptop computer 16 36 17 11 3
PERSONAL OR LAPTOP 81 95 88 82 61
COMPUTER (NET)
Mobile phone 92 95 92 93 88
Games console 77 70 77 83 78
DVD player 43 46 47 45 34
Interactive digital TV 33 33 36 37 26
Digital camera 23 37 27 22 11
WAP/3G phone 21 27 25 21 14
Palmtop computer 5 12 5 2 1
grade, highest education qualification of parent, marital status of parent and age of child and parents. Social grade and parental qualifications proved to be the most powerful predictors of computer ownership.
Parents aged 35 and over in social grade AB were the most likely to have a computer at home (96%). Parents in social grade DE with no educational qualifications were the least likely to do so (50%). Within this group, those who were under 35 were less likely to have a computer at home than those aged 35 and over (33% compared with 57%). The age of the parent also affected computer ownership, with computer ownership increasing with age.
5.3 Computers in the home
81% of households had a PC or laptop in the home. In the large majority of these households (91%), at least one computer in the household was used on a regular basis. Where this was the case, respondents were asked a series of questions about each computer in the household, including how it had been paid for, for what purposes it had been bought, and where it was situated in the home. How computers were paid for
83% of households, compared with 80% in 2001, had bought their main computer using household money. Where computers had not been bought with household money, they were most commonly paid for by friends or relatives. Single parents (19%) and those in DE households (15%) were particularly likely to say that friends or relatives had paid for their main computer and were correspondingly less likely to have bought the computer themselves (72% and 78% respectively). Among each group, however, the proportion buying for themselves had increased since last year.
Reasons for obtaining a computer
Parents were asked to select, from a list of reasons for purchase, why they had obtained each computer in the home. Where they gave more than one reason, they were then asked to state the main reason. This question was new to the 2002 survey.
Figure 5.4 shows the proportions of parents citing each purpose as (a) a reason for purchase and (b) the main reason for purchase, for at least one computer in the home.
The results show that children’s needs play an important part in parents’ decisions to buy computers. 90% of parents said that their children’s educational or leisure needs were among the reasons for buying a computer and 65% that they were the main reason. The proportion of parents citing child-related reasons for acquiring a computer increased with key stage, ranging from 78% among parents of Key Stage 1 children to 95% of parents of children in Key Stage 4 and post-16s.
Parents were more likely to say that they had acquired a computer for their children’s school/college work than for their leisure use, the relative importance of school/college work increasing with the age of the child.
Analysis by social grade shows that the lower the social grade, the more likely a parent was to say that their children’s needs were the main driver behind acquiring a computer. This is largely because, among ABC1s, by definition ‘white-collar’ households, children’s needs were more likely to compete with parents’ own work-related needs. 76% of those in DE households with a computer said that their children’s educational or leisure needs were the main reason for buying at least one computer, compared with only 9% who gave their work as a main reason. Among AB households, on the other hand, similar proportions of parents cited their own work (53%) and child-related reasons (52%).
Where computers were located in the home
Parents were asked about the location of each computer in the home. 67% had a computer in a communal area, such as a living room, shared study or shared bedroom, whilst 18%, compared with 20% in 2001, said that the child taking part in the interview had a computer in their own bedroom1.
11 Reasons for obtaining a computer
Figure 5.4 All reasons Main reason
Base: All households with a computer 1307 1307 at home that was used regularly
% %
Parents’ work purposes 47 30
Parents’ recreational/leisure use 52 15
Household tasks 22 2
Parents’ use of e-mail 37 2
Children’s school/college work 82 54 Children’s recreational/leisure use 66 13 ANY CHILD-RELATED PURPOSE (NET) 90 65
1
26% had a computer in another private area, such as another family member’s bedroom or study. As was found in 2001, the proportion of children that had a computer in their own bedroom increased with the key stage of the child, ranging from 9% of those in Key Stage 1 to 30% of post-16s.
5.4 Internet access at home
In the baseline survey, 64% of households had access to the Internet. In the 2002 survey, this proportion increased to 68%.2
Among those with a computer in the household, 81% had access to the Internet, whilst 12% of households with no computer accessed the Internet at home via another source, usually a digital TV.
Internet access at home increased in line with key stage of the child and, in particular, with social grade (Figure 5.5). There is no evidence at this stage of the gap closing between AB and DE households, 92% and 43% with access in 2002, compared with 87% and 41% in 2001.
Findings from multivariate analysis
Multivariate analysis was conducted to examine correlations between Internet access in the home and a range of other variables.
Social grade, age of parents and educational
qualifications proved to be the most powerful factors in explaining Internet access. However, other factors were also significant. The analysis suggested that Asians were less likely to have Internet access than white
respondents; households with SEN pupils were much less likely than those without to have access to the Internet; region and area deprivation also had a small, but significant effect on Internet access.
Within social grades C1, C2 and DE, highest educational qualification was a key predictor of Internet access at home. Internet access rose from 48% for those in social grades C1 and C2 with no qualifications, to 71% with NVQ 1 to 4, to 92% with NVQ 5. In social grade DE, the key distinction was between those with no qualifications (26%) and those with some qualifications (42%).
Multivariate analysis suggested that the following variables were related to Internet access among computer owners: social grade, whether the child had SEN, the parent’s level of education and the parent’s age. All of these variables proved to be reasonably powerful predictors.
Social grade proved to be the first, and therefore the most powerful discriminator, followed by the parent’s level of education. For example, 94% of those in social grade AB with a computer had access to the Internet, compared with 59% of those in social grade DE. Among ABs, 95% of those with NVQ level 3 qualifications and above had Internet access, compared with 91% of those with lower than NVQ level 3. Among C1 computer owners, Internet access averaged 83%, but varied between 66% for those with no qualifications and 87% for those with at least NVQ level 1. 5.5 Mode of access to the Internet
93% of respondents who said that they had Internet access at home accessed the Internet through a personal computer. The other main modes of access were through a laptop computer (13%); an interactive digital TV (11%) and a WAP/3G phone (8%). Among households with Internet access, but without a personal or laptop computer at home, 75% accessed the Internet via interactive digital TV, 26% via a WAP/3G phone. The large majority of those with Internet access at home (82%) accessed the Internet via a telephone line using a
12
Young People and ICT 2002
Figure 5.5 All figures as a percentage
Access to the Internet at home by key stage of child and social grade
Total (1804) 68
Key StageKS1 (273) 56
KS2 (557) 66
KS3 (446) 70
KS4 (283) 72
Post-16 (245) 76
Social Grade AB (379) 92
C1 (479) 78
C2 (417) 64
DE (529) 43
Base: All households
2
modem, although the proportion using ADSL/broadband increased from 6% in 2001 to 10% in 2002. Households in urban areas (12%) were more likely than those in rural areas (5%) to use ADSL/broadband. Among those accessing the Internet via a telephone line, 23% had a separate line for the Internet.
5.6 Young people’s use of ICT in the home
Figure 5.6 shows the proportions of children in the 2001 and 2002 surveys that used ICT on a regular basis.3
Usage levels have generally increased slightly, with the largest increase in use of DVD players, from 12% to 26%, which reflects the increase in household penetration of DVD players, from 23% in 2001 to 43% in 2002. 83% of young people used at least one of the items listed on a regular basis.
Figure 5.7 shows usage levels by the key stage of the child.
Broadly speaking, use of ICT equipment increased with age, with usage levels highest among those in Key Stage 4 and post-16s. Use of games consoles peaked among those in Key Stages 2 and 3 and use of interactive digital TV was at a similar level among those from Key Stage 2 upwards.
These patterns of use are slightly at odds with the patterns established in the baseline survey, where usage levels tended to be higher among post-16s than among those in Key Stage 4. In the absence of corroborating evidence, it would be premature to regard this as representing a trend, rather than a ‘blip’ resulting from sampling variance.
The baseline survey identified a strong relationship between the gender of the child and use and ownership of games consoles and mobile phones; the former being more popular among boys, the latter among girls. This relationship held true in 2002 across different age groups, with use of games consoles peaking among boys in Key Stage 3 (89%) and use of mobile phones among girls in Key Stage 4 (85%).
Ownership of ICT equipment other than computers
Ownership of ICT among young people increased slightly in 2002 for most types of ICT, as would be expected, given that levels of household ownership have increased. Games consoles (43%, compared with 40% in 2001) and mobile phones (36%, compared with 34% in 2001) remain the only items widely owned by young people. However, ownership levels for DVD players (6%) and WAP phones (4%) have doubled since the baseline survey. 64% of young people owned at least one piece of ICT equipment.
Figure 5.8 shows ownership levels of games consoles, mobile phones, DVD players and WAP phones by key stage and gender of the child.
13
3
Usage levels for young people in Key Stages 1 and 2 are based on a question asked of the parent, those for Key Stage 3 and above on a question asked of the young person.
Young people’s use of ICT at home – 2002 vs. 2001
Figure 5.6 2001 2002
Base: All young people 1748 1804
% %
Games console 59 62
Mobile phone 41 44
DVD player 12 26
Interactive digital TV 26 21
WAP/3G phone 2 5
Digital camera n/a 3*
Palmtop computer 1 1
None of these 13 7
* asked of those in Key Stage 3 and above only
Young people’s use of ICT at home – by key stage
Figure 5.7 KS1 KS2 KS3 KS4 Post-16
Base: All young people 273 557 446 283 245
% % % % %
Games console 47 67 68 64 50
Mobile phone 7 22 59 76 73
DVD player 17 21 29 35 31
Interactive digital TV 12 21 25 22 26
WAP/3G phone * 1 4 12 13
Digital camera n/a n/a 4 8 7
Palmtop computer * * 1 * 1
Young people’s ownership of ICT at home – by key stage and gender
Figure 5.8 Key Stage Gender
KS1 KS2 KS3 KS4 Post-16 M F
Base: All young people 273 557 446 283 245 924 880
% % % % % % %
Games console 27 45 50 47 34 60 24
Mobile phone 0 12 52 68 69 30 41
DVD player 1 3 5 15 9 10 2
Ownership of mobile phones and WAP/3G phones increased with key stage, whilst ownership of DVDs peaked at Key Stage 4, before falling away slightly among post-16s. Ownership of games consoles peaked earlier, at Key Stage 3. The proportion of young people owning at least one piece of ICT equipment increased with key stage, ranging from 28% of those in Key Stage 1 to 88% of post-16s.
5.7 Young people and computers in the home
Use of computers among young people
In households, including those without access to a computer, 75% of young people used a computer at home, the same proportion as in 2001. In households that had access to a computer, 93% of young people used a computer at home, a slightly lower proportion than in 2001 (96%).
As the baseline survey established, levels of home computer use in all households were similar among boys (74%) and girls (76%) and increased with the age of the child. In line with ownership patterns, use also increased with social grade (Figure 5.9).
68% of children with special educational needs and 72% of those with a disability used a computer at home.
Ownership of computers among young people
In order to establish the extent to which young people have sole access to a computer at home, a question in
the 2002 survey asked whether or not the young person was the only person who used the computer. As this question was not asked in the 2001 survey, results are presented only for the 2002 survey.
9% of young people who used a computer at home were the only users of at least one computer in the home. This proportion increased with key stage, ranging from 3% of those in Key Stage 1 to 16% of post-16s. As would be expected, the likelihood of a child having sole access to a computer at home was higher among households with single children. 18% of children in these households had sole access, compared with 8% of those in households with two children, 5% of those in households with three children, and 4% in households with four or more children. Ownership of computers among older children was established by asking those in Key Stage 3 and above who used a computer at home whether they owned the computer that they used most often. Overall, 28% of this group said that they owned this computer, the same proportion as in 2001. Among those in Key Stage 3, 21% owned the computer, compared with 31% of those in Key Stage 4 and 37% of post-16s. The likelihood of children sharing computers with siblings tended to increase with the number of children in the household: among single children, 41% said that they owned the computer that they used most often, whilst among those in households with four or more children, this proportion fell to 17%. Time spent using computers
As a measure of the volume of young people’s computer use in the home, parents of children in Key Stages 1 and 2 were asked how long their child had spent using a computer in the seven days prior to the survey. The same question was asked directly of young people in Key Stage 3 and above. As in the baseline survey, time spent playing games was separated from time spent on other activities. Across the sample as a whole, including those without a computer in the home, young people had spent an average of 4 hours using a computer in the week prior to the survey, with just under half of this time spent playing games. This compares with an overall average of 5.6 hours in the baseline survey.
Figure 5.10 shows the 2001 and 2002 results by key stage. Whilst time spent increased with key stage in both surveys, the number of hours spent was lower in the current survey across all key stages. (See note of caution regarding these data in section 4.3).
14
Young People and ICT 2002
Figure 5.9 All figures as a percentage
Use of computers at home by key stage of child and social grade
Total (1804) 75
Key StageKS1 (273) 64
KS2 (557) 74
KS3 (446) 78
KS4 (283) 80
Post-16 (245) 81
Social Grade AB (379) 93
C1 (479) 82
C2 (417) 78
DE (529) 53
At each key stage, boys spent more time using computers at home than girls. However, much of this difference was accounted for by boys spending more time than girls playing games on computers.
Use of computers in the home with other people
Children in Key Stages 1 and 2 who used computers at home were asked to say with whom they used them. 53% of respondents said that they used a computer on their own and 52% that they used one with their parents. 31% used a computer with siblings and 5% with other family members. 10% said that they used a computer at home with their friends.
Parents of children in Key Stages 1 to 4 whose child used a computer at home were asked how often they used computers at home with their child. 69% said that they used computers with their child, 40% doing so at least once a week and 7% every day. The proportion of parents that used computers with the child decreased the older the child, from 78% of parents of children in Key Stage 1 to 55% in Key Stage 4.
Computer activities at home
Young people who used a computer at home were asked what types of things they did on the computer. In order to maintain comparability with the baseline survey, children in Key Stages 1 and 2 were asked the question
unprompted, whilst older children were asked to choose their answers from a list of activities.
Activities undertaken by those in Key Stages 1 and 2 in the baseline and 2002 surveys are shown in Figure 5.11.
For the most part, the pattern of results in the two surveys is similar, with playing games and drawing pictures still the two most popular activities among both age groups. There is evidence of children’s repertoire of activities broadening, with increasing proportions using e-mail, the Internet and educational CD- ROMs. Much more striking, however, is the very substantial increase in the proportion of children in Key Stage 2 reporting that they do homework on a computer, from 7% in 2001 to 40% in 2002.
Parents of children in Key Stages 1 and 2 who said that they used a computer at home with their child were asked what activities they did. Among parents of children in Key Stage 1, the activities most commonly mentioned were playing games (47%) and using educational programs or CD- ROMs (42%). Among parents of children in Key Stage 2, homework again emerged as an important activity for this age group, mentioned by 45%. Homework was also the main computer activity in which parents of children in Key Stages 3 and 4 became involved. Figure 5.12 shows activities undertaken by those in Key Stage 3 and above in the current and baseline surveys. The results suggest that children in Key Stage 3 and above are broadening their repertoire of computer activities. As in 2001, school or college work was the activity undertaken most widely, mentioned by 90% of respondents, compared with 85% in 2001. Most of this increase is accounted for by an increase in the
proportion of those in Key Stage 3 saying that they used 15 Time spent using computers at home in the seven
days prior to the survey (mean hours by activity): 2002 vs. 2001
Figure 5.10
Base: All young people
2001 2002
Base Not Games Total Base Not Games Total
games games
% % % % % %
Total 1748 3.2 2.4 5.6 1804 2.2 1.7 3.9
KS1 262 1.3 1.6 2.9 273 0.5 0.9 1.3
KS2 558 1.7 2.3 4.0 557 1.0 1.2 2.3
KS3 392 3.2 2.5 5.7 446 2.3 2.4 4.7
KS4 297 4.8 3.1 7.9 283 3.7 2.4 6.1
Post-16 239 6.8 2.5 9.3 245 5.3 2.0 7.3
Activities undertaken on the computer at home – Key Stages 1 & 2 – 2002 vs. 2001
Figure 5.11 2001 2002
Total KS1 KS2 Total KS1 KS2
Base: All children in KS1 592 220 372 581 172 409 & 2 who use a computer
at home
% % % % % %
Playing games 88 89 88 88 87 88
Drawing pictures 49 60 45 55 62 52
Using educational 24 23 24 31 32 30
CD-ROMs
Typing letters 24 20 26 31 23 34
Writing stories 26 15 30 27 18 31
Using the Internet 23 13 27 30 14 36
Homework/study 6 4 7 31 8 40
a computer at home for school or college work, from 78% in 2001 to 88% in 2002.
Girls were more likely than boys to do school or college work on a computer at home (95% and 86%), as was found in the baseline survey. Otherwise the tendency for boys to use computers for a wider range of activities than girls was less marked than in 2001. Whilst in the baseline survey, the average number of activities mentioned was 3.5 for boys and 3.1 for girls, in 2002 the equivalent figures were 4.8 and 4.7 respectively.
Use of home computers to do school or college work
Young people in Key Stage 3 and above who did school or college work on a computer at home were asked a number of questions about the work they did. These included: • how many hours per week they spent doing this work • whether the work they did was set by a teacher or
done on their own initiative
• for which subjects they did homework
• what software packages they used for this work • whether or not they experienced difficulties using
these packages.
On average, children in Key Stage 3 and above who did school or college work on a computer at home spent 3.1 hours per week on this work. This time increased with age, with those in Key Stage 3 doing an average of 2.1 hours; Key Stage 4 an average of 3.4 hours; and post-16s an average of 4.9 hours.
As in 2001, almost all (95%) of this group said that the school or college work they did included work set by teachers. The proportion that said that they did work for their own interest or needs increased from 41% in 2001 to 48% in 2002. Among post-16s, who were most likely to do school or college work on their own initiative, this proportion rose from 49% to 59%.
A new development in the 2002 survey was to ask young people about their use of computers, both at home and at school, on a subject basis. In terms of home use, those using computers for school or college work were asked how often they did so in a range of subjects. Figure 5.13 shows, for each subject, the proportions saying that they (a) ever used computers and (b) used them ‘all the time’ or ‘quite often’. Respondents who said that they were not taught the subject concerned have been excluded from the base for each subject.
Young people were particularly likely to do English homework on a computer at home. 77% of those who used computers at home for school or college work, and who studied English, mentioned doing English homework on a computer. Science, history and ICT were also all mentioned by more than half of respondents. The subjects for which computers were least likely to be used 16
Young People and ICT 2002
[image:18.595.70.298.223.425.2]Activities undertaken on the computer at home – Key Stage 3+: 2002 vs. 2001
Figure 5.12 2001 2002
Total KS3 KS4 Post Total KS3 KS4 Post
-16 -16
Base: All children in 654 266 220 168 760 337 226 197
KS3+ who use a computer at home
% % % % % %
School/college work 85 78 88 89 90 88 91 93
Playing games 59 69 55 49 70 83 61 56
Using the Internet 52 42 52 65 67 61 71 76
Playing CDs 28 27 30 29 48 45 50 51
Using CD-ROMs 23 16 21 35 42 35 47 47
Using e-mail 33 19 35 49 45 33 50 62
Typing letters 25 16 24 39 33 25 38 45
Visiting chat rooms 14 9 16 19 17 12 20 24
Frequency of doing school/college work on a computer at home by subject – Key Stage 3+
Figure 5.13 Base Ever All the time/
quite often
Base: Children in Key Stage 3+ who used computers at home for school/college work and were taught the subject
% %
English 624 77 35
Science 622 58 19
ICT 598 55 30
History 561 55 19
Geography 551 43 15
Design & Technology 575 37 15
RE 568 30 8
Modern foreign languages 573 29 7
Art 555 27 8
Mathematics 618 26 6
Humanities 478 21 8
Music 536 11 3
for homework were music (11%) and PE (7%). In all subjects, where young people used computers to do homework, they tended to do so ‘quite often’ or ‘now and again’, rather than ‘all the time’.
Those in Key Stage 3 and above who did school or college work on a computer at home were asked what software packages they usually used for this work. Since the response options were changed in the 2002 survey, the results are not directly comparable with those from the baseline survey. Results are therefore shown for the 2002 survey only, broken down by key stage (Figure 5.14).
Word processing packages were the most widely used type of software, mentioned by 84% of respondents, followed by spreadsheet software mentioned by 54%. Database software, graphics or simulation packages and e-mail were all used by around a third of respondents. Young people in Key Stage 4 and post-16s tended to use a wider range of packages than those in Key Stage 3. Use also varied to some extent by social grade, with those in higher social grades using a wider repertoire of software. As in last year’s survey, there was little evidence that children were restricted in doing their school/college work at home by the software available on their computer. 94% said that it was very or fairly easy for them to do their work using the software available, 39% saying that it was very easy for them to do so. This compares with figures of 92% and 41% respectively in 2001. Post-16 students
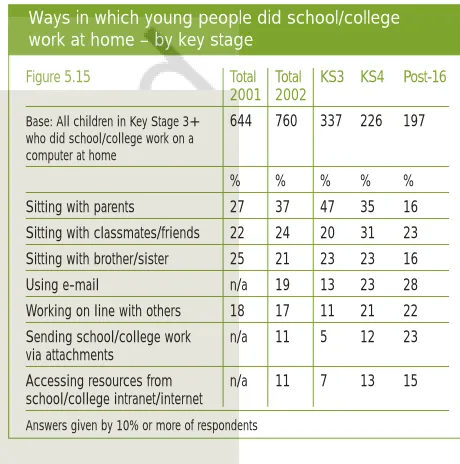
[image:19.595.294.524.287.519.2](55%), and those in AB households (48%) were particularly likely to answer ‘very easy’ to this question. Respondents in Key Stage 3 and above were asked whether they worked at home in any of the ways shown in Figure 5.15. This question was asked with a more restricted answer list in 2001. Comparing the results across the two years, the most notable difference is evidence of more parental involvement in the 2002 survey.
5.8 Barriers to computer use at home
Reasons for not buying computers
Parents in households that did not have a computer were asked why they had not bought one.
The findings were similar to those in the baseline survey4. Financial barriers, such as lack of money or the cost of a computer, mentioned by 63% of respondents (compared with 75% in 2001), were the overriding factors that prevented parents from buying a computer. The only other reason given by more than 10% of respondents was that they were not interested in having a computer (14%, compared with 12% in 2001). As in the 2001 survey, parents in DE households were most likely to say that they could not afford to buy a computer. 75% of this group said that they had not bought a computer for financial reasons, compared with 55% of those in C2 households, 43% of those in C1 households and 40% of those in AB households.
17 Software packages used at home for school/college
work – by key stage
Figure 5.14 Total KS3 KS4 Post-16
Base: All children in Key Stage 3+ 684 296 207 181
who did school/college work on a computer at home
% % % %
Word processing packages 84 76 92 88
Spreadsheet packages 54 43 65 62
Database packages 36 26 45 43
Graphics/simulation packages 31 29 32 33
E-mail 30 21 38 37
Desktop publishing packages 23 18 31 22
Multimedia tools 19 16 26 18
Subject-specific software 17 18 17 16 Design & technology packages 15 11 19 14
Answers given by 10% or more of respondents
Ways in which young people did school/college work at home – by key stage
Figure 5.15 Total Total KS3 KS4 Post-16
2001 2002
Base: All children in Key Stage 3+ 644 760 337 226 197
who did school/college work on a computer at home
% % % % %
Sitting with parents 27 37 47 35 16
Sitting with classmates/friends 22 24 20 31 23 Sitting with brother/sister 25 21 23 23 16
Using e-mail n/a 19 13 23 28
Working on line with others 18 17 11 21 22 Sending school/college work n/a 11 5 12 23 via attachments
Accessing resources from n/a 11 7 13 15 school/college intranet/internet
Answers given by 10% or more of respondents
4
Conflicts over computer use at home
As in the baseline survey, the questionnaire explored the extent to which children’s access to computers at home was restricted by availability of the computer(s). Parents of children in Key Stages 1 and 2 were asked whether their child ever wanted to use a computer at home, but was unable to do so because another person was using it. Where this occurred, they were asked how often this happened, who was involved, and how the situation was resolved. The same set of questions was asked of children in Key Stage 3 and above. In comparing results with those from the baseline survey, it should be noted that, for Key Stages 1 and 2, the results from the baseline survey are based on questions asked of the child, rather than of the parent.
66% of respondents, the same proportion as in the 2001 survey, said that conflicts of this nature occurred. Of these, 78% said that they happened at least once a week and 24% that they happened on a daily basis.
As would be expected, the likelihood of experiencing conflict increased with the number of children in the household, the proportion reporting conflicts ranging from 49% of children in households with one child, to 79% of those in households with four or more.
In terms of social grade, conflicts were most commonly reported in AB households (70%) and least so in DE households (61%). This may be a reflection of the higher likelihood of parents in AB households using computers themselves, therefore competing with their children for time on the computer.
Where conflicts occurred, they were resolved in a variety of ways, with people taking turns being the solution most commonly mentioned (32%). Parents resolving the situation, arguments or fighting, and work or study taking priority were each mentioned by 19% of respondents. 13% of respondents said that parents took priority in these circumstances.
18
6 ICT at school
6.1 Young people’s use of computers in schools
92% of young people in the sample said that they used computers at school or college. This is in line with the figure of 93% reported in 2001. Figure 6.1 shows the proportions saying that they used computers at school by key stage. Whilst these differ slightly between the two surveys, the fluctuations are not sufficient to suggest genuine change and more likely result from sampling variation. Averaging the figures across the two surveys, the broad conclusion is that the proportions using computers are similar for each of the key stages, with the exception of Key Stage 1, where use is slightly less widespread.
The amount of use of computers at school was measured differently for younger and older children. Those in Key Stages 1 and 2 were asked how often they used computers, whilst those in Key Stage 3 and above were asked how many hours they had spent using computers in school or college in the week prior to the survey.
89% of children in Key Stages 1 and 2 who used computers at school said that they did so at least once a week, the same proportion as in the baseline survey. The proportion of Key Stage 1 pupils saying that they used computers on a daily basis increased from 9% in 2001 to 14% in 2002.
As in 2001, children without access to a computer at home reported more frequent use of computers at school than those who had access to a computer at home, 45% of the former saying that they used them at least twice a week, compared with 33% of the latter.
Figure 6.3 shows, for the 2001 and 2002 surveys, the average number of hours that children in Key Stage 3 and above had spent using computers at school in the week prior to the survey.
On average, pupils reported spending 2.8 hours using computers at school or college in the week prior to the survey, which is broadly in line with the 3.0 hours reported in 2001. Around 12% of use was games-related, a slightly lower proportion than in 2001 (16%). Total use increased with key stage, ranging from just under two hours per week for those in Key Stage 3 to over four hours for post-16s. Conversely, the proportion of time spent on games decreased with key stage, those in Key Stage 3 spending 17% of their time on computers playing games, falling to 8% among post-16s.
The 2001 survey found that young people without access to a computer at home spent longer using computers at school than those who had home access. However, the average difference was only around half an hour and,
[image:21.595.57.283.394.546.2]once time spent playing games was removed, use was 19
Figure 6.1 All figures as a percentage
Use of computers at school by key stage of child
Total (1804) 92
Key StageKS1 (273) 85
KS2 (557) 91
KS3 (446) 97
KS4 (283) 94
Post-16 (245) 91
Base: All children
Frequency of using computers at school Key Stages 1 & 2: 2002 vs. 2001
Figure 6.2 2001 2002
Total KS1 KS2 Total KS1 KS2
Base: All children in KS1 821 320 501 738 231 507 & 2 who use a computer
at school
% % % % % %
Daily 8 9 7 10 14 8
At least twice a week 30 32 29 26 28 25 At least once a week 51 48 53 53 44 57
At least once a month 7 5 8 6 6 6
Less than once a month 3 4 2 3 5 3
Don’t know 1 3 1 2 3 1
Time spent using computers at school in previous seven days (mean hours by activity) – Key Stage 3+: 2002 vs. 2001
Figure 6.3
Base: 2001 2002
All KS3+Base Not Games Total Not Games Total
(2001/2002) games games
Total 858/974 2.5 0.5 3.0 2.4 0.3 2.8
KS3 380/446 1.6 0.6 2.2 1.5 0.3 1.9
KS4 284/283 2.3 0.3 2.7 2.8 0.3 3.1
higher among those with a computer at home. The 2002 survey also suggests that those without access to a computer at home spent more time using computers at school than those with access. Average use of a computer at school for this group was 3.7 hours in the week prior to the survey, compared with 2.6 for those with a home computer. This difference is more or less maintained once games use is removed, the respective averages being 3.3 and 2.3 hours.
6.2 Circumstances in which computers are used in school
Children who used computers at school were asked where and with whom they used them.
Where young people use computers at school
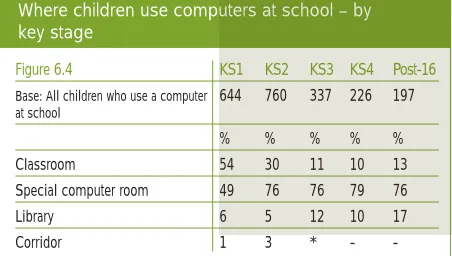
Figure 6.4 shows where children in each key stage said that they used computers at school. This question was included in the survey for the first time in 2002.
At Key Stage 1, computers tended to be used either in the classroom (54%) or in a special computer room (49%). Few children said that they used computers in either libraries or corridors. Older children were more likely to use computers in a special computer room, although classroom use was still relatively common at Key Stage 2. Use of computers in libraries was more common at Key Stage 3 and above, particularly among post-16s, 17% of whom said that they used computers in the school or college library.
With whom young people use computers at school
Children in Key Stages 1 and 2 were asked with whom they used computers in school. 59% of children said they used computers with friends in their class, with 28% saying that they used them with teachers, 23% on their own, and 19% with a pupil chosen by the teacher. Working independently was slightly more common in
Key Stage 2 than in Key Stage 1, as was working with a pupil chosen by the teacher. The opposite was true for working with a teacher. Boys were more likely than girls to say that they worked with a pupil chosen by a teacher, whilst girls were more likely to work with a friend.
These results were broadly similar to those found in the 2001 survey.
Children in Key Stage 3 and above, as would be expected, were more likely than younger children to work independently on computers. 73% said that they worked on computers on their own, with the proportion that did so increasing with key stage, from 64% at Key Stage 3 and 78% at Key Stage 4 to 85% of post-16s. 32% said that they worked in pairs and 11% that they worked in groups of 3 or more, with those in Key Stage 3 most likely to work in pairs and post-16s most likely to work in groups.
Among children who said that they worked on computers with others, 93% said that they usually worked with other students, 17% that they usually worked with a teacher or tutor.
6.3 Computer activities at school
All children who said that they used a computer at school were asked what types of things they did on the
computer. This question was asked unprompted for all key stages, as in the 2001 survey. Figure 6.5 shows the main activities mentioned by those in Key Stages 1 and 2. Overall results are shown for the 2001 and 2002 surveys, with results broken down by key stage.
20
Young People and ICT 2002
[image:22.595.72.298.429.557.2]Where children use computers at school – by key stage
Figure 6.4 KS1 KS2 KS3 KS4 Post-16
Base: All children who use a computer 644 760 337 226 197
at school
% % % % %
Classroom 54 30 11 10 13
Special computer room 49 76 76 79 76
Library 6 5 12 10 17
Corridor 1 3 * -
[image:22.595.313.539.601.800.2]-Activities undertaken on the computer at school – Key Stages 1 & 2: 2002 vs. 2001
Figure 6.5 2001 2002
Total KS1 KS2 Total KS1 KS2
Base: All children in KS1 821 320 501 738 231 507 & 2 who use a computer
at school
% % % % % %
Drawing pictures 54 66 48 63 72 59
Playing games 44 55 39 53 67 47
Writing stories 41 27 48 46 28 54
Typing letters 39 33 41 41 32 45
Using educational 23 16 26 31 22 35 CD-ROMs
Using the Internet 20 4 27 34 8 45
The hierarchy of activities across the two years was similar, although in each case the proportion of children mentioning the activity was higher than in 2001. Internet use, in particular, was more widespread. Although much more prevalent in Key Stage 2, Internet use increased at both key stages.
As in 2001, drawing pictures and playing games were more widespread among children in Key Stage 1 than those in Key Stage 2, whilst writing stories, typing letters and using educational CD- ROMs were more widespread among the older group. The profile of activities carried out by boys and girls was similar.
Young people in Key Stage 3 and above were asked a similar question. Figure 6.6 shows the main activities mentioned in 2001 and 2002, with results for 2002 broken down by key stage. In the 2002 survey, a category “creative writing/essays” was added.
The pattern of responses in the two surveys was again broadly similar.
Post-16s and students in Key Stage 4 undertook a wider range of computer activities than those in Key Stage 3. The latter were most likely to play games on a computer at school, but less likely than older students to mention most other activities. Post-16s and those in Key Stage 4 had a similar profile of computer use, although the former were more likely to write reports and use e-mail, the latter to do creative writing and play games. Activities undertaken by boys and girls were largely similar, although boys were somewhat more likely than
girls to write reports (54% and 48%), analyse data (40% and 34%) and play games (23% and 16%).
Activities varied to some extent by social grade, particularly between those from AB and DE households. In particular, students from AB households were more likely than those in DE households to use computers at school for analysing data (44% and 30%); accessing general information through databases and CD- ROMs (48% and 36%); using e-mail (25% and 14%); and using the Internet (64% and 51%).
6.4 Software packages used at school
In the 2001 survey, post-16s who used computers at school were asked what type of software packages they used. In the 2002 survey, this question was asked of all those in Key Stage 3 and above. In addition, proprietary packages were given as examples in some cases in 2002, but not in 2001. For this reason, results are not compared with those from 2001.
Figure 6.7 shows responses given by at least 10% of respondents, broken down by key stage.
Word processing packages were the most frequently mentioned, followed by spreadsheet, database and graphics packages. Those in Key Stage 4 used the widest range of packages. This finding is not surprising, given that post-16s specialise in a relatively small range of subjects. Students in Key Stage 3 were much more likely than older students to say that they did not know
which types of package they used. 21
[image:23.595.58.285.410.608.2]Activities undertaken on the computer at school – Key Stage 3+: 2002 vs. 2001
Figure 6.6 Total 2002
2001 2002 KS3 KS4 Post-16
Base: All children in KS3+ who use 821 919 430 266 223
a computer at school
% % % % %
Schoolwork: writing reports 60 51 43 55 64 Schoolwork: creative writing/essays n/a 58 54 64 57 Schoolwork: analysing data 34 37 28 47 46
Schoolwork: other 47 40 42 40 36
Using the Internet 49 57 49 63 66
Using databases/CD-ROMs 28 40 34 46 47
Using e-mail 15 20 13 23 31
Playing games 10 20 26 18 8
Note: Answers listed above were those given by 10% of respondents or more
[image:23.595.303.524.464.678.2]Software packages used at school – by key stage
Figure 6.7 Total KS3 KS4 Post-16
Base: All children in Key Stage 3+ 826 378 243 205
use computers at school for school/college work
% % % %
Word processing 75 65 83 87
Spreadsheets 61 49 79 62
Database 44 32 56 52
Graphics/simulation packages 39 34 46 37
Desktop publishing 26 19 38 24
Design & technology packages 26 24 30 23 Subject-specific software 22 20 26 20
E-mail 16 13 19 19
Multimedia tools 17 13 21 21
Don’t know 10 17 5 3