SDR 76/2012 22nd May 2012
Schools in Wales: Examination Performance 2011
Schools in Wales: Examination Performance 2011 is published today. This provides a detailed analysis
of last year’s Key Stage assessments and GCSE/A level results. Much of the information has already
been published in previous statistical volumes. This release brings the information together as a
comprehensive summary of examination performance in Wales.
The hard copy of the publication is no longer produced, however all data continues to be available as
EXCEL spreadsheets on our website. This Statistical First Release presents a selection of that
information.
Key Stages 1, 2 and 3
The percentage of pupils achieving at least the expected level in 2011 was higher than in 2010 at each
Key Stage and in all subjects.
GCSE and Vocational Equivalent
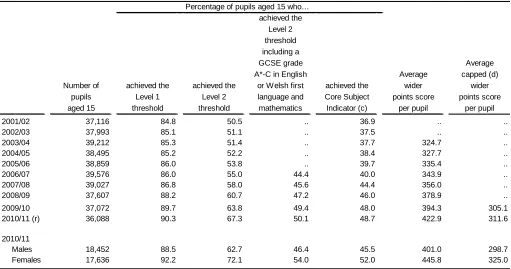
50 per cent of pupils aged 15 achieved the level 2 threshold including a GCSE grade A*-C in English
or Welsh first language and mathematics in 2011, 1 percentage point higher than in 2010. 54 per cent
of girls and 46 per cent of boys achieved this level.
60 per cent of entries in GCSE Mathematics achieved grade A*-C. For English Language the
percentage was 63 per cent and for Welsh (First Language) it was 73 per cent.
A Level and Vocational Equivalent
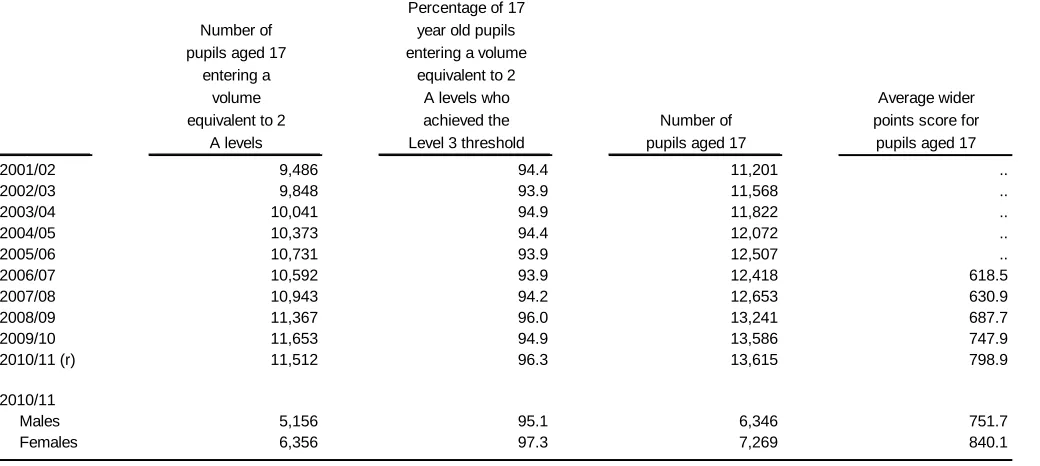
11,512 17-year-old pupils entered a volume equivalent to 2 A levels in 2011, a decrease of 141
compared with 2010.
The most popular subject at A level for candidates of all ages in 2011 was Mathematics, with 3,039
entries.
Statistician:
Jenny
Humphreys
Tel:
029 2082 5514
E-mail:
Next update:
May 2013 (provisional)
Chart 1: Percentage of pupils achieving the Core Subject Indicator at each Key Stage,
1999-2011
0 10 20 30 40 50 60 70 80 90 100
'99 '00 '01 '02 '03 '04 '05 '06 '07 '08 '09 '10 '11
KS1
KS2
KS3
The Core Subject Indicator
(CSI) represents the
percentage of pupils
achieving the expected
level or above in English
or Welsh (first language),
mathematics and science
in combination.
[image:2.595.49.557.398.605.2]There has been a steady
increase in the percentage
of pupils achieving the
CSI since 1999 at all key
stages.
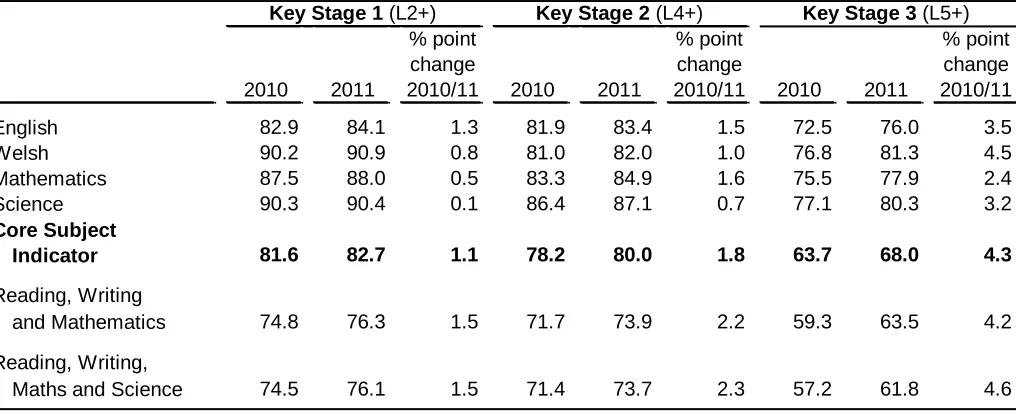
Table 1: Key Stages 1, 2 and 3 summary
Percentage of pupils achieving at least the expected level
Key Stage 1
(L2+)
Key Stage 2
(L4+)
Key Stage 3
(L5+)
% point
% point
% point
change
change
change
2010
2011
2010/11
2010
2011
2010/11
2010
2011
2010/11
English
82.9
84.1
1.3
81.9
83.4
1.5
72.5
76.0
3.5
Welsh
90.2
90.9
0.8
81.0
82.0
1.0
76.8
81.3
4.5
Mathematics
87.5
88.0
0.5
83.3
84.9
1.6
75.5
77.9
2.4
Science
90.3
90.4
0.1
86.4
87.1
0.7
77.1
80.3
3.2
Core Subject
Indicator
81.6
82.7
1.1
78.2
80.0
1.8
63.7
68.0
4.3
Reading, Writing
and Mathematics
74.8
76.3
1.5
71.7
73.9
2.2
59.3
63.5
4.2
Reading, Writing,
Chart 2: Key Stage 3 non-core teacher assessment results, 2007–2011
0 10 20 30 40 50 60 70 80 90 100
Art and Design
Design & Technology
Geography History ICT Modern
Foreign Language
Music Physical
Education
Welsh 2nd Language
'07 '08 '09 '10 '11
[image:3.595.40.562.451.720.2]On average, the percentage of pupils achieving the expected level in non-core subjects in 2011 was 3.5
percentage points higher than 2010. Between 2009 and 2010, the average increase was 2.9 percentage
points, while it was only 0.8 percentage points between 2008 and 2009.
Table 2: Key Stage 3 non-core teacher assessment results by gender, 2007–2011
Design Modern
Art and and Foreign Physical Welsh 2nd
Design Technology Geography History ICT Language Music Education Language
Boys:
2007 66.5 68.1 65.4 65.2 67.6 49.1 63.8 72.6 40.9
2008 66.3 68.0 66.9 65.7 71.4 53.0 63.8 72.1 44.3
2009 66.3 68.4 67.1 66.3 72.5 55.0 65.8 72.1 46.4
2010 70.3 70.7 69.1 68.8 75.8 58.6 70.3 73.4 50.1
2011 74.2 74.6 72.8 72.4 78.4 62.4 74.7 77.4 55.2
Girls:
2007 84.4 82.2 75.7 77.5 77.5 67.5 79.5 70.4 61.0
2008 84.6 82.4 77.1 78.1 81.6 70.4 79.3 71.8 64.3
2009 85.1 82.8 76.9 78.1 82.7 72.6 80.7 71.7 66.1
2010 88.0 86.0 79.7 80.3 85.7 75.8 84.0 74.3 69.3
2011 90.7 88.5 82.9 83.4 88.1 78.9 86.4 78.6 74.9
Pupils:
2007 75.3 75.0 70.4 71.2 72.4 58.1 71.5 71.5 50.6
2008 75.3 75.1 71.9 71.8 76.4 61.6 71.5 72.0 54.1
2009 75.5 75.4 71.9 72.1 77.5 63.6 73.1 71.9 56.0
2010 78.9 78.1 74.2 74.4 80.6 67.0 77.0 73.9 59.4
Chart 3: Percentage of pupils aged 15 who achieved the Level 2 threshold including
English or Welsh first language and mathematics (a)
0 10 20 30 40 50 60 70 80 90 100
2007 2008 2009 2010 2011
P er cen tag e ach ievi n g t h e L evel 2 t h resh o ld i n cl Englis h/We ls h a nd m a ths
Pupils Males Females
The percentage of pupils
achieving the Level 2
threshold including
English or Welsh first
language and mathematics
has increased every year
since 2007.
[image:4.595.43.554.386.655.2]The gender gap has
remained at around 8
percentage points
throughout this time.
Table 3: Pupils aged 15 at the start of the academic year (a) (b)
achieved the Level 2 threshold including a
GCSE grade Average
A*-C in English Average capped (d)
Number of achieved the achieved the or Welsh first achieved the wider wider
pupils Level 1 Level 2 language and Core Subject points score points score
aged 15 threshold threshold mathematics Indicator (c) per pupil per pupil
2001/02 37,116 84.8 50.5 .. 36.9 .. ..
2002/03 37,993 85.1 51.1 .. 37.5 .. ..
2003/04 39,212 85.3 51.4 .. 37.7 324.7 ..
2004/05 38,495 85.2 52.2 .. 38.4 327.7 ..
2005/06 38,859 86.0 53.8 .. 39.7 335.4 ..
2006/07 39,576 86.0 55.0 44.4 40.0 343.9 ..
2007/08 39,027 86.8 58.0 45.6 44.4 356.0 ..
2008/09 37,607 88.2 60.7 47.2 46.0 378.9 ..
2009/10 37,072 89.7 63.8 49.4 48.0 394.3 305.1
2010/11 (r) 36,088 90.3 67.3 50.1 48.7 422.9 311.6
2010/11
Males 18,452 88.5 62.7 46.4 45.5 401.0 298.7
Females 17,636 92.2 72.1 54.0 52.0 445.8 325.0
(a) Up to 2005/06, includes GCSEs, GCSE Short Course, GNVQs and NVQs. From 2006/07, includes all qualifications approved for pre-16 use in Wales.
(b) Ages at the start of the academic year. Includes results for 15 year old pupils, in maintained schools and independent schools, achieved during the academic year and any examinations taken at earlier age.
(c) Core Subject Indicator: achieved GCSE grade A*-C in each of English or Welsh first language, mathematics and science. (d) Average capped wider point scores are calculated using the best 8 results.
Table 4: Pupils aged 17 at the start of the academic year (a) (b)
Percentage of 17
Number of year old pupils
pupils aged 17 entering a volume
entering a equivalent to 2
volume A levels who Average wider
equivalent to 2 achieved the Number of points score for
A levels Level 3 threshold pupils aged 17 pupils aged 17
2001/02 9,486 94.4 11,201 ..
2002/03 9,848 93.9 11,568 ..
2003/04 10,041 94.9 11,822 ..
2004/05 10,373 94.4 12,072 ..
2005/06 10,731 93.9 12,507 ..
2006/07 10,592 93.9 12,418 618.5
2007/08 10,943 94.2 12,653 630.9
2008/09 11,367 96.0 13,241 687.7
2009/10 11,653 94.9 13,586 747.9
2010/11 (r) 11,512 96.3 13,615 798.9
2010/11
Males 5,156 95.1 6,346 751.7
Females 6,356 97.3 7,269 840.1
(a) Up to 2005/06, includes A levels, AS levels and Advanced Vocational Certificates of Education (AVCE). From 2006/07, includes all qualifications approved for use in Wales.
(b) Includes independent schools, but excludes further education institutions.
Accessing the data electronically
The data behind the chart and tables in this release can be found on StatsWales (a free-to-use internet
service that allows visitors to view, manipulate, create and download tables). Please select “Schools and
Teachers” at the navigation screen of the following site:
www.statswales.wales.gov.uk
Key Quality Information
For quality information relating to Key Stages 1, 2 and 3 please refer to the following Statistical Releases:
National Curriculum Teacher Assessments of the Core Subjects, 2011
National Curriculum Teacher Assessments of the Non-core Subjects, 2011
For quality information relating to GCSE and A level results please refer to the following Statistical