SDR 32/2012 29 February 2012
Wales Children in Need Census, 2011
This Statistical First Release presents information on the results of the Children in Need (CIN) census in Wales. The purpose of the CIN census is to collect data that measures the characteristics and attributes of children in need and their parents. For this data collection, children in need are defined as those who receive social services from their local authorities, including children looked after by local authorities, and who had a case open for at least 3 months at the census date of 31 March 2011. The release
summarises the results for Wales. Further data including more local authority information is provided online in StatsWales .
The census has focussed particularly on data about the reason that children receive help from social services departments; parenting capacity (factors related to the parents that might affect their ability to parent); and the health and education outcomes for each child.
The statistics are published as experimental statistics as they are still being evaluated and remain subject to further testing in terms of their volatility and ability to meet customer needs. We want to engage with users of our statistics and we invite you to send your comments on the publication to
stats.pss@wales.gsi.gov.uk.
Key results:
There were 19,655 children in need included in the CIN census at 31 March 2011, which was a rate of 315 per 10,000 children aged under 18 years, and 55 who were unborn.
•
•
• •
•
More than a third (36 per cent) of referrals were from local authority departments and a further 28 per cent from the police and primary or community health services.
A quarter (25 per cent) of children in need had a disability.
Parental substance or alcohol misuse and domestic abuse were the most frequently recorded parenting capacity factors.
The attainment of children in need at each Key Stage assessment was much lower than the average for all pupils.
Statistician: Robin Jones Tel: 029 2082 3625 E-mail: stats.pss@wales.gsi.gov.uk
Next update: February 2013
Table of Contents
Section 1 – Numbers of children in need included in the CIN census... 3
Section 2 – Referrals of children in need ... 5
Section 3 – Primary Need ... 7
Section 4 – Parenting Capacity... 9
Section 5 – Health of children in need ... 11
Section 6 – Disabilities of children in need... 14
Section 7 – Education of Children in Need... 18
Key Quality Information... 24
Annex 1 – Glossary... 28
Section 1 – Numbers of children in need included in the CIN census
Table 1: Children in need by age and whether they were on the Child Protection Register (CPR) or looked after, at 31 March 2011 1
All children in need in the CIN
census
Children who were on the C PR
Children who were looked
after 2
Other children in need 3
Total children in need 19,710 2,225 5,410 12,075
Percentage 100 11 27 61
Numbers
Unborn 55 . . 55
Under 1 year 780 210 245 325
1 - 4 years 4,040 760 1,100 2,185
5 - 9 years 4,690 605 1,150 2,935
10 - 15 years 6,630 595 2,100 3,935
16 - 17 years 2,220 55 785 1,380
18 - 20 years 1,145 * 30 1,110
21 years + 150 * * 150
Percentage
Total children in need (excluding
unborn children) 100 100 100 100
Under 1 year 4 9 5
1 - 4 years 21 34 20 18
5 - 9 years 24 27 21 24
10 - 15 years 34 27 39 33
16 - 17 years 11 2 15 11
18 - 20 years 6 * 1
21 years + 1 * *
3
9 1
Source: 2011 CIN Census
1
All the figures have been rounded and there may be discrepancy between the sum of the constituent items and the total 2
Includes 265 children in the CIN census who were looked after and on the CPR 3
Children in need who were either unborn, or not looked after and not on the CPR . Not applicable
* The data item is disclosive for publication
The numbers of children in need include only those children whose case had been open for 3 months or more at the census date of 31 March 2011. For information on the total numbers of children looked after and on the Child Protection Register, see the social services theme pages.
There were 55 children in need who were unborn. A quarter of children in need were aged under 5 years old, a further quarter were aged 5-9 years old and over a third were aged 10-15 years. The remaining 18 per cent of children in need were aged 16 years or older.
7,635 children in need (39 per cent) were either on the CPR (11 per cent) or looked after by a local authority (27 per cent). Children in need who were on the CPR were generally younger than other children in need, with 44 per cent aged under 5. Only 2 per cent of children on the CPR were aged 16 years or older.
Almost two-fifths (39 per cent) of children in need who were looked after were aged 10-15 years old. 265 (1 per cent) of the children in need in the CIN census were both looked after and on the CPR.
Section 2 – Referrals of children in need
Local authorities receive referrals, i.e. requests for services, for children from many sources as shown in Chart 1. Children will be assessed and a case may be opened as a result. For each child in the CIN census information was collected about the referral that led to the child’s case being open at the CIN census date, ie the most recent referral. Referral information collected in the CIN census included the source of the referral, whether the child had previously been looked after or on the Child Protection Register (CPR) and parenting capacity factors recorded at referral.
Chart 1: Source of most recent referrals of children included in the CIN census, at 31 March 2011
3,905 3,170 2,820 2,730 2,210 1,490 1,175
220 210 170 145
1,460 0 500 1,000 1,500 2,000 2,500 3,000 3,500 4,000 Loc al aut hor ity 's ow n s oc ial se rv ic e s depar tm ent O ther depar tm ent s of ow n or ot her LA Po lic e Pr im a ry heal th/ C om m un it y heal th F a m ily , fr ie nd o r nei ghbou r O ther agen c y S ec ondar y heal th O ther i nd iv idu al S e lf r efe rr a l LA H ous ing depar tm ent or hous ing a sso c ia tio n C ent ral gov er nm ent ag enc y Indepe ndent pr ov ider agen c y
Number of children in need
Source: 2011 CIN Census
Local authorities classified the sources of referrals into the twelve categories shown in Chart 1 (See Glossary for examples). Five of these categories accounted for three-quarters of all referrals. More than one-third (36 per cent) of all referrals were from the local authority’s own social services department or another department of their own or another local authority. Referrals from the local authority’s social services department accounted for the largest number with a fifth of all referrals, followed by other local authority departments (16 per cent), the police (14 per cent) and health organisations (14 per cent). Referrals from friends and family represented 11 per cent of the total.
Table 2: Source of most recent referral and factors recorded for the referral, at 31 March 2011
All sources of referral
Primary health / Community
health
Police Family, friend or neighbour
Local authority's own social services department
Other departments
of own or other LA
Other 1
Source of most recent referral 19,710 2,730 2,820 2,210 3,905 3,170 4,870
Percentage 100 14 14 11 20 16
Numbers of children where the
25
following factors were present
On CPR 12 months prior to referral 1,210 80 190 70 425 185 260
LAC 12 months prior to referral 1,030 60 170 65 340 150 240
Parental Substance Misuse 3,975 450 845 355 915 545 865
Parental Learning Disabilities 1,070 150 140 85 280 155 260
Parental Mental ill health 3,020 505 475 325 635 420 660
Parental Physical ill health 1,435 200 160 190 300 235 350
Domestic Abuse 3,935 420 1,055 310 835 535 780
Percentage of children where the following factors were present
On CPR 12 months prior to referral 6 3 7 3 11 6
LAC 12 months prior to referral 5 2 6 3 9 5
Parental Substance Misuse 20 17 30 16 23 17 18
Parental Learning Disabilities 5 5 5 4 7 5
Parental Mental ill health 15 19 17 15 16 13 14
Parental Physical ill health 7 7 6 9 8 7
Domestic Abuse 20 15 37 14 21 17 16
5 5
5
7
Source: 2011 CIN Census
1
The other category includes: other agency, other individual, secondary health (eg hospital clinic), self referral, central government agency, independent provider agency (eg day care provider), local authority housing department or housing association
8,455 (43 per cent) of children in need had one or more factors recorded at referral. Amongst the factors present at referral, domestic abuse and parental substance or alcohol misuse appeared most frequently and were each present in a fifth of all referrals. Parental mental ill health was the third most frequent factor and was recorded in 15 per cent of all referrals. There were differences in these proportions depending on the source of the referral.
Section 3 – Primary Need
When a child is assessed to be in need, their primary need is identified, usually at the initial assessment. Primary need is the main reason why a child started to receive social services from the local authority. A full description of the primary need categories can be found in the Guidance notes for the completion of Children in Need Census, 2011 (Code List E).
Chart 2 - Primary need of children included in the CIN census, at 31 March 2011
9, 615 48.8%
4,290 21.8% 715 3.6% 1, 460
7.4% 2, 635 13. 4%
45 0.2% 475
2.4% 470
2.4%
Abuse or neglect
Child's disability or illness
Parental disabilit y or illness
Family in acute stress
Family dysfunction
Socially unacceptable behaviour
Absent parenting
Other *
Source: 2011 CIN Census
*
Includes low family income and adoption disruption
Almost half of all children (9,615 or 49 per cent) had a need for services due primarily to the risk of, or actual, abuse or neglect.
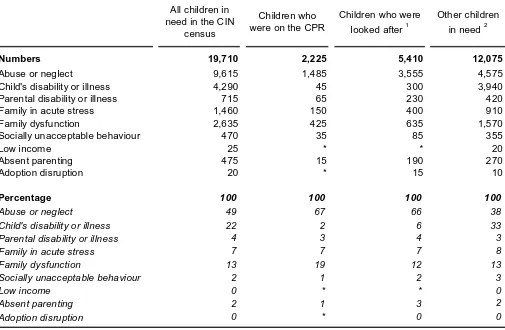
Table 3 - Primary need of children by whether they were on the Child Protection Register or looked after, at 31 March 2011
All children in need in the C IN
census
Children who were on the CPR
Children who were looked after 1
Other children in need 2
Numbers 19,710 2,225 5,410 12,075
Abuse or neglect 9,615 1,485 3,555 4,575
Child's disability or illness 4,290 45 300 3,940
Parental disability or illness 715 65 230 420
Family in acute stress 1,460 150 400 910
Family dysfunction 2,635 425 635 1,570
Socially unacceptable behaviour 470 35 85 355
Low income 25 * * 20
Absent parenting 475 15 190 270
Adoption disruption 20 * 15 10
Percentage 100 100 100 100
Abuse or neglect 49 67 66 38
Child's disability or illness 22 2 6 33
Parental disability or illness 4 3 4
Family in acute stress 7 7 7
Family dysfunction 13 19 12 13
Socially unacceptable behaviour 2 1 2 3
Low income 0 * * 0
Absent parenting 2 1 3
Adoption disruption 0 * 0
3 8
2 0
Source: 2011 CIN Census
1
Includes 265 children in the Census who were looked after and on the CPR 2
Children in need who were either unborn, or not looked after and not on the CPR * The data item is disclosive for publication
The proportion of children who had a need for services due primarily to the risk of, or actual, abuse or neglect was higher for children who were on the Child Protection Register or looked after(67 per cent and 66 per cent respectively). For other children in need, the proportion in need because of abuse was 38 per cent. This was closely followed by need for services due to the child’s disability at 33 per cent.
Section 4 – Parenting Capacity
For each child, information was recorded on five factors related to the parents that might affect their ability to parent. Each factor was recorded if it was present as a relevant factor in the case records at the CIN census date of 31 March 2011. These factors may have been present at referral, as shown in Section 2, or may have arisen since referral. For each child, one or more of these factors may have been recorded at referral and so children may be counted more than once in the chart and tables.
A full description of the five factors can be found in the Guidance notes for the completion of Children in Need Census, 2011 (Section 10).
Chart 3 - Children in need by parenting capacity factor, at 31 March 2011
1,985
1, 410 4,740
5,000
4,220
0 1,000 2,000 3,000 4,000 5,000 6,000
Parental Subst ance/Alcohol Misuse
Domestic Abuse Parent al Mental ill health Parental Physical ill health Parental Learning Disabilities
Source: 2011 CIN Census
For almost half of all children in need (49 per cent) at least one parenting capacity factor was recorded. Chart 3 and Table 4 show the numbers recorded for each parenting factor.
Parental substance misuse was recorded for 26 per cent of the children for whom information was reported (after excluding those for whom this data item was not reported).
Domestic abuse and parental mental ill health were recorded for 24 per cent and 22 per cent respectively of the children for whom information was available.
Table 4 – Parenting capacity factors recorded in the CIN census, at 31 March 2011
Numbers
Parental Substance/Alcohol Misuse 19,455 5,000 14,455
Parental Learning Disabilities 19,400 1,410 17,985
Parental Mental ill health 19,405 4,220 15,185
Parental Physical ill health 19,415 1,985 17,430
Domestic Abuse 19,645 4,740 14,905
Percentage
Parental Substance/Alcohol Misuse 100 26 74
Parental Learning Disabilities 100 7 93
Parental Mental ill health 100 22 78
Parental Physical ill health 100 10 90
Domestic Abuse 100 24 76
Number of children for whom the factor was not present Number of children for
whom information was provided
Number of children for whom the factor
was present
Source: 2011 CIN Census
[image:10.595.53.551.419.646.2]Table 5 provides further information about the children in need for whom a parenting capacity factor was recorded. It shows for each parenting factor the proportions of children who were on the Child Protection Register or looked after.
Table 5 - Children in need by parenting capacity factor and whether they were on the Child Protection Register or looked after, at 31 March 2011
Number of children for whom the factor
was present
C hildren who were on the
CPR
Children who were looked
after 1
Other children in
need 2
Numbers
Parental Substance/Alcohol Misuse 5,000 1,010 1,885 2,100
Parental Learning Disabilities 1,410 180 645 585
Parental Mental ill health 4,220 665 1,470 2,090
Parental Physical ill health 1,985 305 590 1,090
Domestic Abuse 4,740 1,075 1,535 2,135
Percentage
Parental Substance/Alcohol Misuse 100 20 38 42
Parental Learning Disabilities 100 13 46 42
Parental Mental ill health 100 16 35 49
Parental Physical ill health 100 15 30 55
Domestic Abuse 100 23 32 45
Source: 2011 CIN Census
1
Includes 265 children in the CIN census who were looked after and on the CPR 2
Children in need who were either unborn, or not looked after and not on the CPR
For 7 per cent (1,410) of children in need for whom information was available, parental learning
Section 5 – Health of children in need
For each child information was collected on mental health and substance misuse problems and also on how up to date children in the relevant age groups were with health surveillance checks, dental checks and immunisations.
[image:11.595.46.553.216.520.2]Further descriptions of these child health indicators can be found in the Guidance notes for the completion of Children in Need Census, 2011 (Section 8).
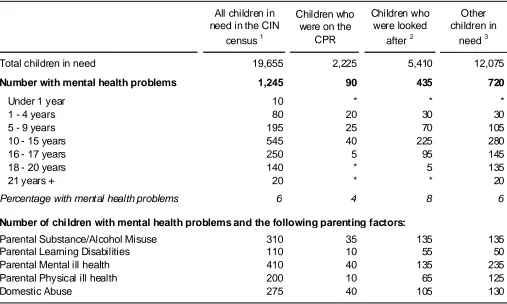
Table 6 - Children in need with mental health problems, by age, whether they were on the Child Protection Register or looked after and parenting capacity factors, at 31 March 2011
All children in need in the CIN
census 1
Children who were on the
CPR
Children who were looked
after 2
Other children in
need 3
Total children in need 19,655 2,225 5,410 12,075
Number with mental health problems 1,245 90 435 720
Under 1 year 10 * * *
1 - 4 years 80 20 30 30
5 - 9 years 195 25 70 105
10 - 15 years 545 40 225 280
16 - 17 years 250 5 95 145
18 - 20 years 140 * 5 135
21 years + 20 * * 20
Percentage with mental health problems 6 4 8 6
Number of children with mental health problems and the following parenting factors:
Parental Substance/Alcohol Misuse 310 35 135 135
Parental Learning Disabilities 110 10 55 50
Parental Mental ill health 410 40 135 235
Parental Physical ill health 200 10 65 125
Domestic Abuse 275 40 105 130
Source: 2011 CIN Census
1 Excludes 55 unborn children
2 Includes 265 children in the Census who were looked after and on the CPR 3
Children in need who were not looked after and not on the CPR . Not applicable
* The data item is disclosive for publication
Amongst the 19,655 children in need, six per cent (1,245) had mental health problems. Children in their adolescent and young adult years (over 10 years old) accounted for over three quarters (77 per cent) of children in need with a mental health problem.
For 410 (33 per cent) of children in need with a mental health problem, a parental mental health problem was also recorded. This was greater than the 22 per cent average for all children in the CIN census (see Table 4).
Table 7 - Children in need with substance misuse problems, by age, whether they were on the Child Protection Register or looked after and parenting capacity factors, at 31 March 2011
All children in need in the CIN
census 1
Children who were on the
CPR
Children who were looked after 2
Other children in need 3
Total children in need 19,655 2,225 5,410 12,075
Number with substance misuse problems
960 115 290 555
Under 1 year 30 10 5 10
1 - 4 years 105 25 40 40
5 - 9 years 110 15 40 60
10 - 15 years 320 45 115 160
16 - 17 years 220 15 90 120
18 - 20 years 155 * 5 150
21 years + 15 * * 15
Percentage with substance misuse problems
5 5 5
Number of children with substance misuse
5
problems and the following parenting factors:
Parental Substance/Alcohol Misuse 450 75 155 215
Parental Learning Disabilities 65 15 20 30
Parental Mental ill health 275 50 90 135
Parental Physical ill health 135 25 35 75
Domestic Abuse 340 60 105 170
Source: 2011 CIN Census
1
Excludes 55 unborn children 2
Includes 265 children in the Census who were looked after and on the CPR 3
Children in need who were not looked after and not on the CPR . Not applicable
* The data item is disclosive for publication
Amongst the 19,655 children in need, five per cent (960) had a substance misuse problem recorded at 31 March 2011. For almost half of these children (47 per cent), a parental substance or alcohol misuse problem was also recorded; for 340 (35 per cent) and 275 (29 per cent) respectively, domestic abuse and parental mental health problems were recorded. All of these proportions were higher than the averages for all children in the CIN census (see Table 4).
Information on health surveillance checks, dental checks and immunisation was provided for a varying proportion of the relevant age groups of children in the CIN census – from 82 per cent for dental checks to 90 per cent for immunisation. Information about immunisation status was incomplete for eight authorities, while information on dental checks and health surveillance was a problem for 10 and 9 authorities respectively.
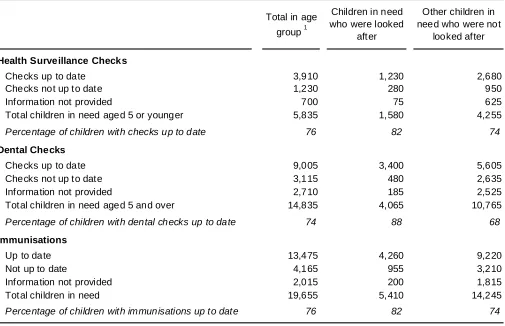
[image:13.595.48.553.211.537.2]Table 8 shows the numbers of children who were up to date with checks and immunisation and those for whom information was not provided.
Table 8 - Children in need whose health surveillance checks were up to date; who had recent dental checks; and whose immunisations were up to date, at 31 March 2011
Total in age
group 1
Children in need who were looked
after
Other children in need who were not
looked after
Health Surveillance Checks
Checks up to date 3,910 1,230 2,680
Checks not up to date 1,230 280 950
Information not provided 700 75 625
Total children in need aged 5 or younger 5,835 1,580 4,255
Percentage of children with checks up to date 76 82 74
Dental Checks
Checks up to date 9,005 3,400 5,605
Checks not up to date 3,115 480 2,635
Information not provided 2,710 185 2,525
Total children in need aged 5 and over 14,835 4,065 10,765
Percentage of children with dental checks up to date 74 88 68
Immunisations
Up to date 13,475 4,260 9,220
Not up to date 4,165 955 3,210
Information not provided 2,015 200 1,815
Total children in need 19,655 5,410 14,245
Percentage of children with immunisations up to date 76 82 74
Source: 2011 CIN Census
1 Excludes 55 unborn children
There were 5,835 children in need aged 5 or younger and information on health checks was provided for 5,140 of these children. The proportion of children looked after who were up to date with health checks was higher than for other children in need.
There were 14,835 children in need aged 5 and over and information on dental checks was provided for 12,120 of these children. The proportion of children looked after who were up to date with dental checks was higher than for other children in need.
Section 6 – Disabilities of children in need
Table 9 - Children with disabilities included in the CIN census who were on the Child Protection Register or were Looked After, at 31 March 2011
All children in need in
the CIN census 1
Children with a
disability 2
Children without a disability
Numbers 19,655 4,980 14,680
On the Child Protection R egister 2,225 150 2,075
Looked After 5,410 765 4,645
Not on the CPR or looked after 12,020 4,065 7,960
Percentage 100 100 100
On the Child Protection R egister 11 3 14
Looked After 28 15 32
Not on the CPR or looked after 61 82 54
Source: 2011 CIN Census
1
Excludes 55 unborn children
2 Includes 125 children where disability was recorded but no disability category was provided
A quarter (4,980) of children in need were recorded as disabled. Most children in need with a disability (82 per cent) were neither on the CPR nor looked after.
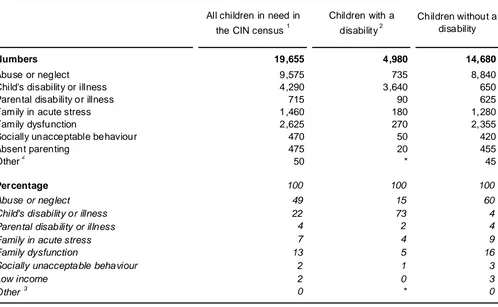
Table 10 - Children in need with disabilities by primary need for services, at 31 March 2011
All children in need in
the CIN census 1
Children with a
disability 2
Children without a disability
Numbers 19,655 4,980 14,680
Abuse or neglect 9,575 735 8,840
Child's disability or illness 4,290 3,640 650
Parental disability or illness 715 90 625
Family in acute stress 1,460 180 1,280
Family dysfunction 2,625 270 2,355
Socially unacceptable behaviour 470 50 420
Absent parenting 475 20 455
Other 2 50 * 45
Percentage 100 100 100
Abuse or neglect 49 15 60
Child's disability or illness 22 73 4
Parental disability or illness 4 2
Family in acute stress 7 4
Family dysfunction 13 5 16
Socially unacceptable behaviour 2 1 3
Low income 2 0 3
Other 3 0 *
4 9
0
Source: 2011 CIN Census
1
Excludes 55 unborn children 2
Almost three-quarters (73 per cent) of children in need with a disability had a primary need for services due to the child’s disability or illness. Only 15 per cent of children in need with a disability had a
primary need recorded as the risk of, or actual abuse or neglect, compared to 60 per cent in this category for children without a disability.
Disability information was recorded using categories corresponding to Disability Discrimination Act guidance (although the DDA has been replaced by the Equality Act 2010, the guidance has not been changed). These categories of disability are:
Mobility
Manual dexterity
Physical co-ordination
Continence
Ability to lift, carry or move everyday objects
Speech, hearing and eye sight
Memory or ability to concentrate, learn or understand
Perception of the risk of physical dangerEach child was recorded under each applicable category and so children may be counted more than once in the charts. There were 4,855 children in need with at least one type of disability and a further 125 children where the child was recorded as disabled, but no disability category was identified.
Chart 4 shows the number of children with multiple disabilities and Chart 5 shows the numbers for each disability separately.
Chart 4: Children in need by number of disabilities recorded, at 31 March 2011 1
1,415
1,005
610
405
375
300 305
440
0 200 400 600 800 1,000 1,200 1,400 1,600
1 disability 2 disabilities 3 disabilities 4 disabilities 5 disabilities 6 disabilities 7 disabilities 8 disabilities
Nu
m
b
e
r
Source: 2011 CIN Census
1
Excludes 55 unborn children
Chart 5: Children in need by disability category, at 31 March 2011 1
2,655
2,440
1,900
1,415
1,305 1,595
1,675 3,210
0 500 1,000 1,500 2,000 2,500 3,000 3,500
Perception of the risk of physical
danger
Memor y or ability to concentrate, learn
or understand
Speech, hearing and eye sight
Physical co-or dination
Mobility Manual dexterity Continence Ability to lift, car ry
or move everyday objects
Nu
m
b
e
r
Source: 2011 CIN Census
1
Excludes 55 unborn children
Lack of perception of the risk of physical danger was recorded for two thirds (3,210) of the 4,855 children in need with a specified disability category whilst a disability with memory or ability to concentrate, learn or understand was recorded for 55 per cent of these children. Each of the separate disability categories was recorded for at least a quarter of children with a specified disability. The lowest
Autistic Spectrum Disorder (ASD)
Information on whether children in need had an Autistic Spectrum Disorder (see Glossary) was collected in the CIN census. Autistic Spectrum Disorders were reported for 9 per cent (1,740) of the 19,655 children in need included in the CIN census.
[image:17.595.62.553.226.430.2]1,040 of these children also had a physical or sensory disability. Over four fifths (82 per cent) of the children in the census recorded as having an ASD were boys, and almost half (49 per cent) of boys and girls recorded with an ASD were aged 10 to 15 years.
Table 11 - Children in need with an Autistic Spectrum Disorder by age and gender, at 31 March 2011
Total children in need 19,655 10,985 8,675
Number of children with autistic spectrum disorder
1,740 1,425 315
Under 1 year * * *
1 - 4 years 100 80 20
5 - 9 years 425 345 75
10 - 15 years 860 720 140
16 - 17 years 290 230 60
18 - 20 years 65 45 20
21 years + 5 5 *
Percentage with autistic spectrum disorder 9 13
Female
4 All children in need in
the CIN census 1 Male
Source: 2011 CIN Census
1
Excludes 55 unborn children
Section 7 – Education of Children in Need
For each child, the Unique Pupil Number (UPN) was collected to allow anonymous matching of children in the relevant age groups with the National Pupil Database (NPD), so that records about free school meals eligibility, attainment and special educational needs could be summarised for children in need without the need to collect this information from local authorities.
Overall there were 11,480 records for children who were already 5 or over at the time of the CIN census, but had not yet reached their 16th birthday at the end of the 2010-11 school year and were therefore of
statutory school age. This is the basis for the majority of statistical analyses on schools as it removes the effect of differing local provision for the under 5s and sixth forms. Using this statutory school age (i.e. 5 to 15 years old) there were 9,900 (86 per cent) children in need whose UPN matched with the education databases. There were 1,580 unmatched records with either no UPN (345) or a UPN that did not match the National Pupil Database (1,235).
A full definition of education terminologies can be found in the Glossary.
Throughout this section of the release pupils' ages are quoted as at 31 August 2010. This refers to the start of the academic year and is a useful reference in that pupils normally transfer from maintained primary to secondary school, and move thereafter through the secondary school system, according to their age on 31 August.
Free School Meals (FSM)
Pupils are entitled to free school meals if their families receive a range of support payments such as Income Support or Income Based Job Seekers Allowance.
[image:18.595.50.553.502.621.2]More than half (59 per cent) of children in need who were not looked after were eligible for free school meals compared to a quarter of children who were in need and looked after.
Table 12 - Children in need by entitlement to Free School Meals and whether or not they were looked after 1
All children in need in the CIN census
Number of pupils entitled to free
school meals
Percentage
Children in the Census matched to NPD (aged 5 to 15) 9,900 4,890 49
Children in need who were not looked after 7,120 4,205 59
Children in need who were looked after 2,785 685 25
All pupils of statutory school age 365,730 72,075 20
Source: 2011 CIN Census and National Pupil Database
1
This refers to the pupils' ages as at 31 August 2010 and includes local authority maintained schools (i.e. nursery, primary, secondary and special) only. Pupils from Independent schools are not included as they are not required to provide the necessary data at pupil level to match to the CIN census.
There were a further 740 children in need outside the statutory school age (out of 1,915 matched records) who were entitled to free school meals.
Special Educational Needs (SEN)
A child has special needs if he or she has learning difficulties which require special educational
provision to be made for him or her. A learning difficulty means that the child has significantly greater difficulty in learning than most children of the same age or that the child has a disability that needs different educational facilities from those that the school generally provides for children. Pupils with SEN may have statements issued by the LA or may have their needs identified by the school. In the latter case they come under one of two further categories: School Action or School Action Plus.
In the School Census Statistical Releases the numbers of children with special education needs are published for all ages at the Wales level.
However, at the local authority level, published in Statswales, the numbers of children with special education needs are published for statutory school age only (5 to 15) to improve comparability between local authorities that may have different levels of provision for non-statutory ages.
[image:19.595.49.553.379.753.2]Table 13 presents the results for all ages and at the compulsory school age, 5 to 15. The latter is the age range for which information for children in need is published in Statswales.
Table 13 - Children in need by special educational provision and whether or not they were looked after, at 31 March 2011
All children in need in the C IN census
Children in need who
were not looked after
Children in need who were looked
after
Pupils on roll in Wales
Children in the Census matched to NPD (all ages)
11,820 8,605 3,215 464,600
Numbers:
No special educational needs 4,050 2,775 1,270 364,825
School Action or School Action Plus 4,045 2,750 1,295 86,380
Statement of Special Educational Needs 3,725 3,075 650 13,395
Percentage:
No special educational needs 34 32 40 79
School Action or School Action Plus 34 32 40 19
Pupils with SEN statements 32 36 20 3
Children in the Census matched to NPD (aged 5 to 15)
9,900 7,120 2,785 365,730
Numbers:
No special educational needs 3,055 2,050 1,005 274,465
School Action or School Action Plus 3,650 2,455 1,195 79,720
Statement of Special Educational Needs 3,200 2,610 590 11,550
Percentage:
No special educational needs 31 29 36 75
School Action or School Action Plus 37 35 43 22
Pupils with SEN statements 32 37 21 3
There were 11, 820 children in need in total whose UPN matched with the education databases, an addition of 1,915 children in need who fell outside the statutory school age compared to the 9,900 matched records for children of statutory school age.
The average proportion of children in need with a Statement of Special Educational Needs was 32 per cent (for all ages and compulsory school age) compared to 3 per cent for pupils in Wales (for all ages and compulsory school age).
Over two-thirds (68 per cent) of children in need of all ages who were not looked after had either a statement of SEN, School Action or School Action Plus, compared to three-fifths (60 per cent) for children in need who were looked after and 21 per cent for all pupils in Wales.
Further information and statistics on special education needs for all pupils can be found in Schools Census, 2011: Final Results Statistical Release and Special Educational Needs Code of Practice for Wales.
Education Attainment at Key Stages 1, 2 and 3
Overall attainment levels are shown in Table 14. These show the numbers of children who were eligible for assessment at the end of each of Key Stages 1 to 3 and who achieved the core subject indicator. A pupil achieves the core subject indicator if they reach the expected level on the national curriculum scale in Maths, Science and either English or Welsh first language. The expected levels are level 2 at key stage 1, level 4 at key stage 2 and level 5 at key stage 3.
Key Stages - The National Curriculum is applied to four Key Stages of pupil development. Broadly these are:
Pupils’ ages Year groups
Key Stage 1 5-7 1-2
Key Stage 2 7-11 3-6
Key Stage 3 11-14 7-9
Key Stage 4 14-16 10-11
Table 14 - Children in need achieving the core subject indicator and whether they were looked after, at 31 March 2011
Key Stage 1 Key Stage 2 Key Stage 3
Eligible children in the CIN census 760 860 1,070
Achieved level: number 350 365 230
Achieved level: percentage 46 42 21
Children in need who were not looked after 580 635 725
Achieved level: number 245 255 150
Achieved level: percentage 43 40 21
Children in need who were looked after 180 225 345
Achieved level: number 105 110 75
Achieved level: percentage 57 49 22
All pupils in W ales 30,655 32,515 35,905
Achieved level: number 25,365 26,015 24,415
Achieved level: percentage 83 80 68
Source: 2011 CIN Census and National Pupil Database
Children in need had lower attainment levels than the average for all pupils at each of the Key Stages. Children in need who were looked after achieved slightly higher levels than children in need who were not looked after.
At Key Stage 1 the proportion achieving the core subject indicator (46 per cent) was just over half the proportion for all pupils (83 per cent). The difference in the proportion achieving the core subject indicator was similar at Key Stage 2 and greater at Key Stage 3.
[image:21.595.45.548.519.719.2]Tables 15, 16 and 17 compare the performance of boys and girls at each of Key Stages 1, 2 and 3. Girls performed better than boys at all Key Stages.
Table 15 - Children in need achieving the core subject indicator at Key Stage 1 by gender and whether they were looked after, at 31 March 2011
Key Stage 1 Boys Girls
Eligible children in the CIN census 760 405 355
Achieved level: number 350 165 190
Achieved level: percentage 46 40 53
Children who were not looked after 580 320 260
Achieved level: number 245 120 130
Achieved level: percentage 43 37 49
Children who were looked after 180 85 95
Achieved level: number 105 45 60
Achieved level: percentage 57 52 62
All pupils in W ales 30,655 15,850 14,805
Achieved level: number 25,365 12,485 12,880
Achieved level: percentage 83 79 87
Table 16 - Children in need achieving the core subject indicator at Key Stage 2 by gender and whether they were looked after, at 31 March 2011
Key Stage 2 Boys Girls
Eligible children in the CIN census 860 505 355
Achieved level: number 365 175 185
Achieved level: percentage 42 35 53
Children who were not looked after 635 385 250
Achieved level: number 255 130 125
Achieved level: percentage 40 33 50
Children who were looked after 225 120 105
Achieved level: number 110 50 60
Achieved level: percentage 49 40 59
All pupils in W ales 32,515 16,695 15,820
Achieved level: number 26,015 12,725 13,285
Achieved level: percentage 80 76 84
Source: 2011 CIN Census and National Pupil Database
Table 17 - Children in need achieving the core subject indicator at Key Stage 3 by gender and whether they were looked after, at 31 March 2011
Key Stage 3 Boys Girls
Eligible children in the CIN census 1,070 595 475
Achieved level: number 230 95 135
Achieved level: percentage 21 16 28
Children who were not looked after 725 415 315
Achieved level: number 150 60 90
Achieved level: percentage 21 15 29
Children who were looked after 345 180 160
Achieved level: number 75 35 45
Achieved level: percentage 22 18 27
All pupils in W ales 35,905 18,485 17,415
Achieved level: number 24,415 11,655 12,760
Achieved level: percentage 68 63 73
Source: 2011 CIN Censusand National Pupil Database
[image:22.595.45.550.368.567.2]Attainment at Key Stage 4
At Key Stage 4 attainment is shown using the percentage of pupils aged 15 who achieve the level 2 threshold, and the level 2 threshold including a GCSE grade A* to C in English or Welsh first language and Maths.
Table 18 - Children in need by Key Stage 4 attainment indicators, at 31 March 2011
Level 2 threshold 1
Level 2 threshold including a GCSE grade A* - C in English or Welsh first
language and mathematics
Eligible children in the CIN census 955 955
Achieved level: number 180 90
Achieved level: percentage 19 9
Children who were not looked after 625 625
Achieved level: number 100 55
Achieved level: percentage 16 9
Children who were looked after 335 335
Achieved level: number 75 35
Achieved level: percentage 23 10
All pupils in W ales 36,090 36,090
Achieved level: number 24,285 18,080
Achieved level: percentage 67 50
Source: 2011 CIN Censusand National Pupil Database
1
[image:23.595.46.552.160.384.2]a volume of qualifications at Level 2 equivalent to the volume of 5 GCSEs at grade A*-C
Table 19 - Children in need Key Stage 4 attainment by gender and whether they were looked after, at 31 March 2011
Level 2 threshold including a GCSE grade A* - C in English or Welsh first
language and mathematics
Boys Girls
Eligible children in the CIN ensus 955 495 460
Achieved level: number 90 30 55
Achieved level: percentage 9 6
Children who were not looked after 625 335 290
Achieved level: number 55 25 30
Achieved level: percentage 9 7
Children who were looked after 335 160 170
Achieved level: number 35 5 25
Achieved level: percentage 10 4 15
All pupils in W ales 36,090 18,450 17,635
Achieved level: number 18,080 8,560 9,520
Achieved level: percentage 50 46 54
12
11
Source: 2011 CIN Censusand National Pupil Database
Key Quality Information
1. The Welsh Government has been working with local authorities to collect statistics on children in need in Wales since 2008-09. This is the second Statistical Release on Children in Need in Wales that has been published and we would welcome any feedback you may have. Please email your
comments to stats.pss@wales.gsi.gov.uk.
2. The CIN census is a requirement for all 22 local authorities. An individual return is required for each child in need and local authorities generally derive these data from local authority case recording systems. The definitions and guidance for the CIN census can be accessed at
http://wales.gov.uk/topics/statistics/about/data-collection/social/child/childneed/?lang=en 3. For this collection, local authorities were required to submit data for children whose cases were open
on the census date of 31 March 2011 and had been open for the previous 3 months, i.e. the case was open on or before 1 January 2011 and remained open at 31 March 2011. This requirement means that the total number of children in need included in the CIN census is less than the total number of children in need receiving services. The number of children included in the CIN census, because they had a case open for 3 months, represents about 76 per cent of the total number of children in need on 31 March 2011 recorded in other statistical data collections.
4. The CIN census covers all children receiving support that is financed from children’s social services budgets, including those supported in their families or independently, children on the child
protection register and looked after children. Children in need will have had an initial assessment. Children receiving respite care should be included in the count of children in need.
5. The Equality Act 2010 has replaced much of the Disability Discrimination Acts (DDA) but the guidance is still applicable and covers categories of disability with examples.
http://www.equalityhumanrights.com/uploaded_files/guidance_on_matters_to_be_taken_into_ac count_in_determining_questions_relating_to_the_definition_of_disability.pdf
6. There has been an increase in the information provided by Local Authorities in 2011 compared to 2010. In the 2011 data collection, there was a significant increase for a number of the data items, including children with mental health problems (Table 6) and children with substance misuse (Table 7). 100 per cent coverage was recorded for these items compared with 88 per cent and 87 per cent respectively in 2010.
7. Information about parenting capacity and other information about characteristics of the children, such as a mental health problem, was taken from the social services department records. Whether an issue was recorded or not thus depended on the assessment of the individual social worker
completing the case records and was not derived from other data collections such as medical records. 8. However, educational data in Section 7 was obtained from educational databases by record linkage
using the Unique Pupil Number, age and gender.
Accessing the data electronically
What are the potential uses of these statistics?
10. These statistics will be used in a variety of ways. Some examples of these are:
• advice to Ministers;
• local authority comparisons and benchmarks;
• to inform the social services policy decision-making process in Wales;
• to inform the Care and Social Services Inspectorate Wales;
• to assist in research on children in need.
Who are the key potential users of this data?
11. These statistics will be useful both within and outside the Welsh Government. Some of the key potential users are:
• Ministers and the Members Research Service in the National Assembly for Wales;
• Local authorities;
• The third sector (e.g. charities);
• The Department for Health and Social Services in the Welsh Government;
• Other areas of the Welsh Government;
• The research community;
• Students, academics and universities;
• Individual citizens and private companies.
The statistics may also be useful for other UK governments
• The Northern Ireland Executive’s Department of Health, Social Services and Public Safety
• The Scottish Government’s Education Analytical Services Division
• The Department for Education in England.
12. Local authorities will be able to use the census data in conjunction with other information to analyse and plan their patterns of activity children’s social services and compare their children in need populations with that of other local authorities. A focus on outcomes such as this census provides will enable local authorities to develop a clear picture of the effectiveness of their current social work practice and commissioned services. It may also help them to find the right balance between the services for children in need, and those more intensive services, such as for looked after children. The information on educational and health outcomes should provide further insight into patterns and outcomes of services. This information will be crucial to planning in partnership, to achieve the targets for children and young people set out in the Welsh Government’s Seven Core Aims for Children and Young People.
Symbols and rounding conventions
14. All the figures are rounded to the nearest 5 for confidentiality. Where figures have been rounded there may be an apparent discrepancy between the sum of the constituent items and the total.
The following symbols are used in the tables:
- the data item is not exactly zero, but is less than half the final digit shown. . the data item is not applicable.
.. the data item is not available.
* the data item is disclosive or not sufficiently robust for publication.
National Statistics
15. National Statistics are produced to high professional standards set out in the Code of Practice for Official Statistics. They undergo regular quality assurance reviews to ensure that they meet customer needs. They are produced free from any political interference. These statistics are published as experimental official statistics and do not display the National Statistics logo as they have not been assessed by the United Kingdom Statistics Authority. They are still being evaluated and remain subject to further testing in terms of their volatility and ability to meet customer needs. However, they have been produced using to the same professional standards and are also subject to the Code of Practice.
User Feedback
We want to engage with users of our statistics and we invite you to send your comments on the publication to stats.pss@wales.gsi.gov.uk
Sources of Education information
Key stage 1, 2 and 3 results can be found in National Curriculum Assessments of 7, 11 and 14 Year Olds, 2010 First Release at:
http://wales.gov.uk/topics/statistics/headlines/schools2010/100818/?lang=en
Key stage 4 results can be found in Examination Results, 2009/10 First Release at: http://wales.gov.uk/topics/statistics/headlines/schools2010/1011301/?lang=en
Free school meals and Special education needs information can be found in the Schools Census, 2010: Final Results First Release at:
http://wales.gov.uk/topics/statistics/headlines/schools2010/1006291/?skip=1&lang=en
Related publications
England
Children in Need statistics are produced by the Department for Education. The most recent data, published on 30 November 2011, can be found at the following link:
http://www.education.gov.uk/rsgateway/DB/STR/d001041/index.shtml
Wales
Other Personal Social Services statistical releases are available on the Welsh Government’s Statistics for Wales website:
Contact Information
If you have any comments about this Statistical Release, please contact: Robin Jones
Welsh Government Cathays Park, Cardiff, CF10 3NQ
Telephone: 029 2082 3625
Annex 1 – Glossary
Age of pupils – throughout the education section pupils' ages are quoted as at 31 August. This refers to the start of the academic year and is a useful reference in that pupils normally transfer from maintained primary to secondary school, and move thereafter through the secondary school system, according to their age on 31 August.
Autistic Spectrum Disorder (ASD) - Autistic spectrum disorders (ASD) are a range of related
developmental disorders that begin in childhood and persist throughout adulthood. ASD can cause a wide range of symptoms, which are grouped into three broad categories:
• Problems and difficulties with social interaction, such as a lack of understanding and awareness of other people's emotions and feelings.
• Impaired language and communication skills, such as delayed language development and an inability to start conversations or take part in them properly.
• Unusual patterns of thought and physical behaviour. This includes making repetitive physical movements, such as hand tapping or twisting. The child develops set routines of behaviour, which can upset the child if the routines are broken.
The Children Act 1989 legislates for children in England and Wales – The intention of the legislation is
that children's welfare and developmental needs are met, including the need to be protected from harm. Key principles of the Act reflect aspects of the United Nations Convention on the Rights of the Child (UNCRC); protection from harm, respect for a child's race, culture and ethnicity, parents’ responsibility for bringing up children and the duty to take account of a child’s wishes and feelings in decisions taken that affect them.
Children in Need (CIN): the term 'child in need' has a specific meaning defined by the Children Act 1989, which placed a statutory duty on local authorities to 'safeguard and promote the welfare of children within their area who are in need'. The Act defines a child in need as a child that is unlikely to achieve or maintain, or have the opportunity of achieving or maintaining, a reasonable standard of health or development without the provision of services by a local authority.
Children Looked After (CLA): is the term used to describe any child who is in the care of the local authority or who is provided with accommodation by the local authority social services department for a continuous period of more than 24 hours. This covers children in respect of whom a compulsory care order or other court order has been made. It also refers to children accommodated voluntarily, including under an agreed series of short-term placements which may be called short breaks, family link
placements or respite care.
Child Protection Register (CPR): each local authority maintains a Child Protection Register to provide a record of all children in the area for whom there are unresolved child protection issues and who are currently the subject of an inter-agency protection plan.
Disability Discrimination Act 2005 – The Disability Discrimination Act 2005 defines a disabled person as a person with a “physical or mental impairment which has a substantial and long-term adverse effect on his ability to carry out normal day-to-day activities.” The condition must have lasted or be likely to last at least 12 months in order to be counted as a disability.
Free School Meal Entitlement - Pupils are entitled to free school meals if their families receive Income Support or Income Based Job Seekers Allowance or Support under Part VI of the Immigration and Asylum Act 1999 or the guarantee element of State Pension Credit. They are also eligible if their parents are in receipt of Income Related Employment and Support Allowance (IR). Children who receive Income Support or Income Based Job Seekers Allowance in their own right are also eligible to receive free school meals. Children whose families are in receipt of Child Tax Credit, providing they are not entitled to Working Tax Credit, and have an annual income, as assessed by HM Revenue & Customs that does not exceed £16,190 are also eligible for free school meals.
Further information can be found here:
http://wales.gov.uk/topics/educationandskills/schoolshome/foodanddrink/freeschoolmeals/?lang=en
Initial assessment: is defined as a brief assessment of each child referred to social services with a request for services to be provided. The assessment should address the dimensions of the Assessment
Framework, determining whether the child is in need, the nature of any services required, from where and within what timescales, and whether a further, more detailed core assessment should be
undertaken.
Key Stages – The National Curriculum is applied to 4 key stages of pupil development. Broadly these are:
Pupils’ ages 1 Year groups
Key Stage 1 5-7 1-2
Key Stage 2 7-11 3-6
Key Stage 3 11-14 7-9
Key Stage 4 14-16 10-11
1 This refers to the pupils' ages as at 31 August, start of the academic year.
Local Authority Maintained Schools: Schools maintained by the local authorities. The authorities meet their expenditure partly from council tax and partly from general grants made by the Welsh
Government.
National Pupil Database
Since 2005, the National Pupil Database has brought together pupil level data from the annual school census, national curriculum assessments at key stages 1 to 3, public examinations at key stage 4 and attendance records. Only pupils at LA maintained schools are included. Pupils at independent schools are not required to provide the data at pupil level. .
Pupils with Special Educational Needs (SEN) - A child has special needs if he or she has learning difficulties which requires special educational provision to be made for him or her. A learning difficulty means that the child has significantly greater difficulty in learning than most children of the same age or that the child has a disability that needs different educational facilities from those that the school
generally provides for children. Pupils with SEN may have statements issued by the LA or may have their needs identified by the school. In the latter case they come under one of two further categories: School Action or School Action Plus.
iii. School Action Plus: When the class or subject teacher and the SEN Co-ordinator are provided with advice or support from outside specialists, so that alternative interventions additional or different to those provided for the pupil through School Action can be put in place. The SEN Co-ordinator usually takes the lead although day-to-day provision continues to be the responsibility of the class or subject teacher.
Sources of most recent referrals: There are twelve categories which local authorities classified the sources of most recent referrals. The table (below) provide examples for a number of the categories.
Primary health / Community health E.g. GP, Health Visitor
Secondary health E.g. Accident & Emergency Department Self referral
Family, friend or neighbour
Central government agency E.g. UK Border Agency Local authority’s own social services
department
Independent provider agency E.g. Day care provider LA housing department or housing
association
Other departments of own or other LA
Police
Other agency E.g. Voluntary agency
Other individual E.g. Councillor
Statutory School Age