REALISING OUR POTENTIAL
The UK Workforce: Realising our Potential
A research report prepared by:
Carol Stanfield
with Mike Campbell
and Lesley Giles
Sector Skills Development Agency
Sector Skills Development Agency: Research Series
Foreword
In October 2002 the Department for Education and Skills formally launched Skills for Business, a new UK-wide network of employer-led Sector Skills Councils (SSCs), supported and directed by the Sector Skills Development Agency (SSDA). The purpose of Skills for Business is to bring employers more centre stage in articulating their skill needs and delivering skills-based productivity improvements that can enhance UK competitiveness and the effectiveness of public services. The remit of the SSDA includes establishing and progressing the network of SSCs, supporting the SSCs in the development of their own capacity and providing a range of core services. Additionally the SSDA has responsibility for representing sectors not covered by a SSC and co-ordinating action on cross cutting and generic skills issues.
Research, and developing a sound evidence base, are central to the SSDA and to Skills for Business as a whole. It is crucial in: analysing productivity and skill needs; identifying priorities for action; and improving the evolving policy and skills agenda. It is vital that the SSDA research team works closely with partners
already involved in skills and related research to generally drive up the quality of sectoral labour market analysis in the UK and to develop a more shared
understanding of UK-wide sector priorities.
The SSDA is undertaking a variety of activities to develop the analytical capacity of the network and enhance its evidence base. This involves: developing a substantial programme of new research and evaluation, including international research; synthesizing existing research; developing a common skills and labour market intelligence framework; taking part in partnership research projects across the UK; and setting up an expert panel drawing on the knowledge of leading academics, consultants and researchers in the field of labour market studies. Members of this panel will feed into specific research projects and peer review the outputs; be invited to participate in seminars and consultation events on specific research and policy issues; and will be asked to contribute to an annual research conference.
The SSDA takes the dissemination of research findings seriously. As such it has developed this dedicated research series to publish all research sponsored by the SSDA and results are being made available in both hard copy and
electronically on the SSDA website.
Lesley Giles
Table of Contents
Section 1 – The Challenge………... 1
Section 2 – The UK Population……… 2
Section 3 – Portrait of the UK Workforce………... 4
3.1 – Patterns of employment 6
Section 4 – Future Demands……… 9
Section 5 – Making Better Use of the Whole Workforce………. 11
5.1 – Making Better Use of the Whole Workforce: Employment Status. 11
5.1.1 - Underemployed and Unemployed……… 11
5.1.2 – Economically Inactive……… 12
5.2 – Better Use of the Whole Workforce: Socio Demographic status… 14
5.2.1 – Using the skills and experience of older workers………. 14
5.2.2 – Gender- the feminisation of the workforce………. 16
5.2.3 – Disability – breaking down the barriers to work…………. 18
5.2.4. – Ethnicity – maximising skill use in the labour market….. 19
5.2.5 – Migrants………... 21
5.2.6 – Workforce Heterogeneity……….. 25
1 T
HEC
HALLENGEWe need to make much smarter use of our workforce to enhance the
performance of individuals, firms and the broader economy. It is possible that in the future, the scale and nature of the demand for workers will outweigh the workforce’s ability and capacity to meet these demands, with severe
consequences for employers and the economy. The UK already has one of the highest employment rates in the world. 1.9 million jobs have been created since 1997 and recorded unemployment is at its lowest level for 30 years. There is already full, or even overfull, employment in many parts of the country. The ‘supply’ of labour is diminishing as the population ages. Demand shows no sign of slowing. Further, the characteristics, expectations and experiences of the current workforce will dominate the supply of labour for the next 10 years and beyond as the in-flow of young people to the labour market slows. The following statistics provide some indication of these issues:
x The population is ageing – people aged over 60 now form a larger part of the population than those under 16
x There will be 1.3 million new jobs in the economy by 2012
x 80% of the current workforce will still be in the workforce in 2010.
UK employers face a number of challenges if they are to continue to recruit the skills they need in the future and to ensure they can retain the quantity and quality of the workforce they need to enhance their performance and secure on-going competitive advantage. By understanding the nature of the problem and the issues which need to be addressed in the workforce, employers can prepare for the challenges that lie ahead and ensure that they take the most effective steps to develop and utilise skills in the future, to work smarter and more productively.
This report is one of a series that seeks to explore key labour market and
economic issues from the perspective of the Skills for Business network. One of the key issues the Skills for Business network is concerned with is the supply of high quality skills to the labour market and ensuring that the right skills are in the right place at the right time. In part this is about improving training and learning opportunities and making them more relevant to business, but it is also
concerned with tackling inequalities in the labour market, overcoming barriers to employment and making better use of the existing skills and experience of the UK workforce. This paper focuses on these ‘blockages’ in supply, particularly in the context of UK demographic trends and the ageing workforce.
2 T
HEUK
P
OPULATIONThe total population of the UK on Census Day 2001 was 58.8 million. This represents a growth of 17% since 1951, but this is much smaller than the average EU growth (23%) and in a different league to population growth in the USA (80%) or Australia (133%) over the same period.
The growth has not been uniform across the UK. For example, since 1981, the population has grown by 9% in Northern Ireland, by 5% in England and by 3% in Wales. Scotland has actually experienced a 2% decline in population. There are even greater variations across localities, e.g. Merthyr Tydfil has seen a 7% decline in population, whilst Ceredigion has seen a 23% growth in population (National Statistics, 2003a).
For the first time, people over 60 now form a larger part of the population than children under 16 – 21% compared to 20% (National Statistics, 2003b). It is expected that the annual average growth in population over the next 20 years will be around 0.28%, generating an increase in the population of around 4.3 million between 2001 and 2026. The trend toward an ageing population is also forecast to continue with the mean age projected to rise from 39.1 years in 2001 to 42.4 years by 2025 (National Statistics, 2003b).
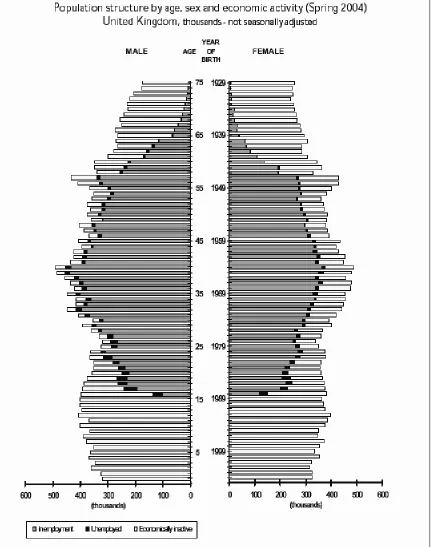
An ageing population has substantial implications for the size and structure of the Workforce and therefore the available supply of labour to employers. The
population pyramid in Figure 1 below shows the proportion of the population who are under 16 and the likely diminishing numbers of people coming through to working age. Such reductions are intensified by increased staying on at school and participation in full time further and higher education. Note too the ‘bulge’ of workers aged around 55 who will leave the workforce in the next 5 to 10 years as well as the already relatively high inactivity rates amongst those aged 55.
Figure 1: Population Structure by age, sex and economic activity (Spring 2004)
3 P
ORTRAIT OF THEUK
W
ORKFORCEThe UK Workforce is commonly described as the population of working age, i.e., all women aged 16 – 59 and men aged 16 - 64. On this basis, in 2001 there were 36.2 million people in the Workforce and this is forecast to rise by just 3.7% to 37.5 million in 2011. The number of adults aged under 45 is projected to fall by nearly 1 million or 4% by 2016, whereas the number of 45-59 year olds is expected to increase by 1.8 million, 15% over the same period (National Statistics, 2003b). This will have major implications for employer recruitment and retention behaviour and practices.
However, this ‘gross’ workforce comprises groups of varying proximity to employment:
x The Economically Active, i.e. those who are working or who are seeking work, specifically:
¾ The employed – those in employment, self employment, working as an unpaid family worker or on a government training scheme;
¾ The ILO unemployed – the International Labour Organisation’s definition of unemployment covers those currently out of work, who want work, have actively sought work in the last 4 weeks and are available to start work in the next fortnight. This is measured through the Labour Force Survey and is not synonymous with the Claimant Count of the unemployed, i.e. those claiming Jobseekers Allowance (JSA). This merely indicates those without work who are eligible for the JSA. In practice the vast bulk are actively seeking work, but some may not be. Moreover, many people are seeking work who are not eligible for JSA.
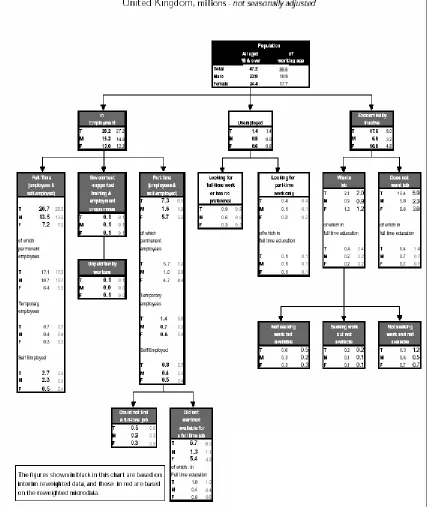
x Economically Inactive – This diverse group covers all other people of working age who are neither employed nor ILO unemployed, including students; early retired; people who are sick or disabled and people who stay at home to look after the home and/or family.
Figure 2: Labour Market Position of people aged 16 and over and of working age (Spring 2004)
Source: Quarterly Labour Force Survey Supplement, July 2004
3.1 Patterns of employment
In Spring 2004, the number of people of working age in employment was 28.3 million (July LFS Quarterly Supplement 2004). This represents an employment rate (i.e. proportion of people of working age in employment) of 74.5%.
The table below shows the structure of those in employment in terms of the work they do and who they are, in 1993 and 2003. The table below includes all people in employment (including those over retirement age) and therefore has a slightly different base to that discussed in the paragraph above.
Table 1: Snapshots of people aged 16 or over in employment
1993 (4 quarter average)
2003 (4 quarter average)
Employment 25,150,000 28,596,000
% Self-employed 12.6% 11.5%
% part-time 23.4% 25.0%
% in temporary jobs 5.5% 5.6%
No. with second jobs 1,077,803 1,174,727 Hours worked per week
(average)
35.08 34.72
Characteristics
Aged 16-24 16.2% 14.4%
Aged 25-34 26.7% 23.4%
Aged 35-49 36.1% 37.8%
Aged 50- 59/64 18.0% 21.4%
Over retirement age 3.0% 3.1%
% male 55.1% 55.0%
% with no qualifications 20.0% 10.9%
% disabled - 12.8%
% manager, professional or associate professional
34.7% 39.8%
% non-white 4.8% 6.2%
Source: Labour Force Survey 2003
Figure 3: Proportions of Working age people by age group; mean age of working age population; United Kingdom; 1975 to 2025.
0 5 10 15 20 25 30 35 40 45 50
1975 198 0
1985 1990 1995 2000 2005 2010 2015 2020 2025 Year Pe r c e n t 0 5 10 15 20 25 30 35 40 45 50 Me a n a g
e Share 15-29
Share 30-49 Share 50-64 Mean age
Source: Office for National Statistics; Government Actuary’s Department (in Dixon, 2003).
The much talked about shift away from full time permanent employment
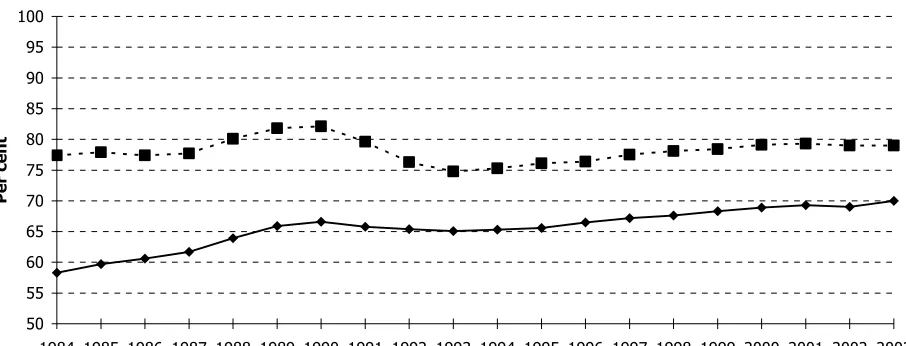
continues, but perhaps at a slower pace than expected, both in terms of part-time and self-employment. The 9% increase in the number of people with second jobs and the shift to part-time work is linked to the ‘feminisation’ of the labour market as demonstrated in the decreasing proportion of the workforce who are male. Though not demonstrated particularly strongly in this table (being a 10 year snapshot), this has been one of the key characteristics of the labour market in the latter half of the 20th century, particularly with regard to the female
Figure 4: Employment rate by gender; UK; 1984 to 2003
Base: All persons of working age
Source: UK LFS Spring Quarters Historical Supplement, 2001; UK Labour Force Survey, Spring 2002 and Spring 2003 in Hibbett and Meager, 2003.
Although the average hours worked has slightly decreased, this is associated with the increase of part time work as full time workers work more hours. One of the key facets of hours worked for this paper is the impact on family life and the perceptions of the quality and convenience of engaging in work. The UK works amongst the longest hours in Europe. Comparisons of working time patterns in the UK, France, Denmark and Sweden show that the UK has much less
standardised hours (i.e., much less concentration of people working around 40 hours per work). Specifically, almost 20% worked 50 hours or more a week in the UK, compared to 10% in France and 5% in Sweden (Bishop, K. 2004). UK workers may work long hours because it is paid as overtime, but more common reasons are to meet pressures or deadlines or because they are expected to do so within their job (Taylor, 2002).
The rapid decline in the proportion of those in employment with no qualifications demonstrates increasing levels of qualifications amongst young people coming into the labour market, as well as the departure from the labour market through the retirement of older, less qualified, workers. But it cannot be entirely
explained by this. The decline also reflects the shrinking proportion of jobs which are available for low or unskilled people and therefore a declining demand, as further demonstrated by the growth in the proportion of jobs which are in the ‘higher’ occupational categories.
We will now consider these trends and implications for the composition of the workforce of the future in the light of likely future employment trends.
50 55 60 65 70 75 80 85 90 95 100
1984 1985 1986 1987 1988 1989 1990 1991 1992 1993 1994 1995 1996 1997 1998 1999 2000 2001 2002 2003
Per cen
t
4 F
UTURE DEMANDSThe trends in supply and demand are forecast to continue, though as supply in terms of the ageing population slows, demand shows no sign of doing so as yet. The Warwick Institute of Employment Research, in a study commissioned by the SSDA, forecasts there will be 1.3 million additional jobs in the UK economy (net gain over loss) between 2002 and 2012. Of which:
x 79% will be taken by women;
x 92% will be part time;
x All of the additional jobs will be in ‘service’ industries.
By 2012:
x 48% of all jobs will be held by women;
x 30% of all jobs will be part-time;
x 11% of employment will be self-employment;
x 45% of jobs will be in the occupations of Managers, Professionals and Associate Professionals.
Driving all these changes are major shifts in the industrial structure of the UK economy. The manufacturing and primary industries have been in decline for decades, taking with them traditional full-time manual work. Employment has grown considerably in the meantime in service sectors. For example, between 1982 and 2002, employment in the Manufacturing sector fell by almost 2 million whilst employment in the Business Services sector increased by over 3 million. However, generally service sector jobs are more likely to be part-time and taken by women, resulting in declining opportunities for men. In 2002, 27% of
employees in Manufacturing were female compared to 47% in Business Services and while 6% of employees in Manufacturing were working part-time, 24% of employees in Business Services were working these hours (Wilson, 2004).
The industrial trends also impact on occupational trends. 4 in 5 new jobs over the next 10 years will be in Managerial, Professional or Associate Professional occupations, indicating an increasing demand for employment which is also skilled, since these occupations demand higher levels of qualification and skill.
However, these changes in the pattern of ‘new’ employment do not take into account the on-going need to replace workers who leave their jobs due to
mobility or retirement, for example. This ‘replacement demand’ is around 5 times greater than ‘expansion demand’. The 1.3 million new jobs are dwarfed by the estimated total 13 and a half million replacement job openings generated in the same period.
x International competition, driving up pressures on costs, changing consumer expectations and the nature of markets;
x Changes in consumer demand/tastes;
x Changes in working practices such as the introduction of call centres and 24 hour shopping which require alternative working patterns
x Organisational restructuring through mergers and acquisitions, out-sourcing and changes in supply chains
x Technological change which is influencing the way goods are produced and services provided, and
x Supply side changes e.g. the role of women and changing family structures.
Scase (2000) illustrates succinctly what these changes mean: ‘More people now work in Indian restaurants than in shipbuilding, steel manufacturing and in coal mining combined. There are currently three times as many public relations consultants as coal miners. This process is likely to continue as Britain becomes a predominantly service and information based economy.’
The past trends and forecasts demonstrate increasing employment and, in particular, skilled employment, though with a continuing need for low paid employment in parts of the economy, a continuing increase in the prevalence of part-time work, increasing diversity in the labour force but ‘stability’ in terms of who is in the Workforce. Alongside these broad structural changes in the labour market has come changes in the notion of a ‘career’, more frequent job moves within a typical career and diminishing notions of a ‘job for life’. For instance, the median length of service for men has fallen by a fifth since 1975. These changes are arguably placing greater pressures on employers to take action to keep their employees skills relevant and to maintain their competitive advantage. Can the workforce fill the 1.3 million new jobs given the ageing population? Is the labour market sufficiently dynamic to fill the total number of vacancies effectively? Can the participation of women in the labour market continue to grow in response to the need for part-time jobs in the service sector? Are there other sources of labour which are not yet being effectively utilised? What do employers need to do to ensure that these challenges are met?
5 M
AKING BETTER USE OF THE WHOLE WORKFORCEThis section will consider underuse of the existing supply of labour. The groups of people we will consider here can be thought of in two, not necessarily mutually exclusive, ways:
x People not currently employed or who are under-employed. We focus here therefore on employment status (that is, unemployed people, economically inactive people and underemployment);
x People who are under-represented in employment in terms of their socio-demographic status (that is, older people, people from ethnic minority backgrounds, disabled people, women and migrants)
.
5.1 Making better use of the whole Workforce - Employment status
There are a number of groups of people not working, or not working to their full potential, who represent a potential supply of labour to help meet the growing demand in the future.
5.1.1 Underemployed and unemployed
The Labour Force Survey measures the number of hours people want to work and the number of hours they actually do work. Workers who want to work more hours are said to be underemployed and those who want to work less,
overemployed. In Autumn 2001, 1.8 million workers were underemployed and 3 million were overemployed. Almost 2% of the total potential hours of work of people already in employment was not utilised. In full-time jobs, 0.7% of the estimated overall volume of labour was not utilised compared to 11% in part time jobs. There is therefore much scope to increase the use of part time workers by encouraging those who want to, to increase their hours of work.
The greatest volume of extra hours wanted was amongst those who worked in elementary occupations and the greatest volume of excess hours worked was amongst managers and senior officials. There are also variations between regions, qualifications and sectors which broadly indicate a skills mismatch, i.e. the skills of underemployed workers are not those in demand (Simic, 2002 in Labour Market Trends). This suggests that there is also a need to adapt or develop the skills of those willing to work more, but whose skills may not be exactly what employers require.
Underemployment can be extended to include unemployment, as all the unused hours of unemployed people can be counted toward available but unused supply. Unsurprisingly, with around 1.5 million unemployed people the volume, in terms of the overall number of hours unused by unemployed people, was 2.5 times higher than those who were underemployed (Simic, 2002). A skills mismatch is probably also a factor here, suggesting that this group may not currently be appropriately skilled for the jobs available. This is further evidenced by the
people have no qualifications compared to 12% of those in employment; 30% of long-term unemployed people had previously been employed in elementary occupations, though just 12% of those in employment are within that
occupational group (LFS, March-May, 2002 in Wilson et al, 2003).
Further, unemployment rates vary across the UK, with London, the fastest growing region, experiencing the highest unemployment rates, 7.1% of those of working age, compared to 3.9% in the South East and the South West and the UK average of 5.1%. Unemployment rates are higher than the UK average in the North East, Yorkshire and Humber, West Midlands, Scotland and Northern
Ireland (National Statistics, 2004b). So, there is a varying extent of potential available labour depending on location.
5.1.2 Economically inactive
As we have seen, economically inactive people represent a larger proportion of the workforce than unemployed people, but in their characteristics and
aspirations they are clearly not a homogenous group. Some of this group are closer to the labour market and are looking for work but are not available to start, as evidenced in Figure 2 (‘Seeking work, but not available’ box). Indeed, Figure 2 suggests that a quarter of people of working age who are economically inactive do want a job. These 2 million people are a huge potential supply of labour if the circumstances could be created to meet their desire to move into work. The New Deal programmes for Lone Parents and Disabled People are examples of major government policies designed to help overcome barriers to work for people who are economically inactive.
Since the late 1970’s, a number of changes have been reported in the
composition of those who are economically inactive and there have been rises amongst:
x People with low levels of qualification;
x People with a disability or health problem;
x Over 50’s
x Lone parents and
x Those in certain areas of disadvantage within the UK.
It is argued that a driving force in these trends is the declining prospects of those with no skills in the labour market, suggesting a skills mismatch (Barham 2002a). The changing industrial structure and employment patterns described earlier are rendering the skills of many groups in the population obsolete. The low levels of qualification held are worse for economically inactive people than for long-term unemployed described above, with almost a third of the economically inactive having no qualifications (LFS, March-May, 2002 in Wilson et al, 2003).
characterised by having high unemployment rates and experiencing high job losses during the industrial restructuring of the 1980’s. Job opportunities are few, at least in the immediate locality, though their ‘connection’ to opportunities in the wider local labour market is important.
They argue that the benefit system and the operation of the employment services in these areas are diverting large numbers of people in poor health into sickness related benefits. In a case study of economic inactivity in Barrow, they found that only 40% of the economically inactive men left their last job because of ill health. Many of those interviewed would like to some sort of work again, consistent with their ability to do so. Using 5 indicators (‘health not main reason for job loss’; ‘would like a full-time job’; ‘able to do some work’; and comparisons to the rate of permanent sickness in the South East in 1991 and a local 1981 benchmark) they estimate that of 3,500 economically inactive men of working age in Barrow, between 2,100 and 2,700 could do some form of work.
This study suggests that the number of economically inactive who may want to work is higher than reported for some groups in some areas and therefore could be a potential source of labour. But the issues of benefit entitlement and being able to find work to suit their skills in a changing world of work, as illustrated by Scase above, remain.
Implications for the Skills for Business Network.
Unemployed, especially those unemployed for a long period of time, and economically inactive people represent a potential source of currently unused labour. However, a number of issues are presented around their skill levels and relevance of skills. We have seen that these groups have lower qualification levels, are geographically concentrated and their skills are not seemingly
required in the current labour market. Underemployment as a whole represents a waste of resource. The New Deal programmes have been successful in moving people into work, though problems remain. The Skills for Business network needs to work with employers to:
x Encourage unemployed and economically inactive people into work through job focussed training and work with Jobcentre Plus to identify opportunities beneficial to both employer and individual;
x Encourage upskilling, retraining and the effective management and
deployment of people in the workplace to prevent employees unnecessarily losing their jobs in a fast changing world. This would ensure the knowledge and culture of working within a sector are not lost or, indeed, that the skills of people are not under-utilised. This will undoubtedly also require
and culture of working, or specifically of working within a sector, are not lost or, indeed, underutilised.
5.2 Making better use of the whole workforce - Socio-demographic status
This section considers the socio-demographic characteristics of people of working age, and their relative experiences of the labour market. There are a number of indicators which demonstrate that certain groups experience disadvantage in the labour market. We will explore this issue to see if they represent a potential source of labour in the people whose qualities may not be fully utilised.
5.2.1 Using the skills and experience of older workers
We have seen that generally, there are less young people in the population, the proportion of people aged under 45 is diminishing and that as a proportion of the labour force, the older age group is growing. Population ageing means that, in the absence of any change in overall labour market participation, the labour force is likely to fall in relative terms, with major consequences for economic growth, public finances and living standards. Across Europe the dependency ratio – i.e. the number of people of working age compared to the population as a whole - is falling. To date, the ageing population has not had such a big impact because the size of the working population has been expanding in parallel. OECD figures show that in the 25 years to 1998 the number of people over the age of 65 rose by 45 million and the potential working population rose by 120 million. But this will change. The OECD predicts that by 2023 the population of pensioners will grow by 70 million with the working age growing by just 5 million.
A crucial factor then is the length of working life and the participation of older workers in work.
Despite the fact that older workers represent a greater proportion of the
workforce, this is not because they are any more likely to participate, it is simply the shift in the age of the population as a whole. In fact, there has been a dramatic decline in participation in the labour market of older people. Labour force participation for men aged 55-59 has decreased from 80% in 1968 to less than 50% in 1999 and from 75% to 30% for men aged 60—64. On the other hand, participation rates for women of this age have remained stable (Blundell). There are two main reasons for inactivity amongst older people – retirement and ill health. 48% of people aged between 50 and retirement age were inactive because of ill health and a further 22% were inactive because of retirement. (Scales and Scase, 2000). The evidence suggests that skills mismatch contributes significantly to older men leaving the labour market.
employment rates of 50-69 year olds could mean that employment growth keeps up with population increases and a 0.35% per annum increase would mean labour market growth could outstrip population increases (Age Concern, 2004)
The same report also considers the training given to older workers and the
benefits which can be derived by employers. Older people are just as likely to be involved in self-initiated, non-work learning as young people (30% across all age groups), but less likely to receive job related training, i.e. initiated by the
employer (30% of 25-49 year olds received training in the previous 13 weeks in 2001, compared to 23% of 50-59 year olds). This suggests that older workers are just as likely to want to train. The report also considers the ‘myth’ that training older workers represents a poor investment. They cite evidence which shows that older workers tend to have longer job tenure and are more likely to stay in a job than young people and claim that the failure to train older workers adds to the problem: they do not receive training to update their skills, therefore they may not have the skills to meet changing skill needs – but they could if given the same opportunities.
In a survey of the top 100 companies listed in the FT Share Index, less than a third recognised the impact of population ageing on their business. This suggests a slow response by employers to the ‘demographic timebomb’ and perhaps reflects the differing views of commentators on the long term trends. Employers are seemingly not adjusting policies in light of the ageing workforce and are continuing to rely on a supply of young people as they have in the past. For example, many of the DfES sponsored Sector Skills Dialogues concluded that they needed to attract more young people into their industry.
Tempest et al (2002) argue that the boundaries of work and retirement should become more blurred. There are many successful examples of this in British retailing where people aged over 50 are actively recruited. But they also argue for the need to move to flexible retirement options, where full retirement is just one option of many. They go onto cite examples of companies in the US who have introduced policies which allow workers to continue working part-time into retirement. These successful examples should encourage employers to look at how they use older workers in their workforce and particularly how they retain older workers who want to extend their working life.
To sum up, the challenges for the Skills for Business Network are:
x Make known the broad population trends and impact on the composition of the workforce and assess and communicate the detailed implications for sectors;
x Engage employers in a discussion about the implications of an ageing population, both within their own workforce and across their sectors;
champions of good practice within sectors and recognising and optimising their work experience;
x Enhance understanding of the need to engage in maintaining and developing skills of the whole workforce in recognition that employers can no longer rely on young people coming into the labour market to meet needs and additional re-training may be required as employees are redeployed and increasingly change careers through their working lives – this means widening learning opportunities, career routes and applying key management practices (e.g. training needs assessments, performance reviews, succession planning etc) to all age groups of staff to ensure skills are sufficiently up-graded;
x Ensure employers are prepared for the introduction of legislation around age discrimination in October 2005. Further information will be released from DTI when developed. See http://www.dti.gov.uk/er/equality/age.htm for further information.
5.2.2 Gender – the feminisation of the workforce
We have seen that an increasing proportion of women are working. It is useful to consider this further to assess the extent to which this remains an area of growth for the labour market and what factors might impact on this.
Employment rates for women are much more closely linked to ‘partnership’ and ‘dependants’ than men. The working age employment rate of partnered (married or co-habiting) women was 73.5% in 2002, 11 percentage points above that of single women, whilst the difference was 20 percentage points for those with children (70% employment rate for partnered women with children compared to 50% for single mothers), though this gap has narrowed in the last 5 years.
The importance of childcare as a ‘constraint’ (through choice or otherwise) is demonstrated by a comparison of the age of dependants and women’s
employment rate. The employment rate for women with pre-school children is 54%, for women with children of primary school age it is 70% and for those with children aged 11-15 it is 76%. Though again, employment rates for women with primary school age children have been rising in the last 5 years (Duffield, 2002).
persistent glass ceiling that prevents many women progressing to more senior and skilled positions.
The lack of recognition of women’s skills is also partially evidenced by pay levels. The gender gap in pay is narrowing, but the gap amongst the highest
occupations seems to be getting worse. In 1986 women’s basic hourly earnings were 74% that of men, by 2003 they were 82% (Bulman, 2003). Analysis of the 2001 New Earnings Survey showed that the largest pay gap was amongst managers and senior administrators where average hourly pay was 72% of equivalent men. The smallest was amongst clerical and secretarial occupations where women earned almost as much as men (98%). (National Statistics, May 2002).
A survey by the ESRC found that women are increasingly dissatisfied with work. 54% were satisfied with work in 1992 compared to 49% in 2000. They were particularly dissatisfied with working hours, especially those women in lower occupations. This suggests they are finding it hard to juggle their responsibilities and may need more help in doing so. There needs to be recognition of both the need to break through the ‘glass ceiling’ and also improving the work-life balance for women on all rungs of the occupational ladder (Taylor, 2002).
A key factor in encouraging greater participation and satisfaction with work will be the adoption of flexible working patterns within stable and secure employment. Survey evidence suggests that around two thirds of prospective women returners would prefer a part-time job. The Warwick Institute for Employment Research report that employers also support the idea of a work-life balance with 62% of employers agreeing that ‘everyone should be able to balance their work and home lives in the way they want’. However, they argue that this is subservient to the immediate needs of the business and thus the work-life balance issue takes second place (IER 2002).
In a recent survey of employers to gauge employment practices, the ESRC revealed a number of issues and challenges. The survey found that over the previous 3 years, 11% had introduced teleworking and 10% had developed a policy to encourage staff to work from home more. Three quarters of employers had no such policy. It is not likely to change much in the future either with just 9% planning to encourage more staff to work from home. In making it easier for women to work, 47% reported that they made working hour arrangements convenient for female employees; however other assistance was not so forthcoming, 48% did not provide maternity pay above basic levels, only 8% provided financial assistance for childcare costs and 3% provided direct childcare provision (Taylor 2002a).
requests, only able to refuse for ‘sound reasons’. The legislation is designed to retain the skills of working parents in the workforce and therefore should be viewed positively by employers in this light.
Women are and will continue to be an important source of labour for employers. But challenges for the Skills for Business Network remain around:
x The employment rate among women with young children and the childcare ‘constraint’;
x Pay, rewards, recognition and utilisation of the skills of women – employers need to review their employment practices to ensure that all workers receive terms and conditions that fairly reward their skills and that their skills are being effectively deployed;
x Opportunities for enhancing women’s satisfaction with employment which has implications for their motivation, commitment and individual performance;
x Breaking through the glass ceiling and striking the work-life balance –
addressing these can bring benefits to both the employer and the employee;
x Ensuring employer awareness of legislation with regard to the employment of women, from the Sex Discrimination Act to the right to request flexible
working patterns through the 2002 Employment Act so that they do not discriminate unfairly against individuals workers. The Equal Opportunities Commission website contains summaries of the implications of all such legislation for employers. See
http://www.eoc.org.uk/EOCeng/dynpages/Relevant_Legislation.asp for further
information.
5.2.3 Disability – breaking down the barriers to work
Around 1 in 5 people of working age, have a disability. In 2002 disabled people had an employment rate of around 48% (a 2.5 percentage point increase over last 4 years) compared to 81% for non-disabled people. Of the 3.4 million
disabled people who were economically inactive, some 32% said they would like to be in paid employment compared to 26% of non-disabled, suggesting a
greater potential proximity to work than usually associated with economically inactive people.
Regan and Stanley (2003) cite a number of other barriers to a disabled person’s employment:
x Employer perceptions and reluctance to take on disabled people;
x Motivation, self-esteem and self-perception of the individual, together with constraints and the need for support imposed by the disability itself;
x Individuals confidence to do and keep the job without aggravating their health problem or inconveniencing the employer;
x The disincentives of the benefit/tax system.
Those who do work are disproportionately more likely to be in manual
occupations and they have lower average earnings than non-disabled people, even after taking account of their age, education and occupation. They are also more likely to lose their job relatively quickly, this despite their better attendance record, length of stay in job and fewer accidents in the workplace. (Regan and Stanley 2003)
Many of the disadvantages faced by disabled people might be avoided with more help for employers and disabled people. 70% of disabled people were in work during the onset of illness or impairment and 1 in 6 lose employment in the first year of their disability. Regan and Stanley (2003) cite evidence to show that British men who become disabled are much more likely to leave work than German or American counterparts, where in the former there is an emphasis on support to retain employment and in the latter there is less support and financial assistance available for disabled people who are out of work. The UK
government is starting to address this issue. From an employer perspective the Disability Discrimination Act expects employers to make ‘reasonable
adjustments’ to accommodate the needs of disabled people; Job Retention and Rehabilitation pilots, run by DfES, have been introduced and represent ‘a tentative acknowledgement of the need for preventive action and early intervention’ (Regan and Stanley 2003).
Key issues for the Skills for Business Network include:
x Working with employers to ensure applicants to jobs are not discriminated against on the grounds of their disability, but rather there is a real
commitment to understanding the nature of the disability and the ability of the individual to work;
x Assisting employers to identify general and personal barriers to work and encourage disabled people to seek employment;
x Encouraging employers to take steps to prevent job loss through the onset of disability and working with key agencies to enable employers to do this;
Discrimination Act which now covers small employers – those with fewer than 15 staff – and other types of employment such as police officers, partnership business partnerships and employees on ships and planes. The Act expects that employers will not discriminate against disabled employees or applicants because of their disability and may have to consider making reasonable adjustments. Further information is available at
http://www.disability.gov.uk/dda/employers/employers.asp
5.2.4 Ethnicity – maximising skill use in the labour market
Though ethnic minorities make up only around 8% of the population, they represent a growing proportion of the workforce and will account for more than half of the growth in the workforce by 2010, particularly within certain local labour markets.
The ethnic minority population in the UK tends to be clustered in the major cities and conurbations; almost half live in Greater London. The vast majority live in England, with just 1.9% in Scotland and 1.2% in Wales. The ethnic minority population is younger than that of GB as a whole. In 1991, the median age of the ethnic minority population was just over 25, 13 years younger than the white ethnic group. The ethnic minority population are better represented by younger people than the white population – around 48% of the ethnic minority population is aged under 24 compared to 30% of the white – and they are expected to account for more than half the growth in the working age population by 2010 (Owen et al). Therefore their educational attainment and engagement in the labour market is crucial, especially in certain geographic areas.
In the year to summer 2002, the employment rate for white people was 76% compared to 57% for Asian or Asian British and 61% for Black or Black British. 5% of white people were unemployed, compared to 9% of Asian or Asian British and 13% of Black or Black British (National Statistics, Sept 2002).
There are particular concentrations of ethnic minorities in employment by
occupation and industry, e.g. around 5% of Indian men are medical practitioners, almost 10 times the national average. One in eight Pakistani people are
employed and self-employed was a taxi driver or chauffeur compared with the national average of 1 in 100 (Strategy Unit, 2003).
Most ethnic groups are less well paid (Blackaby et al 2000 in DTI 2002). The average hourly earnings for white men is £9.03, but this falls to £6.74 for
Pakistani men. Blackaby et al (in DTI 2002) assert that these differences do not arise entirely from differences in personal characteristics or education, but cites evidence which shows that ethnic minorities will see fewer returns in the form of pay, to their education than white.
white, 8% of Black African and 10% of Indian ethnic groups have no
qualifications, compared to 24% of people from Bangladeshi, 19% of Pakistani and 16% of Black Caribbean ethnic groups). Other evidence shows that Black Africans are the best educated group in the labour market, being 10 percentage points more likely to have higher level qualifications than whites, but their
employment rate is 12 percentage points lower (Twomey, in DTI 2002).
As the examples demonstrate it is important to recognise that ‘ethnic minorities’ are not a homogenous group, and this brief overview cannot take into account the disadvantage faced on a number of levels by ethnic minorities, e.g. housing tenure, access to transport. What we can conclude though, is that ethnic
minority groups (taken as a whole) will be an increasing proportion of the labour market; they face continuing disadvantage on all measures; and they often do possess the skills and qualifications required. The conclusion one can draw is that they are a hugely underused ‘supply of labour’.
Thus, the challenges around ensuring better access to the labour market for ethnic minorities are immense. The Government published a strategy to improve the experience of ethnic minority groups in the labour market which will be driven by the setting up of a specific Taskforce. Recommendations include tackling barriers to work and promoting equal opportunities in the workplace.
Information, advice and support services for employers will be expanded upon to help employers look at policies, practices and workplace cultures to assess whether they are discriminatory and to look at ways to develop ethnic minorities and ensure they reach their potential. As well as sharing good practice, there are proposals to improve data management of the Employment Tribunal System to ensure repeat offending is identified and acted upon.
The key roles then for the Skills for Business Network are:
x Work with other agencies to help tackle discrimination in the workforce;
x Increase employer awareness of their legislative requirements (and
increasing responsibilities) and sources of advice and guidance to employers on this. See www.cre.gov.uk/legaladv/legaladv.html for further advice;
x Demonstrate the need to tap into the ‘wasted resource’ of the ethnic minority population. This means paying attention to the lower employment rate of ethnic minority groups, and reviewing their pay, rewards, career routes and deployment in the workplace to ensure their skills are being optimised.
5.2.5 Migrants
migrants can contribute to the growing demand for labour – the 1.3 million new jobs in the next 10 years. But what do we mean by migrants, and given that, what contribution can they make?
Migrants are a diverse group, coming to the UK for a wide range of reasons. The main groups are students, work permit holders, those coming for family
reunification, working holiday makers and asylum seekers (Somerville, 2003). We will briefly consider the different entry routes and experiences of some of these groups.
A detailed study of applicants for National Insurance (NI) numbers in 2000-01 found 150,600 ‘migrant workers’ arriving in the UK and registering for a NI number. Over half originate from the European Union. However, there is little information on what they actually do (Robinson 2002).
European Union enlargement in May of 2004 extended the potential pool of labour to the UK by enabling workers from the new EU countries to come to work in the UK. The Institute for Public Policy Research (2004) forecast that net
annual inflows from the new member nations would peak at 17,000 in the first couple of years after accession (around 3% of total inward migration) and the stock of new member nationals would increase from 50,000 to 180,000 in 2030, after which it would decline. These are not big numbers in the context of UK population trends, and in fact, the latest data has already shown a fall in the numbers coming to the UK to work from the new member nations (Guardian, 8th July 2004), though it is still too early to say whether this is a trend or is a
temporary ‘blip’.
Non UK nationals who come from outside the European Economic Area primarily to work require a Work Permit, the main exceptions being commonwealth
citizens who can enter the UK as ‘working holidaymakers’. There are 4 main elements in the work permits system:
x The main scheme which includes work permits;
x The Highly Skilled Migrant Programme;
x The Seasonal Agricultural Workers Scheme and;
x The Sectors Based Scheme (Clarke and Salt, 2003).
A Work Permit granted under the main scheme is applied for by a specific individual who has a specific job to go to. Almost 90,000 Work Permits were issued in 2002. The sectors people with Work Permits enter represent the
prioritisation of work permits to applicants to work in these sectors due to existing skill shortages. The top 3 sectors in 2002 were health and medical services, computer services and administration and business and managerial services.
a specified job. In the first 18 months, almost 5,000 applications had been received and around 60% accepted. The acceptances were dominated by finance occupations, business managers, ICT and medical occupations.
The Seasonal Agricultural Workers Scheme places people aged between 18 and 25 to work on farms during periods of high demand. The scheme is managed through quotas and in 2003 the quota was 25,000. The majority of people entering the UK for a short time on this scheme are from Poland, the Ukraine or the Baltic states. (Clarke and Salt 2003)
The Sector Based Scheme has also been developed to manage the entry of people to fill lower skilled jobs (below NVQ 3) in two sectors at present – food processing and hotels and catering. 10,000 such permits are available per year. The Scheme was launched in May 2003 and by March 2004, the quota set for the Hospitality industry had been reached. At the end of May 2004, just over 6,000 applications to work in the food processing industry had been successful. The scheme is currently being evaluated to assess its effectiveness in meeting recruitment shortages in lower skilled jobs and may be extended to other sectors.
Thus, migration is being managed in the UK to fill vacancies for both high and low skilled jobs. But it is also important to consider migrants who do not enter the country under these schemes but who enter the UK seeking asylum, and their contribution to the labour market.
In 2000, the number of asylum seekers arriving in the UK was just half that of ‘migrant workers’. Their claim for asylum will result in either a negative decision, temporary permission to stay (Exceptional Leave to Remain, or Humanitarian Protection since April 2003) or the granting of refugee status (around half of all asylum seekers are granted some sort of status) (Somerville 2003). Asylum seekers are unable to work while their claim is processed and there are concerns that many could play a role in helping fill shortages in local labour markets if they were allowed to work. By so doing they would also be able to maintain their own skills. Being unable to work while their claim is processed could impact on ability to work if granted refugee status, as skills will not have been kept up-to-date or made relevant to UK employers.
A study of asylum seekers and refugees in Scotland indicated that they are mostly well qualified and ‘possess a broad range of technical and professional skills which could positively be utilised by the Scottish labour market’. Although very few were employed (English language being a key barrier) those who were employed were in posts not commensurate with their skills (Charlaff et al, 2004)
A study by the Department for Work and Pensions further suggests the scale of the problem which exists amongst refugees. They conducted a study of
refugees were working in September 2001 compared to 60% of ethnic minority people in the general population. Their working terms and conditions were poor, they earned less and were concentrated in particular industries, such as catering and administrative work. Crucially, and in line with the Scottish study, the work they were looking for was often not commensurate with their skills (Bloch, 2003).
Haque (in Kempton, 2002), in a study of those who were defined as ‘foreign born’ in the Labour Force Survey (a useful proxy for migrants) found that they were concentrated at the low and high ends of skill distribution – 19% had degrees compared to 15% of UK born; 19% had no qualifications compared to 16% of UK born. Almost a third had an unrecognised qualification compared to 12% of UK born (many foreign qualifications are not recognised in the UK, leaving migrants to validate their foreign qualifications or unable to prove qualifications – a
problem for people who may have had to flee their homes). Employment
disadvantage runs across all skill levels and foreign born people are less likely to be in employment, even those who were from English speaking backgrounds.
Concerns around migrants ‘taking our jobs’ seem unfounded when we consider the relative scale of migration and the disadvantage faced by refugees in the labour market. In fact the evidence suggests migrants have a positive impact on the economy and could make a much greater contribution to the economy. Somerville and Ognjenovic (2004) cite positive economic benefits of migration as:
x A net contribution of £2.5 billion, no effect on jobs and a positive wage effect (from RDS);
x UK remains competitive in the global market for skilled labour;
x Possible reduction in effects of the ageing population (though not a solution);
x Meeting labour shortages, especially in key sectors;
x An inflow of complementary workers will increase the total economic output, leading to increases in GDP per head;
x More international connections, cementing the UK as a global trade hub.
At the level of individual employers there is also evidence that recruiting refugees can be advantageous to the business. Employers who had recruited refugees, either as employees or in work placements, have cited a number of number of benefits, ranging from the ability to fill vacancies without resorting to expensive agency staff and the calibre of the refugees recruited. This small scale research for the DWP (Hurstfield et al, 2004) also identified some difficulties associated with recruitment of refugees including the requirement to check documentation (complexities, responsibilities and costs associated with this); language
experience, to help meet common needs – especially in localities where there may be a number of refugee communities.
Migration can clearly make a contribution to the pool of labour in the UK and a number of measures under the work permits schemes are in place to tackle particular shortfalls in the UK labour market. A key challenge is around the use of the skills and experience of refugees and asylum seekers in the UK, who could also help meet these shortfalls (particularly as the evidence consistently points to their skills being under-utilised), whilst also allowing them to benefit from
engagement in work and maintaining their skills through doing so.
The challenges for the Skills for Business Network include:
x Tackling discrimination and misconceptions about migrants, their status and characteristics;
x The need to obtain better and more consistent data on migrants, their skills and qualifications and thus match those to current shortages;
x Making better use of the skills of refugees and helping to understand the difficulty in recognising foreign qualifications in the UK workforce;
x Work closely with Work Permits UK to develop schemes and systems appropriate to employer needs (see www.workingintheuk.gov.uk for further information);
x Employers could work with assessors to ensure a ‘fast route’ to qualification accreditation in the UK.
5.2.6 Workforce Heterogeneity
Before moving away from the disadvantage faced by many socio-demographic groups within the Workforce, it is useful to bear in mind that disadvantages can be particularly severe for people who can identify themselves in one or more of these groups. For example, disabled women, ethnic minority women and migrant women all, generally, fare worse than their male counterparts in the types of factors we have discussed. Again, employment rates of white disabled people was 49% in 2001, compared to 36% for disabled people from an ethnic minority background.
Similarly, all the above factors need to consider the characteristics of the local labour market. The UK is not one labour market, but many and various, the population is younger in some areas than others, and some local labour markets are experiencing very considerable growth and tight labour market conditions, others are experiencing decline and slack labour market conditions.
here, but it is imperative that the Skills for Business network is mindful of these differences and that advice to employers is consistent with the area in which they operate.
6 S
UMMARY ANDC
ONCLUSIONSIn seeking to ensure that the UK has a world beating workforce in the future, and that skills can make a difference to the performance of individuals and firms, a number of complex and difficult challenges are presented to employers. The demographic changes combined with the current under-utilisation of potential labour sources suggest that demand for skills and labour could outweigh supply unless many of these issues are tackled, and that the skills of those in
employment are not being fully exploited, with the result that this might hinder the broader economic performance of firms and the economy. Widening
participation in the labour market; engaging disadvantaged groups in work and utilising their skills; tackling barriers to participation and upskilling, maintaining and utilising more effectively the skills of the existing workforce are key facets of ensuring the UK has a world beating workforce and secures higher performance.
This report has considered different groups within the labour market and the difficulties and disadvantages they face and has identified a number of challenges and roles for the Skills for Business network if it is to ensure that employers fully exploit the skills of the available workers and develop and use their skills more effectively. With regard to those not currently in work, or working less than they would like to (underemployed, unemployed and economically inactive people), the key activities identified for the network were to:
x Encourage unemployed and economically inactive people into work through job focussed training and work with Jobcentre Plus to identify opportunities beneficial to both employer and individual;
x Encourage upskilling, retraining and the effective management and
deployment of people in the workplace to prevent employees unnecessarily losing their jobs in a fast changing world. This would ensure the knowledge and culture of working within a sector are not lost or, indeed, that the skills of people are not under-utilised. This will undoubtedly also require
encouraging employers to be more flexible about the diversity of workers seeking to enter certain jobs and being open to people changing careers, and being re-trained and redeployed.
These actions would help to tackle the apparent ‘skills mismatch’ between the skills of unemployed, underemployed and economically inactive people and skills required in the workforce now and in the future. It should also help to improve the relative skills position of the UK compared to many of its international
competitors.
leavers and university graduates fall. To help employers deal with an ageing population the Skills for Business network should:
x Make known the broad population trends and impact on the composition of the workforce and assess and communicate the detailed implications for sectors;
x Engage employers in a discussion about the implications of an ageing population, both within their own workforce and across their sectors;
x Enable employers to share best practice and access advice and guidance with regard to the recruitment and retention of older workers, identifying champions of good practice within sectors and recognising and optimising their work experience;
x Enhance understanding of the need to engage in maintaining and developing skills of the whole workforce in recognition that employers can no longer rely on young people coming into the labour market to meet needs and additional re-training may be required as employees are redeployed and increasingly change careers through their working lives – this means widening learning opportunities, career routes and applying key management practices (e.g. training needs assessments, performance reviews, succession planning etc) to all age groups of staff to ensure skills are sufficiently up-graded;
x Ensure employers are prepared for the introduction of legislation around age discrimination in October 2005.
The role of women in the labour market continues to increase and for employers to obtain maximum benefit from their skills in the workforce of the future,
attention needs to be given to:
x The employment rate among women with young children and the childcare ‘constraint’;
x Pay, rewards, recognition and utilisation of the skills of women – employers need to review their employment practices to ensure that all workers receive terms and conditions that fairly reward their skills and that their skills are being effectively deployed;
x Opportunities for enhancing women’s satisfaction with employment which has implications for their motivation, commitment and individual performance;
x Breaking through the glass ceiling and striking the work-life balance –
addressing these can bring benefits to both the employer and the employee;
x Ensuring employer awareness of legislation with regard to the employment of women, from the Sex Discrimination Act to the right to request flexible
Disabled people could participate in the labour market more if certain barriers were broken down or if retaining people who become disabled could be
enhanced. Key actions for the Skills for Business network therefore include:
x Working with employers to ensure applicants to jobs are not discriminated against on the grounds of their disability, but rather there is a real
commitment to understanding the nature of the disability and the ability of the individual to work;
x Assisting employers to identify general and personal barriers to work and encourage disabled people to seek employment;
x Encouraging employers to take steps to prevent job loss through the onset of disability and working with key agencies to enable employers to do this;
x Raising awareness amongst employers of their legislative responsibilities.
The ethnic minority population in the UK faces disadvantage in the labour market, such that current skills and experience seem to be under-valued and under-utilised. The skills of people from ethnic minority groups need to be employed more effectively, both for their advantage and to meet employer’s labour and skill needs. Specifically, the Skills for Business network should:
x Work with other agencies to help tackle discrimination in the workforce;
x Increase employer awareness of their legislative requirements (and
increasing responsibilities) and sources of advice and guidance to employers on this;
x Demonstrate the need to tap into the ‘wasted resource’ of the ethnic minority population. This means paying attention to the lower employment rate of ethnic minority groups, and reviewing their pay, rewards, career routes and deployment in the workplace to ensure their skills are being optimised.
Migrants represent another potential source of labour to employers, again, apparently under-utilised in the current labour market. There are a number of means by which the skills of migrants could be better deployed and the role of Work Permits UK may be of increasing importance as employers seek to fill vacancies in tight labour market conditions. Specific roles for the Skills for Business network include:
x Tackling discrimination and misconceptions about migrants, their status and characteristics;
x Lobbying for, and where possible, obtaining, better and more consistent data on migrants, their skills and qualifications and thus matching those to current shortages;
x Making better use of the skills of refugees and helping to understand the difficulty in recognising foreign qualifications in the UK workforce;
x Working with assessors to ensure a ‘fast route’ to accreditation in the UK.
Whilst the groups we have considered are by no means homogenous and
specific action needs to be carefully targeted to ensure it reflects distinct sectoral and employer needs, we can conclude by identifying three broad generic actions for the Skills for Business network, namely to:
x Recognise the shifting structure of the UK population and prepare employers for its impact on the Workforce. The Skills for Business network will analyse labour market information to monitor ongoing
demographic changes nationally and for specific sectors and consider the employment requirements. Individual Sector Skills Councils will produce and up-date sector workforce development plans and identify priorities for action as they apply to their sector. This should compliment any network wide activity where there are common issues that the SSCs and the Sector Skills Development Agency should tackle collectively. The Sector Skills
Agreements which will be put in place in each sector will also need to consider these issues with employers taking the lead in identifying the problems and the solutions;
x Engage employers in tackling specific issues. Sector Skills Councils will aim to make the business case to employers in their sectors and to persuade them of the merits of adopting flexible working patterns, modifying their recruitment and retention policies (e.g. to acknowledge foreign qualifications, to assess disabilities etc), and refining their employment practices and
Human Resource strategies to ensure that they do not discriminate against certain groups but effectively deploy and develop the skills of all workers, meet the changing and future needs of their business and sustain their on-going competitive advantage and performance;
x Work with key partners. The Skills for Business network will work with partners such as the Trade Union Congress, Equal Opportunities
Commission, Commission for Racial Equality, Disability Rights Commission and Government Departments to keep abreast of policy developments, legislative changes and to tackle specific issues. This will help to align sector workforce development needs with the skill needs of those currently under-represented, avoid discrimination, and to understand the barriers to
participation for different groups and assist employers to overcome them. The Skills for Business network will also work with education and training
providers to ensure that where training is provided it is the most relevant and responsive to sectoral skill needs and does not exclude certain workers.1
1
Bibliography
Age Concern England, Policy Unit (2004). The economy and older people.
Barham, C (2002) ‘Economic inactivity and the labour market’, Labour Market Trends, pp 69 – 77.
Beatty, C. and Fothergill, S. (2002) ‘Hidden Unemployment among men: A case study’ in Regional Studies, Vol 36, pp 811-823
Bishop. K. (2004) ‘Working Time Patterns in the UK, France, Denmark and Sweden’, Labour Market Trends, pp 113 – 122
Bloch, A. (2003). Refugees opportunities and barriers in employment. Department for Work and Pensions,
Bulman 2003, ‘Patterns of Pay: results of the 2003 New Earnings Survey’ in Labour Market Trends, p 601 - 612
Cabinet Office Strategy Unit (2003) Ethnic Minorities and the Labour Market.
Charlaff, L. et al. (2004) Refugees and Asylum Seekers in Scotland: A Skills and Aspirations Audit. Scottish Executive Social Research.
Clarke, J. and Salt, J. (2003) ‘Work Permits and foreign labour in the UK: a statistical review’ in Labour Market Trends pp 563 - 574
Department for Education and Skills (2003) Statisticsof Education: Education and Training Statistics for the United Kingdom. HMSO
Department for Trade and Industry (2002) Full and Fulfilling Employment: Creating the labour market of the future.
Duffield, M. (2002) ‘Trends in Female employment 2002’, Labour Market Trends, p605 – 616.
Hurstfield, J. et al. Employing Refugees: Some Organisations’ Experiences. (2004) IES.
Institute for Employment Research Bulletin 2002 Work life balance in Britain.
Institute for Public Policy Research (2004) EU enlargement and labour migration: an IPPR factfile IPPR.
National Statistics (May 2002), Labour Market Spotlight in Labour Market Trends pp 236 - 237
National Statistics (Sept 2002), Labour Market Spotlight Labour Market Trends p462
National Statistics (April 2003), Labour Market Trends, p 155.
National Statistics (2003a). Census statistics (www.statistics.gov.uk/cci/nugget.asp?id=185)
National Statistics (2003b) Population Trends. Spring 2003.
National Statistics (2004a), Social Trends 2004 edition, no. 34.
National Statistics (2004b), Regional Trends 2004 edition.
NOP and IES (2003) Knowledge Migrants: The Motivations and Experiences of Professionals in the UK on Work Permits .
Owen et al (2000), Ethnic Minority Participation. DfES Research report. Nottingham.
Performance and Innovation Unit (2002) Ethnic Minorities and the Labour Market: Interim Analytical Report.
Regan, S. and Stanley, K. (2003) ‘Work for Disabled People’, New Economy, pp 56 – 61.
Robinson, V. (2002). ‘Migrant Workers in the UK’ in Labour Market Trends pp 467 – 476.
Scase, R. (2000) Britain in 2010: the New Business Landscape.
Simic, M. (2002) ‘Volume of underemployment and overemployment in the UK’. Labour Market Trends, p511 – 521.
Smith, A. and Twomey, B. (2002) Labour market experiences of people with disabilities, Labour Market Trends, pp 415 – 427.
Somerville, W. (2003) ‘Migration to the UK: phoenix or albatross’, Working Brief 142 pp 15 – 20.