No-take marine protected areas: abundance, biomass, batch fecundity and genetic connectivity of target species on the Great Barrier Reef
197
0
0
Full text
(2) No-take marine protected areas: abundance, biomass, batch fecundity and genetic connectivity of target species on the Great Barrier Reef. Thesis submitted by Richard D. Evans (BSc) Qld in February 2009. For the degree of Doctor of Philosophy in the School of Marine and Tropical Biology James Cook University.
(3) Statement of Access. I, the undersigned author of this work, understand that James Cook University will make this thesis available within the University library, and via the Australian Digital Theses network, for use elsewhere.. I understand that, as an unpublished work, a thesis has significant protection under the Copyright Act and;. All users consulting this thesis must agree not to copy or closely paraphrase it in whole or in part without the written consent of the author; ad to make proper public written acknowledgement for any assistance which they obtain from it. They must also agree to obtain prior written consent from the author before use or distribution of all or part of this thesis within 12 months of its award by James Cook University.. Beyond this, I do not wish to place any restrictions on access to this thesis.. 30-07-09 Signature. Date. i.
(4) Electronic Copy. I, the undersigned, the author of this work, declare that the electronic copy of this thesis provided to the James Cook University Library, is an accurate copy of the print thesis submitted, within the limits of the technology available.. 30-07-09 Signature. Date. ii.
(5) Statement of Sources. Declaration I declare that this thesis is my own work and has not been submitted in any form for another degree or diploma at any university or other institution of tertiary education. Information derived from the published or unpublished work of others has been acknowledged in the text and a list of references is given.. 30-07-09 Signature. Date. iii.
(6) Declaration on Ethics. The research presented and reported in this thesis was conducted within the guidelines for research ethics outlined in the the James Cook University Policy on Experimentation Ethics. Standard Practices and Guidelines (2001), and the James Cook University Statement and Guidelines on Research Practice (2001). The proposed research methodology received clearance from the James Cook University Experimentation Ethics Review Committee (approval number A1130).. 30-07-09 Signature. Date. iv.
(7) Statement of contribution of others I declare that this thesis is my own work, and has been supported by the following oraginsations and people. The research budget was supported by a number of organisations. They include, the ARC Centre of Excellence for Coral Reef Studies, the Australian Government’s Marine and Tropical Scientific Research Facility (MTSRF), the Queensland Government’s Growing the Smart State PhD Funding, Australian Coral Reef Society Terry Walker Prize 2007, JCU Merit Research Grants, JCU Graduate Research Scheme funding, the Institute of Marine Engineering Research and Technology (Imarest), the Great Barrier Reef Marine Park Authority and the CRC Reef. The research was also funded by Australian Research Council grant and a Merit Research Grant to Garry Russ.. A stipend was provided by a James Cook University Postgraduate Research Scheme (JCUPRS) scholarship co-funded by the School of Marine and Tropical Biology and James Cook University.. Editorial contributions to the thesis were provided by my supervisor’s: professor Garry Russ and Dr. Lynne van Herwerden. Contributions of others to the publications listed as “arising from this thesis” have been acknowledged in authorship of these articles.. Technical laboratory support for the histology was provided by Sue Reilly. For the genetics, technical support was provided by Dr. Lynne van Herwerden and Dr. Curtis Lind.. 30-07-09 Signature. Date. v.
(8) List of publications arising from this thesis Chapter 2 •. Evans RD, Russ GR (2004). Larger biomass of targeted reef fish in no-take marine reserves on the Great Barrier Reef, Australia. Aquatic Conservation: Mar. Freshw. Ecosyst. 14: 505-519.. •. Davis KLF, Russ GR, Williamson DH, Evans RD (2004). Surveillance and poaching on inshore reefs of the Great Barrier Reef Marine Park. Coastal Management 32:373387.. •. Graham NAJ, Evans RD, Russ GR (2003). The effects of marine reserve protection on the trophic relationships of the Great Barrier Reef Marine Park, Australia. Environmental Conservation 30(2): 200-208.. Chapter 3 •. Russ GR, Cheal AJ, Dolman AM, Emslie MJ, Evans RD, Miller I, Sweatman H, Williamson DH (2008). Rapid Increase in Fish Numbers Follows Creation of World's Largest Marine Reserve Network. Current Biology 18(12): 514-515.. •. Diaz-Pulido G, McCook LJ, Dove S, Berkelmans R, Roff G, Kline DI, Weeks S, Evans RD, Williamson DH, Hoegh-Guldberg O (In review). Doom and Boom on a Resilient Reef: Climate Change, Algal Overgrowth and Coral Recovery. PLoS ONE.. Chapter 4 •. Evans RD, Kritzer JP, Russ GR (2008). Batch fecundity of Lutjanus carponotatus (Lutjanidae) and implications of no-take marine reserves on the Great Barrier Reef, Australia. Coral Reefs 27: 179-189.. Chapter 5 •. Evans RD (2008). Assessment of an underwater fish biopsy probe for collecting teleost fish tissue samples. Marine Ecology Progress Series. 368: 305-308.. vi.
(9) Chapter 6 •. Evans RD, van Herwerden, L, Frisch AJ, Russ GR (In review.). Strong genetic but not spatial subdivision of two reef fish species on the Great Barrier Reef. Fisheries Research.. Publications in preparation •. Almany GR, Evans RD, Hamilton RJ, Jones GP, Matawai M, Potuku T, Rhodes KL, Russ GR, Sawynok B, Williamson DH (In prep.) Getting fishers involved in marine protected area research: two case studies from Papua New Guinea and Australia.. •. Berumen ML, Evans RD, Fauvelot C, Heredia P, Hogan D, Moland E, Williamson DH (In prep.) Understanding Larval Connectivity in Coral Reef Systems: Questions and Ways to Answers.. •. Evans RD, Williamson DH, Russ GR (In prep.). Temporal investigation of the nature of predator prey relationships.. Proposed publications •. Evans RD, Williamson DH, Russ GR. Effect of marine reserve protection on smaller serranid species relative to the major serranid, Plectropomus spp.. •. Evans RD, Williamson DH, Russ GR. Effect of coral bleaching on the fish community inside and outside no-take marine protected areas.. •. Harrison H, Evans RD, van Herwerden L, Jones GP, Williamson DH. Assessing the temporal genetic variation in the recruitment of target species. •. Williamson DH, Evans RD, Russ GR. BACIP sampling design studying the density patterns of newly protected species, Cheilinus undulatus and Cromileptes altivelis.. •. Williamson DH, Evans RD, Russ GR. Comparison of three techniques to assess populations of species targeted by hook and line fisheries.. vii.
(10) Acknowledgements I would like to thank my supervisors Professors Garry Russ and Geoffrey Jones, and Dr Lynne van Herwerden for their support during my PhD, but I would like to express extreme gratitude to Garry for all his support throughout my postgraduate career at James Cook University. Not only has he provided excellent supervision, but also the support and encouragement of a friend. Next, I would like to thank my colleague and mate, David Williamson, for his knowledge and friendship during all the projects we have worked on together. We had a lot of successes and fun, I hope it continues.. This study was funded by the Australian Research Council, the Australian Government’s Marine and Tropical Scientific Research Facility (MTSRF), the ARC Centre of Excellence for Coral Reef Studies, Queensland Government’s Growing the Smart State PhD Funding, Australian Coral Reef Society Terry Walker Prize 2007, JCU Merit Research Grants, JCU Graduate Research Scheme funding, the Institute of Marine Engineering Research and Technology (Imarest), the Great Barrier Reef Marine Park Authority and the CRC Reef. Thanks to all these organizations for their financial support. A huge thank you to Maggie and Michael, Anna and Ollie, and Pete Venables at Orpheus Island Research Station. Thanks to all the tourism operators that have helped us in the field with accommodation, tanks and other facilities. They include: Dave Stewart and crew on Kalinda, Pete from Keppel Dive, Geoff and Dianne, Colin and Sarah from Great Keppel Island Holiday Village, Lindeman Island Club Med Resort, Hook Island Wilderness Retreat, and Deb and staff at Hayman Island Resort. Many thanks to the staff at JCU who have helped me with equipment and lab work, who include: Curtis Lind, Phil Osmond, Rob Gegg, Sue Reilly, Jane Webb, Jody Kreuger, Adella Edwards and Mike Kingsford. Thanks to Jake Kritzer for providing his Lutjanus carponotatus gonad samples.. viii.
(11) Many thanks to Melita Samoilys, Howard Choat, Monica Gagliano, and Mark McCormick for your professional advice on my research. Huge thanks to all of my volunteers and workers over the years. Rene Abesamis, Andy Bauman, Karin Buchler, Melissa Cowlishaw, Paul Costello, Mike Emslie, David Feary, Peter Fossam, Nick Graham, Hugo Harrison, Tom Holmes, Alison Jones, Tom Mannering, Even Moland, Tim Prior, Will Robbins, Marie Roman, Niklas Taylor, Paul Tudman, Vanuatu Mike, Stefan Walker, Rebecca Weeks and David Williamson. Huge thanks to all the co-authors on my publications. Big thanks to my friends and family back home who have not forgotten me in my absence from their lives. My biggest apologies to anyone I have missed over this long drawn out thesis. Oh, and how can I forget the soon to be in-laws, Lars and Birgitta Pihlgren? Thank you for your overseas support. Last but not least, to my beautiful ‘woman of my life’, Philippa Mantel, who has supported me at home, in the lab, in the office and out in the field, thank you for being there for me through the worst and the best, I cannot thank you enough for your love and support. I dedicate this work to Tuva.. ix.
(12) Abstract The aim of this thesis was to understand the effects of no-take marine protected areas (MPAs) on fish and corals on the inshore reefs of the Great Barrier Reef (GBR), Australia. The study focused on the principal fishery target species, the coral trout (Plectropomus spp.) and a secondary target, the stripey snapper (Lutjanus carponotatus). The investigation of effects of no-take marine protected areas (MPAs) on the GBR was of particular significance to management during the course of this study, since the amount of no-take protection in the GBR Marine Park (GBRMP) increased from 4.5% to 33.4% in 2004. This study investigated both the effect of the original (established mid 1980’s) and the new (established 2004) MPAs on the density, biomass and reproductive potential of species targeted by fisheries. It explored in detail the effect of the 2004 zoning plan on a representative sample of the reef fish community. It also investigated genetic connectivity of both Plectropomus spp. and L. carponotatus between inshore island groups separated by over 800km, including (and extending) the study area for the preceding ecological and biological studies of these species.. During the planning stages of the new (2004) zoning plan for the GBRMP, there was limited evidence that MPAs on the GBR had increased abundance of reef fish targeted by fisheries. Chapter 2 provided such evidence from the inshore reefs of the GBR. Underwater visual surveys were used to estimate the effect of MPAs on abundance of species targeted by hookand-line-fisheries around the Palm, Whitsunday and Keppel Islands, spanning 600 km of the length of the GBR. The MPAs in the original zoning plan had been protected for 14-18 years. Densities of Plectropomus spp. and Lutjanus carponotatus, both targeted by fisheries, were much higher in MPAs than fished areas in two of the three island groups. The biomass of both Plectropomus spp. and L. carponotatus were significantly greater (3.9 and 2.6 times, respectively) in the MPAs than fished areas at all three island groups. There were significantly. x.
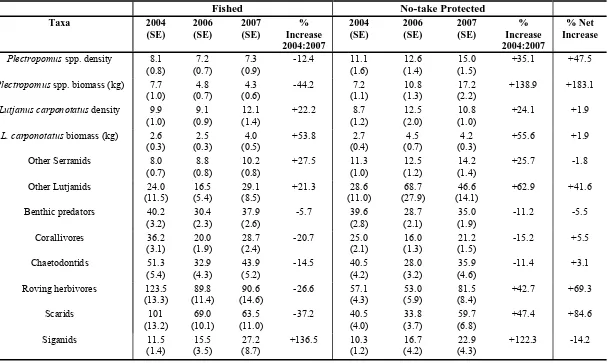
(13) higher densities and biomass of legal-sized Plectropomus spp. >35cm Total Length (TL) (density- 3.8 times, biomass- 5.1 times) and legal-sized L. carponotatus >25cm TL (density4.2 times, biomass 5.3 times) in MPAs than fished areas at all three island groups. No significant difference in abundance between MPAs and fished areas was found for two species not captured by line fisheries (Siganus doliatus and Chaetodon aureofasciatus), and there were no significant differences in benthic characteristics between MPAs and fished areas. Results suggest that no-take marine protected areas have increased biomass of targeted fish species on inshore GBR reefs.. In Chapter 3, the implementation of the new (2004) zoning plan enabled a Before-AfterControl-Impact-Pair (BACIP) design to investigate the effects of the MPAs on the major fish groups and benthos on the inshore coral reefs at three island groups of the Great Barrier Reef (Palms, Whitsundays and Keppels). After three years of no-take protection, the new zoning plan had affected the density and biomass only of the major target of the hook-and-line fishery, the coral trout (Plectropomus spp.). The density of Plectropomus spp. increased from 11.1 to 15 fish 1000m-2, and the biomass increased from 7.2 to 17.2 kg 1000m-2 after three years of protection. No other species, fish group, family or trophic group, displayed any significant change over time attributable to the establishment of the no-take marine reserves. Regression analysis demonstrated some temporal changes in a predator-prey relationship that may, in time, indicate a secondary effect of zoning due to the increase of Plectropomus spp. density in the no-take areas. Benthic variables, hard coral cover, macro-algal cover and structural complexity were not affected by the rezoning. This study also demonstrated that a reduction in live coral cover due to a coral bleaching event in one region had a larger impact on the fish community structure than the implementation of no-take status.. xi.
(14) With evidence that no-take protection increased biomass of Lutjanus carponotatus (Chapter 2), Chapter 4 investigated body size to fecundity relationships and examined the potential benefits of increased batch fecundity in MPAs compared to fished areas around the Palm, Whitsunday and Keppel Island Groups, Great Barrier Reef, Australia. Lutjanus carponotatus batch fecundity increased with fork length in a non-linear relationship that was best described by a power function. Batch fecundity differed by more than one hundredfold among individuals, with a range from 7,074 to 748,957 eggs in fish ranging from 184 to 305mm fork length. Furthermore, egg diameter increased with fish size. Based on underwater visual census, the potential batch fecundity per unit area in all three island groups ranged from 1.0 to 4.2 times greater in the MPAs than in the fished areas from 2001 - 2004. In 2002, a mean 2.3 fold difference in biomass between MPAs and fished areas converted to a mean 2.5 fold difference in batch fecundity per unit area. Greater batch fecundity, longer spawning seasons and potentially greater larval survival due to larger egg size from bigger individuals may enhance the potential benefits of MPAs on the Great Barrier Reef significantly.. Increased density, biomass and egg production per unit area of the focal species within no-take marine protected areas on inshore reefs of the Great Barrier Reef (GBR) lead to the question: are no-take MPAs connected via larval transport to each other and/or to fished areas? The phylogenetic and population genetic study in this thesis (Chapter 6) is a broad scale analysis of the genetic connectivity of Plectropomus maculatus and Lutjanus carponotatus within and between inshore islands of the GBR. DNA sequences from the mitochondrial (mt) control region were analysed to determine whether there was any genetic partitioning between populations from four island groups (Palms, Whitsundays, Keppels and Capricorn Bunkers) spanning a latitudinal gradient of approximately 800 km. Tissue samples for part of this study were collected by a new in situ biopsy probe (Chapter 5). Analysis of molecular variance (AMOVA) indicated high levels of gene exchange between locations within and between the. xii.
(15) island groups. Phylogenetic analysis showed no geographic partitioning but identified two distinct lineages for both species that were distributed throughout the sampled range, suggesting that both L. carponotatus and P. maculatus were admixtures of differentiated lineages, rather than stable populations. Coalescence analysis showed that P. maculatus may be up to four times younger than L. carponotatus on the GBR and lineages may be either: i) refugial expansions between glacial maximums during the Holocene and Pleistocene periods; and/or ii) one lineage in each species may represent migrants from outside the GBR. Sampling from further afield will help to answer this question. The study showed that populations of both species within the sampling range were panmictic. Under current conditions they may be managed as a single stock across the sampled range of the GBR. It also showed that the coexistence of two genetically distinct lineages throughout the sampled area increases genetic diversity up to fourfold for both species.. Overall, no-take MPAs on the inshore reefs of the GBR have been effective at increasing density and biomass of two species targeted by fishers, Plectropomus spp. and Lutjanus carponotatus, and egg production per unit area (L. carponotatus only). With current knowledge of larval dispersal and such high levels of gene flow over large expanses from north to south along the GBR, one would expect that there would be some larval export from no-take marine protected areas to fished areas. More detailed larval marking or parentage analysis will be required to demonstrate unequivocal larval links.. xiii.
(16) Contents Statement of Access.......................................................................................................... i Electronic Copy ............................................................................................................... ii Statement of Sources ...................................................................................................... iii Declaration on Ethics...................................................................................................... iv Statement of contribution of others ................................................................................. v List of publications arising from this thesis.................................................................... vi Acknowledgements....................................................................................................... viii Abstract............................................................................................................................ x Contents ........................................................................................................................ xiv List of Tables ................................................................................................................ xix List of Figures............................................................................................................. xxiii Chapter 1: General Introduction ...................................................................................... 1 1.1 Thesis aims and outline...................................................................................... 6 Chapter 2: Larger Biomass of Targeted Reef Fish in No-take Marine Protected Areas on the Great Barrier Reef, Australia. ............................................................................... 9 2.1 Introduction............................................................................................................ 9 2.2 Study Areas.......................................................................................................... 13 2.3 Methods ............................................................................................................... 15 2.3.1 Data Collection ............................................................................................. 16 2.3.2 Data Analysis................................................................................................ 17 2.4 Results.................................................................................................................. 18 2.4.1 Density of Plectropomus spp. ....................................................................... 18 xiv.
(17) 2.4.2 Biomass of Plectropomus spp....................................................................... 19 2.4.3 Density and Biomass of “Legal-Sized” Plectropomus spp........................... 19 2.4.4 Density of Lutjanus carponotatus ................................................................. 19 2.4.5 Biomass of L. carponotatus .......................................................................... 19 2.4.6 Density and Biomass of Legal-Sized L. carponotatus.................................. 20 2.4.7 Density of Non-Target Species..................................................................... 22 2.4.8 Benthic Variables.......................................................................................... 22 2.5 Discussion............................................................................................................ 28 2.5.1 Conclusion .................................................................................................... 33 Chapter 3: The effects of the 2004 Representative Areas Program zoning plan on inshore coral reefs of the Great Barrier Reef: the first three years of protection. ......... 35 3.1 Introduction.......................................................................................................... 35 3.2 Methods ............................................................................................................... 38 3.2.1 Study Sites .................................................................................................... 38 3.2.2 Data Collection ............................................................................................. 38 3.2.3 Analysis ........................................................................................................ 41 3.4 Results.................................................................................................................. 42 3.4.1 Primary target and secondary target species of the hook and line fishery.... 45 3.4.2 Non-target taxa ............................................................................................. 49 3.4.3 Prey Fish ....................................................................................................... 51 3.4.4 Benthos ......................................................................................................... 52 3.5 Discussion............................................................................................................ 64 3.5.1 Non-target species......................................................................................... 65. xv.
(18) 3.5.2 Benthos ......................................................................................................... 66 3.5.3 Implied predator - prey interactions.............................................................. 68 3.5.4 Conclusion .................................................................................................... 71 Chapter 4: Batch fecundity of Lutjanus carponotatus (Lutjanidae) and implications of no-take marine protected areas on the Great Barrier Reef, Australia ............................ 73 4.1 Introduction.......................................................................................................... 73 4.2 Materials and methods ......................................................................................... 76 4.2.1 Brief History of Zoning ................................................................................ 76 4.2.2 Surveys.......................................................................................................... 78 4.2.3 Batch fecundity ............................................................................................. 79 4.2.4 Batch fecundity per unit area ........................................................................ 81 4.2.5 Assumptions.................................................................................................. 82 4.2.6 Analysis ........................................................................................................ 82 4.5 Results.................................................................................................................. 83 4.5.1 Biomass per unit area.................................................................................... 83 4.5.2 Batch fecundity ............................................................................................. 84 4.5.3 Batch fecundity per unit area ........................................................................ 85 4.5.4 Comparing biomass per unit area to BFUA.................................................. 86 4.6 Discussion............................................................................................................ 93 Chapter 5: Assessment of an underwater biopsy probe for collecting teleost fish tissue samples........................................................................................................................... 98 5.1 Introduction.......................................................................................................... 98 5.2 Methods ............................................................................................................. 100. xvi.
(19) 5.2.1 Survival Rate............................................................................................... 101 5.3 Results................................................................................................................ 102 5.4 Discussion.......................................................................................................... 105 Chapter 6: Strong genetic but not spatial subdivision of two reef fish species on the Great Barrier Reef........................................................................................................ 107 6.1 Introduction........................................................................................................ 107 6.2 Methods ............................................................................................................. 110 6.2.1 Collection and sampling design.................................................................. 110 6.2.2 DNA analysis.............................................................................................. 112 6.2.3 Statistical analysis....................................................................................... 112 6.2.4 Population genetic analysis......................................................................... 113 6.2.5 Coalescence Analysis ................................................................................. 114 6.3 Results................................................................................................................ 115 6.3.1 Genetic variation......................................................................................... 115 6.3.2 Phylogenetic analysis.................................................................................. 115 6.3.3 Population genetic analysis......................................................................... 116 6.3.4 AMOVA ..................................................................................................... 118 6.3.5 Coalescence ................................................................................................ 119 6.4 Discussion.......................................................................................................... 125 6.4.1 Implications for management ..................................................................... 129 Chapter 7. General Discussion..................................................................................... 131 7.1 Comparing original zoning results to 2004 zoning results ............................ 131 7.2 Reproductive connectivity ............................................................................. 133. xvii.
(20) 7.3 Management Implications.............................................................................. 134 7.4 Ideas arising from the thesis and Future research.......................................... 136 References.................................................................................................................... 139 Appendix 1................................................................................................................... 161 Appendix 2................................................................................................................... 166. xviii.
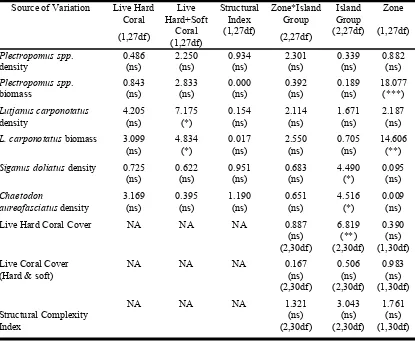
(21) List of Tables Table 2.1: Categories of structural complexity of the benthic substratum. ....................17 Table 2.2: Results of univariate two-factor ANCOVA on the density and biomass of Plectropomus spp., Lutjanus carponotatus, and the density of Chaetodon aureofasciatus and Siganus doliatus in the Palm, Whitsunday and Keppel Island Groups. Covariates were Live Hard Coral, Live Hard and Soft coral, and Structural complexity Index. ***P<0.001; **P<0.01; *P<0.05; ns: not significant; NA: not applicable. ....................................................................21 Table 2.3: Results of univariate two-factor ANCOVA on the density and biomass Plectropomus spp. (>35cm TL) and of legal sized Lutjanus carponotatus (>25cm TL) in the Palm, Whitsunday and Keppel Island Groups. Note that the minimum legal size of Plectropomus spp. is >=38 cm TL. ***P<0.001; **P<0.01; *P<0.05; ns: not significant. .........................................................................22 Table 3.1:. Definitions of the categories used for visual estimation of rugosity and slope to estimate structural complexity of the reef habitats on inshore reefs of the GBR. ...........................................................40. Table 3.2: Mean numbers per 1000m2 (unless kg specified) and the percentage increase between 2004 and 2007 for each group in fished and no-take marine protected areas of the Palm, Whitsunday and Keppel Islands. Last column is the net increase within the no-take protected relative to the fished areas. HCC is xix.
(22) hard coral cover, SCI is structural Complexity Index. SE is 1 standard error. ...............................................................................................43 Table 3.3: Results of Multivariate (Pillai’s trace) Repeated Measures ANCOVA for density or biomass of several target species or trophic or Family groups and three benthic variates: Percentage Hard Coral Cover (%HCC), Percentage Algal Cover and Structural Complexity Index in fished and no-take protected areas in the Palm, Whitsunday and Keppel Island Groups between 2004 and 2007. ***P<0.001; **P<0.01; *P<0.05; ns: not significant. Covariates are listed across the first row along with the variates. ...........................................................................................47 Table 3.4: Results of Multivariate (Pillai’s trace) Repeated Measures Anovas, for variates that demonstrated no relationship with covariates in Table 3, in fished and no-take protected areas in the Palm, Whitsunday and Keppel Island Groups between 2004 and 2007.; ***P<0.001; **P<0.01; *P<0.05; ns: not significant........................52 Table 4.1: Results of ANOVA and Repeated Measure ANOVAs of biomass/ unit area for Lutjanus carponotatus in the Palm, Whitsunday and Keppel Island Groups between 2001 and 2004. W&P = Whitsunday & Palm Islands; KI = Keppel Islands; ***P<0.001; **P<0.01; *P<0.05; NS: not significant; df: degrees of freedom.................84. xx.
(23) Table 4.2: The no-take marine reserves/ fished areas ratios biomass and batch fecundity/ unit area (BFUA) in the Palm and Whitsunday Islands in 2001, 2002, 2003 and Keppel Island in 2002 & 2004..................86 Table 4.3: Results of the ANOVA and Repeated measure ANOVAs of the batch fecundity/ unit area of Lutjanus carponotatus in the Palm, Whitsunday and Keppel Island Groups. W&P = Whitsunday & Palm Islands; KI = Keppel Islands; ***P<0.001; **P<0.01; *P<0.05; NS: not significant; df: degrees of freedom. .................................87 Table 5.1: Success rates of tissue extraction by the biopsy probe from Lutjanus carponotatus and Plectropomus maculatus.................................103 Table 6.1: Genetic diversity estimates for Plectropomus maculatus and Lutjanus carponotatus: samples size (n), number of haplotypes (nh), haplotype diversity (h), and nucleotide diversity +/- SE (π)...............117 Table 6.2: Population pairwise Fst values (left of the diagonal) and corresponding p values (right of the diagonal) of Plectropomus maculatus and Lutjanus carponotatus, as estimated by a distance method assuming the Tamura substitution model. .....................................118 Table 6.3: Hierarchical analysis of molecular variance (AMOVA) within and among three inshore island groups, Palm, Whitsunday, Keppel, and one mid shelf reef cluster, Capricorn Bunkers, of the Great Barrier Reef for Plectropomus maculatus and Lutjanus carponotatus. ..............................................................................................119. xxi.
(24) Table 6.4: Plectropomus maculatus and Lutjanus carponotatus coalescence analysis parameters for the whole population and for the two clades defined by phylogenetic and population genetic analyses. SSD = Sums squared Differences, R = Raggedness Index.........................120. xxii.
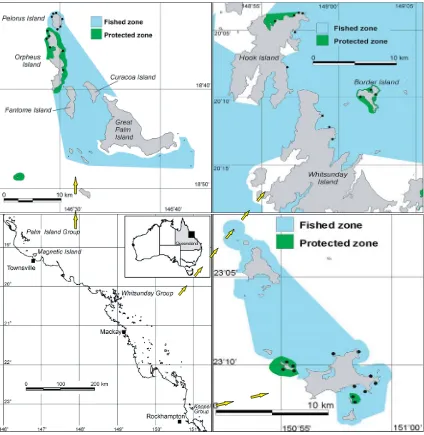
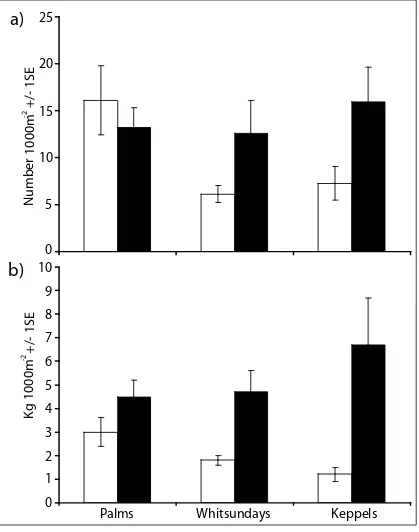
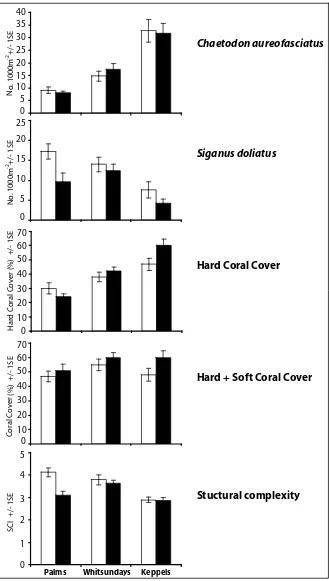
(25) List of Figures Figure 2.1: Map of the Queensland Coast and the three Island Groups-Palm, Whitsunday and Keppel Islands. No-take marine protected areas and fished areas are shown. Black dots indicate sampling sites...................14 Figure 2.2: The a) density and b) biomass of Plectropomus spp. in protected and fished areas at three island groups of the GBR. Black bars represent no-take MPAs and white bars are fished areas. ............................24 Figure 2.3: The average a) density and b) biomass of Plectropomus spp. (>35cm TL) and legal-sized Lutjanus carponotatus (>25cm TL) in no-take MPAs (black bars) and fished areas (white bars) of the Palm, Whitsunday and Keppel Island Groups combined. ............................25 Figure 2.4: The a) density and b) biomass of Lutjanus carponotatus in protected and fished areas at three island groups of the GBR. Black bars represent no-take MPAs and white bars are fished areas. .............................................................................................................26 Figure 2.5: Mean density of Siganus doliatus, Chaetodon aureofasciatus, % of live hard coral cover; % live coral cover (hard & soft coral); and indices of benthic structural complexity for no-take MPAs (black bars) and fished (white bars) areas at three different island groups of the GBR. .......................................................................................27 Figure 3.1: Map of Sites in the A) Palm, B) Whitsunday and C) Keppel Islands along the Queensland Coast, Australia. Green areas are MPAs, those with black dots around are pre-2004 MPAs; Yellow xxiii.
(26) are areas where only recreational fishers can catch fish but with one hook and one line or go spear fishing (except in the Whitsundays); Dark blue is open to all fishing except trawling; Light blue is open to all uses. .......................................................................55 Figure 3.2: Biomass of Lutjanus carponotatus and Plectropomus spp. in fished (dash line) and no-take protected (solid line) areas of the Palm, Whitsunday and Keppel Islands from before the re-zoning of the GBRMP in 2004 and at two resurveys in 2006 and 2007. .................56 Figure 3.3: Univariate regression tree of Plectropomus spp. biomass in fished and no-take protected areas of the Palm, Whitsunday and Keppel Islands from before the re-zoning of the GBRMP in 2004 and at two resurveys in 2006 and 2007. Numbers below forks in the tree represent the percentage of the tree explained at that split. Figures below each dot are Plectropomus spp. biomass (kg per 1000m-2) at the location/time. Figures in brackets are number the sites. ...........................................................................................57 Figure 3.4: Density and biomass (+/- 1 SE) of primary and secondary target fishery species in fished (dash line) and no-take protected areas (solid line) in the Palm, Whitsunday and Keppel Islands from before the re-zoning of the GBRMP in 2004 and two resurveys in 2006 and 2007...............................................................................................58 Figure 3.5: Univariate regression tree of ‘Other Serranids’ density in fished and no-take protected areas of the Palm, Whitsunday and Keppel. xxiv.
(27) Islands from before the re-zoning of the GBRMP in 2004 and two resurveys in 2006 and 2007. Numbers below forks represent the percentage of the tree explained at that split. Figures below each dot are ‘Other Serranids’ density 1000m-2 at the location/time. Figures in brackets are number the sites................................59 Figure 3.6: Density (+/- 1 SE) of non-target species in fished areas (dash line) and no-take protected areas (solid line) in the Palm, Whitsunday and Keppel Islands from before the re-zoning of the GBRMP in 2004 and at two resurveys in 2006 and 2007. Note different y-axis scale for Pomacentridae in the Keppel region.....................60 Figure 3.7: Univariate regression tree of Corallivores with Hard Coral Cover as an explanatory variable in fished and no-take protected areas of the Palm, Whitsunday and Keppel Islands from before the rezoning of the GBRMP in 2004 and at two resurveys in 2006 and 2007. Numbers below forks represent the percentage of the tree explained at that split. Figures below each dot are ‘Corallivore’ density 1000m-2 at the location/time. Figures in brackets are number of sites..............................................................................................61 Figure 3.8: Regression plots of Plectropomus spp. density versus Pomacentridae density, Pomacentridae density minus C. nitida and Prey density minus C. nitida in the Palm, Whitsunday and Keppel Islands from before the re-zoning of the GBRMP in 2004 and at two resurveys in 2006 and 2007. Note the different y-axis. xxv.
(28) for Pomacentridae in 2004 compared to 2006 and 2007 in the top three plots. NS: not significant; (*): p =0.05; *: p<0.05; **: p<0.01; ***: p<001.......................................................................................62 Figure 3.9: Benthic variables measured in fished areas (dash line) and notake protected areas (solid line) of the Palm, Whitsunday and Keppel Islands from before the re-zoning of the GBRMP in 2004 and at two resurveys in 2006 and 2007. Note the different y-axis for Macro-algae in the Keppel region...........................................................63 Figure 4.1: Map of the Queensland coast and the three island groups: Palm, Whitsunday and Keppel Islands. Green/ Protected Zone = Notake marine protected areas; Blue/ Fished zone = fished area. Black dots indicate sampling sites. ...............................................................77 Figure 4.2: Photographs of the oocytes of Lutjanus carponotatus. a) Histological photograph (4x) of the tertiary yolk globule stage indicating the group-synchronous pattern of oocyte development. b) Macroscopic photo of Hydrated Oocyte stage and c) Histological photo (10X) of hydrated Oocyte stage. YV= Yolk Vesicle stage; PY = Primary Yolk globule stage; SY= Secondary yolk globule stage; TY= Tertiary Yolk Globule Stage; PO= Primary oocytes. ...........................................................................................88 Figure 4.3: a) Spatial and b) Temporal comparisons of Lutjanus carponotatus biomass in no-take and fished areas in the Palm, Whitsunday and Keppel Islands from 2001 – 2004. GK = Great. xxvi.
(29) Keppel Islands, P = Palm Islands, W = Whitsunday Islands, White bars = Fished, Grey bars = Protected. The year is designated by ’01, etc. ..................................................................................89 Figure 4.4: Batch fecundity data from Lutjanus carponotatus. a) Fork Length vs batch fecundity; b) Average batch fecundity/ individual/ size class with a power curve fitted, and c) Average egg diameter/ size class. ED = Egg diameter, F = Fecundity, FL = Fork Length, SC = Size Class....................................................................90 Figure 4.5: a) Spatial and b) temporal comparison of batch fecundity per unit Area of Lutjanus carponotatus in the no-take and fished areas of the Palm, Whitsunday and Keppel Islands from 2001 – 2004. GK = Great Keppel Islands, P = Palm Islands, W = Whitsunday Islands, White bars = Fished, Grey bars = Protected. The year is designated by ’01, etc.................................................................91 Figure 4.6: Density of Lutjanus carponotatus females and the mean batch fecundity per size class in each zone in the Palm, Whitsunday and Keppel Islands 2002. White bars = Fished, Grey bars = Notake; Dash line = Protected; Solid line = Fished...........................................92 Figure 5.1: Underwater biopsy probe, for small- to medium-sized teleost fish. DB: Dental brooches; B: Forward-facing barb; P: Probe; SP: Split pin; PA: Probe adaptor; SS: Spear shaft. .....................................104 Figure 6.1: Map of the Great Barrier Reef (grey shade) along the Queensland Coast, Australia. Black dots represent the four insets. xxvii.
(30) showing the locations and number (n) of Plectropomus maculatus (Pm) and Lutjanus carponotatus (Lc) sampled in each island group. A) Palm Islands; B) Whitsunday Islands; C) Keppel Islands; and D) Capricorn Bunker Islands. Dotted lines in the Capricorn Bunker region (D) represent submerged reef and the solid lines around the islands (dark gray) are reefs that are exposed at tidal datum. ...............................................................................111 Figure 6.2: Best out-group rooted maximum likelihood (ML) trees of mitochondrial. control. region. from. 164. individuals. of. Plectropomus maculatus (three individuals of P. maculatus from West Australia as the out-group) and 188 individuals of Lutjanus carponotatus (three individuals of L. vitta as out-group). Numbers on inter nodes indicate bootstrap support values obtained from 100 ML and 500 NJ bootstrap replicates. Remnant P. maculatus samples are those which do not belong to either sister clade A or B. Shaded bars indicate proportional representation of individuals from each island group, as identified by the embedded key to the Figure.............................................122 Figure 6.3: Haplotype minimum spanning tree based on the mitochondrial control region of Plectropomus maculatus and Lutjanus carponotatus from three near shore islands (Palm, Whitsunday, Keppel) and one mid-shelf cluster of reefs (Capricorn Bunkers) on the Great Barrier Reef. Remnant P. maculatus samples are. xxviii.
(31) those which do not belong to either clade A or B. Shaded portions in haplotypes indicate proportional representation of individuals from each Island group, as identified by the embedded key to the Figure. Circle sizes are proportional to the number of individuals sharing each haplotype, as indicated. .....................123 Figure 6.4: Mismatch distribution of pairwise sequence differences for Plectropomus maculatus and Lutjanus carponotatus. Histograms indicate observed numbers of pairwise haplotypes that differ by the given number of base pairs. Curves indicate the expected number of pairwise haplotypes that differ by the given number of base pairs under the expansion model. .......................................................124. xxix.
(32) Chapter 1: General Introduction Capture fisheries are struggling on a global scale to supply the growing demand for marine resources from the rapidly expanding human population (Pauly et al. 2002; Myers & Worm 2003, Sale et al. 2005). Increasing fishing technologies and techniques have vastly increased the ability of fishers to extract huge amounts of fishery products (FAO 2007). However, this has come at the expense of many fishery stocks and has eventually caused the collapse of some fisheries, for example the Atlantic Cod off Nova Scotia (Myers et al. 1997). Many fisheries the world over are displaying obvious signs of overexploitation (Roberts 1997; Pauly et al. 1998; Hutchings 2000; Myers and Worm 2003; Worm et al. 2006). In 2005, 23% of marine fisheries were under exploited, 52% were considered fully exploited, 17% were overexploited, 7% were depleted and 1% were recovering from depletion (FAO 2007). Overexploitation is rapidly increasing in developing nations, with a growing human population often relying on coastal coral reefs for their primary source of protein (Newton et al. 2007). Recently, the Asian demand for the live fish trade has increased interest in large predatory species on coral reefs throughout the world. The live reef fish fishery has expanded greatly on the Great Barrier Reef (GBR) in the past decade (Mapstone et al 2001; QDPI&F 2007; Welch et al 2008). At present the GBR reefs are not overexploited but may become so if fishing pressures continue to increase at their current rate (Bellwood et al. 2004).. Conventional methods of fishery management (catch and effort controls, bag limits, size limits, closed seasons, gear and licence restrictions etc.) have proved unsuccessful in many fisheries, especially on coral reefs with multi-specific fisheries (Russ 2002). Fishery managers recently have begun to show interest in marine protected areas as fishery tools (Russ and Zeller 2003; Sale et al. 2005; McClanahan et al. 2006; Mora et al. 2006; Russ et al. 2008). Marine protected areas are also known as no-take marine protected areas (MPAs) or marine reserves and are. 1.
(33) established for several reasons (Sale et al. 2005). These include protecting: 1) particular endangered species, 2) specific habitats, 3) biodiversity or 4) certain areas from extractive activities such as mining (Roberts and Polunin 1993; Bohnsack 1998). As a fishery tool, MPAs are established to protect a portion of the spawning stock from exploitation (PDT 1990; Roberts and Polunin 1991; Dugan and Davis 1993; Bohnsack 1998; Russ and Alcala 1996a; Russ 2002). The benefits of MPAs have been discussed at length in the literature, they are best summarised by Russ (2002). There are five proposed benefits within the reserve for fishery target species: 1) reduced or no fishing mortality, 2) increased abundance, 3) increased average size, 4) increased biomass, and 5) increased propagule production per unit area (Russ 2002). However, fisheries will only benefit from MPAs if they provide benefits to surrounding fished areas. On the basis of the five benefits inside the reserve, conventional theory predicts that MPAs may enhance fisheries via two methods: 1) Density dependence may encourage movement of individuals from higher density to lower density areas (Abesamis & Russ 2005, Abesamis et al. 2006) for food or shelter (known as ‘the spill-over effect’), and 2) greater propagule production per unit area within the MPAs should equate to net export of larval products to fished areas (known as ‘the recruitment effect’) (Russ 2002).. Throughout the literature there is growing evidence of increased abundance, density and biomass of target species in MPAs compared to fished areas (Roberts & Polunin 1991, Dugan & Davis 1993, Russ 2002, Halpern 2003). However, many of the early studies are spatial comparisons focused on a single MPA and fished area at one point in time and are confounded by habitat, history and larval supply differences between fished and protected areas (Roberts & Polunin 1991, Dugan & Davis 1993, Russ 2002; Shears and Babcock 2003; Willis et al. 2003; Barrett et al. 2007). These early studies led fishery managers to avoid using MPAs as fishery management tools, as the evidence for benefits beyond MPA boundaries was highly equivocal (Roberts and Hawkins 2000; Russ 2002; Gell and Roberts 2003; Roberts et al. 2005; Sale et al.. 2.
(34) 2005). More studies using monitoring data are appearing in the literature, and the knowledge gained from these studies is invaluable (e.g. Barrett et al. 2007). However many of these studies are still equivocal since they often do not have information on the MPA before it was protected. Recent Before-After-Control-Impact-Pair (BACIP) sampling designs published since the beginning of this study (Russ and Alcala 2003, Shears et al. 2006, Samoilys et al. 2007, Francini-Filho and Moura 2008) unequivocally demonstrate that MPAs affect target species positively. However, long term BACIP studies of MPA effects are still not available for GBR reefs.. The fifth benefit inside marine protected areas is based largely on the assumption that larger female fish produce more eggs (Berkeley et al., 2004). This is supported by the premise that reef fish fecundity increases exponentially with body size (Thresher 1984). For example PDT (1990) suggested that one 61cm Lutjanus campechanus produced the same amount of eggs as 212 42cm L. campechanus. Therefore, if there is a greater abundance of larger fish in MPAs, then naturally the propagule production per unit area should be higher than in fished populations. The numbers of empirical studies investigating whether MPAs produce greater propagule production per unit area are still relatively few. A limited number of studies estimating batch fecundity per unit area of fish suggest that MPAs have greater reproductive potential than surrounding areas (Bohnsack and Ault 1996, Ault et al. 1997, Paddack and Estes 2000, Kamukuru and Mgaya 2004), but this has never been studied for any species on the GBR.. Increased abundance, density and biomass have been proposed to cause net adult export near marine protected areas. Net adult export can be demonstrated by abundance gradients from reserve boundaries (Rakitin & Kramer 1996, Russ & Alcala 1996b), higher CPUE in fished waters close to marine reserve boundaries (Alcala & Russ 1990, McClanahan & Kaunda-Arara 1996; Abesamis et al. 2006), tagging and movement (see review Russ 2002), and modelling. 3.
(35) studies (Polacheck 1990, Attwood & Bennet 1995; Hilborn et al. 2006). However, modelling does not provide unequivocal evidence and should only be used as a guide to reality. The results of most of these adult export studies suggest that most teleost fish are relatively siteattached, and if there is any movement it is typically on a very local scale. Thus, any individuals living near a boundary between fished and protected areas may cross the border on a daily basis (Zeller and Russ 1998; Zeller et al. 2003) but the evidence for the spill-over effect is still highly equivocal and requires more detailed research to show the extent and spatial scale of net adult export of target fish species from protected to fished areas.. It is important to stress that evidence for net larval export from MPAs to fished areas is essentially non-existent, despite the general belief that it should provide the greatest benefits to fisheries (Carr & Reed 1993, Sladek-Nowlis & Roberts 1999, Russ 2002). The sheer scale and budget of an experiment to test net larval export has led most scientists to believe that an adaptive management, large-scale modelling approach is the best way to investigate net export of larvae from reserves (Russ 2002). However, in the past decade, several empirical studies have shown that self recruitment (larvae returning to their natal reef or even close to the original spawning site) may occur at greater rates than previously expected. Jones et al. (1999) were able to mark the otoliths of pre-hatched Pomacentrus amboinensis larvae with tetracycline at Lizard Island, GBR, and showed that larvae spawned on that reef could actually return and settle on their natal reef. Jones et al. (2005), using similar methods, demonstrated empirically that 30% of Amphiprion polymnus settle to a 2 hectare natal area, sometimes <100m from their birth site after a 9-12 day larval duration. The most recent study using trans-generational markers and genetics found up to 60% self recruitment for coral reef fish species, one with a 10d larval duration (A. percula) and another with a 30d larval duration (Chaetodon vagabundus) (Almany et al. 2007). However, the juvenile and adult stages of these two species are relatively easy to locate and capture, compared to larger commercially important species. It. 4.
(36) is now vital to demonstrate the larval dispersal capacity of fishery target species to and from MPAs. Until such methods are developed, basic inferences of batch fecundity per unit area and genetic connectivity are the next best thing, for we know from the studies by Jones and colleagues that 40-70% of reproductive products may be exported to other reefs if they survive.. Connectivity of MPAs can be inferred by the population genetics of a species. Population genetic studies of species targeted by fishers have shown no genetic structure along the length of the GBR, apart from one isolated P. maculatus clade south of the GBR (van Herwerden et al. 2006). High genetic connectivity has been shown for Lutjanus argentimaculatus (Ovenden and Street, 2003), Lethrinus miniatus (van Herwerden et al. 2003), P. maculatus and P. leopardus (van Herwerden et al 2006). The inshore stocks of reef fish have received relatively little genetic stock assessment compared to the mid- and outer-shelf reefs. Commercial reef fin-fish fishers have low to no impact on the inshore reefs but recent evidence shows that recreational fishers have significant effects on inshore fish stocks (Evans and Russ 2004; Williamson et al. 2004; Russ et al. 2008) and thus a genetic assessment of their population status and connectivity should be conducted. There has been no unequivocal evidence on the GBR to suggest that marine protected areas provide the fishery benefits of MPAs reported from other countries. Reasons for this may be low levels of fishing due to low human population numbers and large distances of reefs from the coastline (approx. 50km) in comparison to developing nations with large populations in close proximity to coastal reefs. The distance to the reefs on the GBR may also aid in illegal poaching, as surveillance is costly and time consuming. Evidence of poaching has been demonstrated on the inshore reefs of the GBR; Davis et al. (2004) showed that poaching decreased with increased surveillance around the Palm and Magnetic Islands, GBR. The best evidence of MPA benefits on the GBR is from an opportunistic BACIP sampling design. 5.
(37) assessing fish stocks on the near shore reefs of the GBR, where two researchers sampled similar areas of the same island groups for the same species, greater than a decade apart, and using slightly different methods. Williamson et al. (2004) showed that coral trout biomass, around the Palm and Whitsunday Islands, GBR, was 4-6 times higher in the MPAs after 12-13 years of protection. They also demonstrated that coral trout biomass in fished areas had not changed greatly during the same period.. 1.1 Thesis aims and outline This thesis is not an attempt to answer all the outstanding issues of MPA research but to bridge some of the knowledge gaps in the literature, particularly on the Great Barrier Reef of Australia. The specific objectives of this thesis are: 1. Assess the effect of the no-take marine protected areas on the abundance and biomass of species targeted by fishers in three island groups spanning 700km of the Queensland coastline after 14 years of protection. 2.. Investigate short term temporal effects of the new (2004) zoning plan on the fish and benthic communities of the inshore reefs of the GBR using a Before-After-ControlImpact-Pair sampling design.. 3. Explore the effects of no-take marine protected areas on the reproductive output of a fishery target species. 4. Examine the genetic connectivity of the MPAs and island groups for two focal species.. The focal species’ of this thesis are Plectropomus spp. and Lutjanus carponotatus. Plectropomus spp. are the primary target of both recreational and commercial hook and line fishers on the GBR. Lutjanus carponotatus are considered to be a secondary target of. 6.
(38) commercial fishers and are regularly caught and kept by recreational fishers. Chapter 2 provides a spatial comparison to determine the effect of the original (mid 1980’s) zoning plan on these two species. Two non-target groups are used as control species and benthic variables were also compared to control for habitat differences.. With the implementation of the 2004 zoning plan on the GBR, baseline data was collected for a unique BACIP design to assess the effects of MPAs on approximately 160 species of reef fish. Chapter 3 is a temporal study of the focal species in the same three island groups studied in Chapter 2, but also includes a large suite of secondary target and non-target species divided into Family or trophic groups. In this study, predator-prey relationships were analysed and the influence of climate change was investigated as well.. Chapter 4 tests the theory that MPAs of the near shore reefs of the GBR provide greater batch fecundity per unit area of target fishery species. It compares the biomass and propagule production per unit area of a gonochoristic species (Lutjanus carponotatus) between MPAs and fished areas in three island groups for up to 3 years of sampling. The implication of body size, age and frequency of spawning in relation to increased biomass within MPAs compared to fished areas is discussed.. With evidence of greater density, biomass and batch fecundity in MPAs, the next step was to assess larval export. This thesis uses genetics to assess connectivity of populations on the inshore reefs of the GBR. Originally, the plan was to investigate broad-scale connectivity between Islands and fine-scale connectivity between MPAs and fished areas within one of the island groups. However, research permitting issues took too much time and thus only broadscale connectivity was assessed in this thesis. Chapter 5 is a methods paper for chapter 6. Chapter 5 describes a new tool designed for collecting tissue samples of small to medium. 7.
(39) sized teleost reef fish for genetic analysis. A biopsy probe was designed by RE that could be fitted to a spear gun and fired at fish collecting a small tissue sample with minimum impact. Chapter 5 evaluates the efficacy of this new tool on the focal species, Plectropomus spp. and L. carponotatus, considering their behaviour, and physical attributes in regard to the success of the biopsy probe. Chapter 6 assessed the genetic connectivity of the focal species, Plectropomus spp. and L. carponotatus between the islands in this study. The Hyper variable region (HVR) mitochondrial D-loop was used to assess the population connectivity of both species.. Chapter 7 concludes the thesis with a general discussion summarizing the key findings and suggesting further work that will increase our knowledge and provide a better understanding of the potential benefits of no-take marine protected areas.. 8.
(40) Chapter 2: Larger Biomass of Targeted Reef Fish in No-take Marine Protected Areas on the Great Barrier Reef, Australia.. 2.1 Introduction Evidence to support the benefits of no-take marine protected areas (MPAs) is developing rapidly (Roberts and Hawkins 2000; Gell and Roberts 2002). MPAs should reduce fishing pressure on target species, resulting in greater density, individual size, biomass, and fecundity of species targeted by fisheries (Bohnsack 1998; Roberts and Hawkins 2000; Gell and Roberts 2002; Russ 2002; Halpern 2003). Adjacent fisheries may benefit from MPAs due to spill-over (net export) of adult individuals (Russ and Alcala 1996; Zeller and Russ 1998; McClanahan and Mangi 2000; Roberts et al. 2001; Galal et al. 2002) and net export of propagules via larval dispersal (Stoner and Ray 1996; Roberts 1997; Gell and Roberts 2002).. The Great Barrier Reef (GBR), on Australia’s east coast, is the largest managed tropical reef marine park in the world. The total area of the World Heritage site is approximately 348,000km2, equal to the total land area of Japan. The benefits of MPAs on the GBR have come under intense scrutiny during the recent implantation of the Representative Areas Program (RAP). RAP was designed to protect at least 20% of each of 70 different bioregions in the Great Barrier Reef Marine Park (GBRMP) (30 reefal and 40 non-reefal) (Day et al. 2003). To achieve this, the Great Barrier Reef Marine Park Authority (GBRMPA), with input from scientists, commercial and recreational fishers, tourist operators and the broader community, expanded the current level of no-take protection on the GBR from 4.6% to 33.4% of the park area. Opposition to the expansion, by fishing lobbies, was very strong. To win the support of these groups evidence was required that suggested the current MPAs, implemented mostly in. 9.
(41) the mid 1980’s, were effectively sustaining, and perhaps even increasing, fish stocks targeted by fishers.. A substantial recreational fishery for reef fish occurs on the GBR (Goggin et al. 2002). Plectropomus spp. (Serranidae: Epinephelinae), known locally as coral trout, are a primary target of this recreational fishery on GBR coral reefs (Goggin et al. 2002). In 1997 and 1999 the annual recreational harvest of coral trout in Queensland was estimated from surveys of recreational fishers at 315 tonnes (Williams 2002). This recreational fishery is largely concentrated on near shore areas, due to the small size of most of the vessels involved (4-6m) (Goggin et al. 2002). The present study was conducted in these near shore areas. A much larger commercial hook and line fishery exists on offshore, rather than near shore, reefs of the GBR (Goggin et al. 2002). The total landing of this commercial fishery in 2000 was approximately 4,600 tonnes (Williams 2002). Plectropomus spp. are the primary target of this commercial fishery, comprising 40-45% of the fishery catch by weight. Commercial line fishing effort has doubled over the past decade, due to the increased demand of the live reef fish markets throughout Asia (Goggin et al. 2002).. Russ (2002) reviewed 22 studies of spatial comparisons of density, biomass and mean size of large predatory reef fish between MPAs and fished locations. He reported that 36% of studies had significantly higher density, 60% a greater biomass, and 73% a higher mean size in MPAs than in fished locations. More recently Halpern (2003) reviewed the literature on 80 different MPAs. He concluded that most of the MPAs had greater density (66% of studies), biomass (84% of studies) and average size (83% of studies) of carnivorous fish.. Studies of the effects of MPAs on abundance of Plectropomus spp. on the GBR are somewhat contradictory. Craik (1981) and Goeden (1978) demonstrated higher density and average size. 10.
(42) of Plectropomus spp. in MPAs than fished areas around Heron Island, which was protected in 1975. However, several other early studies found no significant differences in coral trout densities between MPAs and fished areas (e.g. Ayling and Ayling 1984, 1986; Ayling et al. 1993). Williams and Russ (1994) summarised the results of 24 separate studies of the effects of MPAs on reef fish populations on the GBR. Most of these studies used underwater visual census (UVC). Closures to fishing were of only 3 to 4 year’s duration in most studies. While the evidence for increased average size was good, Williams and Russ (1994) concluded that the effect of MPAs on density of Plectropomus spp. was “equivocal”. A good example of such results was the study of Mapstone et al. (1997). They used visual census to compare 10 no-take reefs with 14 fished reefs in the Cairns section of the GBRMP and concluded that, after 8 years of no-take zoning, there was virtually no difference in the density of Plectropomus spp. between MPAs and fished areas. Ayling et al. (2000) concluded that there were no significant differences in densities of Plectropomus spp. between MPAs and fished areas along much of the GBR. Mapstone et al. (2003) used UVC to compare density of both legal-sized (>=38 cm TL) and below legal sized (<38cm TL) Plectropomus spp. in no-take and fished areas offshore, spread across four regions of the GBR (spanning 7o of latitude) over a 6 year period (19952000). Density of legal-sized Plectropomus spp. was significantly higher in no-take than fished areas in only 7 of the 24 combinations of region (4) and years (6). The mean difference in density was ~50% higher in MPAs in the one region with the most consistent difference over the 6 years (Mapstone et al. 2003). Counter to this result, sub-legal Plectropomus spp. had significantly (by ~10%) higher density in fished than MPAs across all regions and years (Mapstone et al. 2003).. Recently, Williamson et al. (2004) used UVC to show that inshore reefs of the GBR, which have high recreational fishing pressure and relatively effective surveillance (Davis et al. 2004), have almost 5 times the biomass of Plectropomus spp. in MPAs than fished areas after 12-13. 11.
(43) years of protection (1999/2000). This difference has remained consistent from 1999 to 2008 (Williamson et al. unpublished data). Furthermore, such large differences in biomass of Plectropomus spp. between MPAs and fished areas on these inshore reefs results in detectable differences in the community structure of prey fish of Plectropomus spp. (Graham et al. 2003).. Although UVC comparisons of density of Plectropomus spp. between no-take and fished areas are inconclusive, one pattern that is consistent is higher catch rates of experimental hook and line fishing in no-take than fished areas (Ferreira and Russ 1995; Zeller and Russ 1998; Mapstone et al. 2003). Mapstone et al. (2003) reported 2-2.5 times higher catch rates in no-take than fished areas over 6 years in 3 of the 4 regions of the GBR that they studied. A second consistent result is higher than average size of Plectropomus spp. in MPAs than fished areas (e.g. Williams and Russ 1994; Ayling et al. 2000; Mapstone et al. 2003). Evidence that MPAs increase average age of Plectropomus spp. are however, inconclusive, with no difference (Ferreira and Russ 1995), or small but spatially inconsistent differences, reported (Adams et al. 2000; Mapstone et al. 2003).. The type and structure of the benthic habitat can influence the distribution and abundance of coral reef fish (Rakitin and Kramer 1996; McClanahan and Arthur 2001). However, McClanahan and Arthur (2001) found that protection from fishing on Kenyan reefs had a larger effect on abundance of reef fish than did benthic habitat. Clearly, fishing can have a direct effect on abundance of targeted species, but can also affect abundance indirectly if such fishing alters benthic habitat. To determine effects of protection from fishing by MPAs unequivocally, habitat differences between MPAs and fished sites should be accounted for.. The aims of this study were to compare the density and biomass of Plectropomus spp. (coral trout), Lutjanus carponotatus (Lutjanidae) (both targeted by fishing on the GBR), and two non-. 12.
(44) target (control) species (Siganus doliatus: Siganidae and Chaetodon aureofasciatus: Chaetodontidae), between MPAs and fished areas of three inshore island groups of the Great Barrier Reef Marine Park.. 2.2 Study Areas The Great Barrier Reef Marine Park Authority (GBRMPA) in Australia was established in 1975, and Marine Park zoning was first implemented formally in 1981 in the Capricornia (southern) section of the park. The original multiple-use zoning plan for the entire GBR had been in place since 1988 (Williams and Russ 1994). Zoning within the GBRMP allows different user groups varying levels of use, ranging from fully preserved (“Preservation zone”), to open access (all fishing, including trawling, allowed). Under the original zoning plan 23.3% of nearly 3000 reefs were in the ‘green’ zones or “no- take” marine protected areas. However, only ~ 4.6% of the total area of the Marine Park had complete no-take protection under the original zoning plan. Thus, whilst many reefs were no-take, they accounted for a very small percentage of the marine park. Furthermore, most of the no-take area was either well off the coast (50-90km), or concentrated in the sparsely populated far north of the GBRMP. The inshore area, where recreational fishing is concentrated, had relatively few MPAs.. The three island groups in this study- Palm, Whitsunday and Keppel (Figure 1), all have international resorts and cater for many other tourist activities, such as diving, snorkeling, yacht charters, fishing and sightseeing. Orpheus Island, in the Palm Group, also has a research station in operation year-round. Accessibility to all three island groups by recreational users makes them very popular, thus placing them under more regular and intensive recreational fishing activities than the mid- and outer-reefs (Higgs and McInnes 2003). The close proximity of these island groups to the coast, and the presence of tourist resorts, ensures that surveillance of. 13.
(45) the MPAs by Queensland Parks and Wildlife Service (QPWS) vessels is likely to be better than that on offshore reefs (Davis et al. 2004).. Figure 2.1: Map of the Queensland Coast and the three Island Groups-Palm, Whitsunday and Keppel Islands. No-take marine protected areas and fished areas are shown. Black dots indicate sampling sites.. 14.
(46) 2.3 Methods Sampling was carried out in the Whitsunday Islands (20°08’S, 146°56’E) in December 2001, in the Palm Islands (18°34’S, 146°29’E) in April 2002, and in the Keppel Islands (23°10’S, 150°57’E) in October 2002 (Figure 1). The differences in sampling times confound the study somewhat. For example, Plectropomus spp. generally settle onto reefs of the GBR around January/February (Ferreira and Russ 1994; Mapstone et al. 2003), but may not be detected by visual census methods designed to sample adult fish until much later that year. Thus we may have been able to detect 2002 recruitment of Plectropomus spp at the Keppels, but not at the Palms and Whitsundays. Note also that Plectropomus spp. can potentially live for up to 14 years or more (Ferreira and Russ 1994). In 2001/2002 the MPAs in these island groups had been ‘zoned’ MPAs for approximately 14 years. Sampling in the Whitsunday Islands in December was carried out on full moons to reduce the chances of sampling of Plectropomus spp. during their new moon spawning aggregations (Samoilys 1997). The reef flats at all three island groups are exposed during astronomically low tides, with a reef slope that ranges from gentle to vertical walls, with high structural complexity. The bottom of the reef slope varies in depth from 5m to 20m. Data on the abundance of fish and benthic organisms were collected by underwater visual census (UVC) along the reef slope at a depth of 5-10m.. Plectropomus leopardus and P. maculatus (Serranidae) are the most common coral trout found in the sampling area. The line fishery targets both species equally, so the two species were grouped together as Plectropomus spp. in this study. Plectropomus spp. are commonly referred to as ‘coral trout’.. The most abundant secondary target on inshore islands is Lutjanus. carponotatus (Lutjanidae), commonly known as stripey. This species was chosen to test whether fishing on inshore reefs has an effect on a secondary target species. Two non-target species were also chosen as controls, Siganus doliatus (Siganidae) and Chaetodon. 15.
(47) aureofasciatus (Chaetodontidae). These species feed on algae and hard coral, respectively, and are never caught by hook and line or speared on the GBR.. 2.3.1 Data Collection Data was collected at six randomly selected sites in each MPA and fished areas in the Keppel Islands. We sampled 12 randomly selected sites per MPAs and fished areas in the Palm and Whitsunday Islands. The available area of MPAs was smaller in the Keppels than at the other two island groups (Fig. 1). To maintain a balanced sampling design, the six sites used in this study were chosen randomly from the original twelve per zone at both the Palm and Whitsunday Island groups. Within each of the sites, Underwater Visual Census (UVC) was conducted on scuba along five transects of 50m*6m (300m2). The same observer (RE) made all fish counts and size estimates. Total length was estimated by placing target species of fish into 5cm size classes. Training in size estimation of fish was carried out at the start of each day, using wooden fish models of known length. Biomass was estimated from published biomasslength relationships from Fishbase (Froese and Pauly 2002) for L. carponotatus, and from Ferreira and Russ (1994) for Plectropomus spp. The surveys did not proceed if visibility was less than 4m, and typically ranged from 4-15 metres.. On the GBR, the minimum length of Plectropomus leopardus and P. maculatus that can be caught and retained legally on hook and line is greater than or equal to 38cm Total Length (TL). For this study, we considered Plectropomus spp. above and including the 36-40cm TL size class to be close to “legal-sized”. Although this size class includes fish 2cm below the legal size, it gives a more appropriate estimate than using the 41-45 cm size class. The latter would exclude fish up to 3cm above legal size in the density and biomass estimates. The legal. 16.
(48) minimum size for L. carponotatus is 25cm TL. In this study the 26-30cm size class was legal size.. Benthic habitat data were collected from the transects used to make the fish counts. Firstly, structural complexity of the substratum was estimated whilst swimming the transects. A predetermined structural complexity index (from 1-5) was assigned to each transect (Table 1). Secondly, a line intercept technique was used to estimate cover of benthic categories. These categories were recorded every two metres along the 50m transect tape. Benthic categories included several hard coral morphologies (branching, massive, digitate, plate, foliose, encrusting), soft coral, algae, rubble, sand, and ‘other’. The ‘other’ category included sponges, zoanthids, anemones, clams and seagrass. Categories were recorded as either dead or alive.. Table 2.1: Categories of structural complexity of the benthic substratum. 1. Flat, sandy, rubble with a few bommies (coral heads).. 2. Bommies amongst mostly rubble. <45° reef slope. Rubble amongst mostly coral bommies. ~45° reef slope. Good coral structure with some overhangs. >45° reef slope.. 3 4 5. High coral complexity, large holes and caves. Vertical wall.. 2.3.2 Data Analysis The fish transect data contained many zero estimates for some species, and often did not conform to the assumptions of ANOVA. Thus, all fish transect data were pooled to site level (5 transects per site). Since the focus of this study was on variation between MPAs and fished areas and island groups, rather than within sites, pooling did not affect the comparisons of major interest. Thus all data were analysed with a two-factor orthogonal design, using two zones (MPAs and fished), three island groups (Palm, Whitsunday and Keppel Island groups),. 17.
Figure


+7


Outline
Related documents
Parent Discipline Leadership Field of Study Major approaches to Leadership Immediate Disciplines School Leadership Decision-Making Job Satisfaction Research Boundary Public
Notably, these interesting responses to specific 2-BP doses were not unique to 17cl1 cell cultures, since we observed a parallel pattern of decreasing virion infectivity and
List of Tables Table 2.1 Media and conditions of growth employed in this study to culture cyanobacteria associated with red band and BBD infected corals from Palauan reefs - 44
The selective destruction of CXCR4 ⫹ lymphocytes by the X4 clone and CCR5 ⫹ lymphocytes by the R5 clone further demon- strates their CoR specificity in vivo and shows that in
This is to certify that the dissertation entitled “A NERVE CONDUCTION STUDY IN HYPOTHYROID PATIENTS WITH SYMPTOMATIC Vs ASYMPTOMATIC PERIPHERAL NEUROPATHY IN
To determine whether C-mer activation plays a role in R-mediated lytic EBV gene expression, latently infected, EBV-positive D98/HE-R-1 cells were transfected with the control
This is to certify that the dissertation - “ A COMPARATIVE STUDY OF BENIGN VOCAL CORD MASS LESIONS USING VIDEOSTROBOSCOPY, VOICE ANALYSIS AND VOICE
2 Evolution of the ratio between the number of patient-days in elderly aged over 75 with an administration of at least three psychotropic drugs on the same day during hospital
