How people seek information when their community is in a disaster
Barbara Ryan, University of Southern Queensland
Abstract
Purpose: To research information seeking behaviour and discover sources used by people whose community was in a disaster and what they wanted to know.
Design: In-depth interviews were conducted with 37 people in three communities that had suffered a disaster in the previous 12 months. The study covered St George in Queensland (flood), Airlie Beach in Queensland (cyclone) and Gerogery in NSW (bushfire). The interviews were transcribed and then analysed using the constant comparative technique (Wimmer & Dominick 2000).
Findings: There were clear preferences for information sources that differed between disaster types. Those in a bushfire found out about the fire by seeing the smoke or were notified by friends. Radio was a preferred source, for cyclone and bushfire, but in the Gerogery case radio was unable to supply reliable or up-to-date information. In flood and cyclone, the Bureau of Meteorology was the most cited source and was the way many people discovered they were facing a flood or a cyclone. In a flood, a visual of the river and the person’s own experience or the flood experience of friends, family or neighbours were then drawn upon to interpret the possible effects on the individual. Radio was not a well used source of
information in this particular flood. In a cyclone, however, radio was the second most popular source of information, particularly after the power went out and especially those stations featuring talk back from community members about local cyclone damage and other news. In the bushfire and cyclone, mobile phones were a constant tool for contact with others. Few used their mobile phones to get onto the web and only one person in Airlie Beach used Facebook as a source of information about the situation. Twitter was not used at all.
In all disasters, location, timing and strength/peak was the most prevalent information sought, followed by whereabouts and safety of friends, neighbours and family.
Practical implications: The Bureau of Meteorology provides an effective source of information for communities potentially affected by flood and cyclone. Flood mapping should also be a standard feature of local council communications. In cyclones, mobile phone service should be a priority and post-impact agency recovery texts be used. Radio should continue to be proactively used by agencies as a primary tool in order to build up trust in that media. In a bushfire situation, text or phone messages could be utilised more often for reporting of the location and direction of the fire and radio stations need to be proactively kept up to date.
For all disasters, mobile phones featured as a primary tool that was accessed by all
interviewees. This points to the importance of developing mobile phone message technology that is not subject to delays or interruptions.
This study on information-seeking may provide data on which better communication plans can be built by emergency agencies.
Keywords: flood, bushfire, cyclone, river heights, tracking, radio, community networks, information-seeking, information source, messaging, community communication, emergency agencies, police, SES, Rural Fire Service, Bureau of Meteorology.
Background
Summer 2009-10 in Australia produced the usual bushfires, cyclone and floods.
On December 17, 2009, a fire started at the tip at Walla Walla, a small community about 30kms north of Albury. It was a high fire danger day at 37 degrees Celsius, 10% humidity and winds of 45-60kph and the fire soon zig-zagged its way south east to the community of Gerogery, traveling 11kms in one hour (Alexander 2010). Five homes were destroyed, 5,500ha were burnt, a large number of cattle and sheep lost and two firefighters injured ('Fire whirl: The startling Riverina bushfires' 2010).
In Queensland, widespread rain in February and March, 2010, resulted in flooding of the Balonne and Moonie River systems in south western Queensland. The flood particularly affected the Balonne Shire community where the Balonne and Moonie Rivers peaked, the Balonne at 13.28m at St George on March 6 (Norman 2010). Twenty houses were inundated in St George and St George Hospital and Warawee Aged Care Home evacuated. Just over two weeks later on Saturday, March 21, category 3 Cyclone Ului crossed the coast at Airlie Beach, passing directly over the tourist town at 1.30am (Bureau of Meteorology 2010). About 30 homes and buildings were damaged, 60,000 households were left without power and extensive vegetation blown onto roads and property.
The population of Balonne Shire, in which St George is the major centre, is 4,627 and the industry predominantly agriculture (Australian Bureau of Statistics 2007c). Gerogery has a population of 979 and is also a farming community (Australian Bureau of Statistics 2007b). Airlie Beach has a population of 2,751 and the dominant industry in the town is hospitality and tourism (Australian Bureau of Statistics 2007a).
The questions used during the interviews were developed from a review of existing literature and particularly related to seeking problem-specific information and the information-seeking model proposed by Savolainen (1995; 2008). This model considered information pathways rather than just sources and was one of the first attempts to describe information-seeking for a specific problem other than academic research or web searching (Case 2008). In particular it recognises the importance of context in information-seeking, an aspect that could be valuable when considering different disaster types. There is not room within the guidelines for this paper to expand further on the literature review.
Methodology
This research is part of a larger project that includes a literature review, the in-depth interviews conducted for this project, and an omnibus survey of 1200 respondents to be undertaken by telephone in Queensland later in 2011. The questions for the survey will be developed from this project. The reason for the survey is the difficulty in making
into how and why people do certain things, the survey will tell us how applicable this is to the general population (Phillips 2002).
This research was designed to consider information seeking pathways and sources during the impact and dislocation periods of a disaster, although for the purposes of interviewee
narrative and drawing more information from interviewees, questions were asked about the detection of the threat phase through to the reaction and remedy phases.
In depth interviews were conducted within each community between October and December 2010. A statistical profile of each community was developed and efforts made to recruit respondents to correlate with the profile. Interviewees were recruited through contacts who were local to the area and via staff within local government. As each person was interviewed they were asked if they could recommend friends or neighbours who might be interviewed.
All interviews were face to face and were conducted at St George between Monday, October 11 and Friday, October 15. At Airlie Beach, they were held between Monday, October 24 and Friday, October 29 and at Gerogery between Wednesday, December 8 and Monday, December 13.
[image:3.595.84.510.368.719.2]The following tables provide a picture of the profile of each community and the profile of the interviewees for that community.
Table 1 - Balonne Shire community and interviewees profiles
Feature Percentage of
Balonne Shire population
Target number of interviewees
Number achieved
Gender
Male 51.2% 8 4
Female 48.8% 7 9
15 13
Ethnicity
Non-indigenous 85.1% 13 11
Indigenous 14.9% 2 2
15 13
Age
18-24 years 15.1% 2 1
25-54 years 57.6% 9 8
55-64 years 13.6% 2 2
65 years and over 13.7% 2 2
15 13
Employment
Employed 73% 11 10
Unemployed/not in workforce/retired
27% 4 3
15 13
Industry of occupation As a percentage of employed Agriculture & support
services
32.9% 5 5
Education 6.5% 1 1
Other 60.7% 5 4
11 10
Feature
Percentage of Airlie Beach
population 18+
Target number of interviewees
Profile of interviewees
Gender
Male 51.2% 8 6
Female 48.8% 7 5
15 11
Ethnicity
Non-indigenous 99.2% 15 11
Indigenous 0.8% 0 0
15 11
Age
18-24 years 17.9% 3 0
25-54 years 62.6% 9 8
55-64 years 13.0% 2 1
65 years and over 6.5% 1 2
15 11
Employment
Employed 79.7% 12 9
Unemployed/not in workforce/retired
19.5% 3 2
15 11
Industry of occupation As a percentage of employed
Hospitality/tourism 26.1% 3 5
Residential construction 3.7% 1 0
Other 70.2% 8 4
[image:4.595.84.505.72.419.2]12 9
Table 3 - Gerogery community and interviewees profiles
Feature Percentage of Gerogery
population 18+
Target number of interviewees
Number achieved
Gender
Male 51.6% 8 5
Female 48.4% 7 8
15 13
Ethnicity
Non-indigenous 98.6% 15 13
Indigenous 1.4% 0 0
15 13
Age
18-24 years 13.8% 2 0
25-54 years 55.4% 8 9
55-64 years 18.8% 3 3
65 years and over 12.0% 2 1
15 13
Employment
Employed 71.8% 10 12
Unemployed/not in workforce/retired
28.2% 5 1
15 13
Industry of occupation
As a percentage of employed
Education 8.5% 1 5
Hospitals 3.2% 1 2
Other 67.1% 8 3
12 12
The tables show the lack of representation of people aged 18-25. Appointments were made with six suitable respondents across three communities, but only one interview was
undertaken. While income and education were not identified in the profile of interviewees, it was felt by the researcher that people of the lower socio-economic section of the community were also under-represented despite community contacts working hard to secure interviews with people from this segment. It was felt that for future research including these segments of the community, payment should be made to respondents to encourage wider participation.
Respondents were interviewed in their homes, at work or at a convenient meeting place for the interviewee. Interviews lasted between 15 and 40 minutes and were recorded. The recordings were transcribed and the transcripts used to undertake analysis. Respondents were interviewed by themselves or with their partner. This situation necessitated careful guidance of the interview to make sure each partner was able to answer all of the questions. The benefit of interviewing couples was that memory was often reactivated in one person by what the other was saying and the points of view of more people could be canvassed in the time available.
The interview questions fell into three categories: where people got information about the flood, bushfire or cyclone; what sort of information they were looking for; and whether they were successful in obtaining that information.
The length of each incident was defined for the purposes of this research as from the time the threat was identified by interviewees to:
The end of the Gerogery fire as defined by Rural Fire Service at 8pm on the day of the fire although the RFS did not lift its emergency classification until three days later (Alexander 2010);
One day after peak flood levels at St George;
Two days after Cyclone Ului crossed the coast at Airlie Beach.
These definitions were “self-setting”, as these time periods seemed to be when many interviewees stopped looking for information about the incident.
Analysis
The interview transcripts were analysed using constant comparative technique, explained by Wimmer and Dominick (2000) as a process with four steps:
1. Comparative assignment of incidents to categories 2. Elaboration and refinement of categories
3. Searching for relationships and themes among categories
4. Simplifying and integrating data into a coherent theoretical structure
At the time of writin further analysis by computer aided qualitative data analysis software had yet to be undertaken – it is intended that this analysis will be completed before the EMPA conference using Leximancer in order to better show relationships between categories and units.
The most significant category to emerge was the searching process from the time
interviewees realised there was a threat to the time they believed the incident was no longer a threat. Interviewees identified their sources and the process they used to gather information.
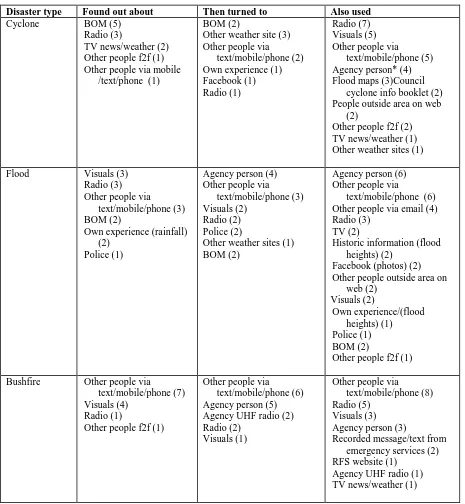
[image:6.595.84.549.192.696.2]Patterns emerged according to the type of disaster.
Table 4 - Information sources
Disaster type Found out about Then turned to Also used
Cyclone BOM (5) Radio (3)
TV news/weather (2) Other people f2f (1) Other people via mobile
/text/phone (1)
BOM (2)
Other weather site (3) Other people via
text/mobile/phone (2) Own experience (1) Facebook (1) Radio (1)
Radio (7) Visuals (5) Other people via
text/mobile/phone (5) Agency person* (4) Flood maps (3)Council
cyclone info booklet (2) People outside area on web
(2)
Other people f2f (2) TV news/weather (1) Other weather sites (1)
Flood Visuals (3) Radio (3) Other people via
text/mobile/phone (3) BOM (2)
Own experience (rainfall) (2)
Police (1)
Agency person (4) Other people via
text/mobile/phone (3) Visuals (2)
Radio (2) Police (2)
Other weather sites (1) BOM (2)
Agency person (6) Other people via
text/mobile/phone (6) Other people via email (4) Radio (3)
TV (2)
Historic information (flood heights) (2)
Facebook (photos) (2) Other people outside area on
web (2) Visuals (2) Own experience/(flood heights) (1) Police (1) BOM (2)
Other people f2f (1)
Bushfire Other people via
text/mobile/phone (7) Visuals (4)
Radio (1)
Other people f2f (1)
Other people via
text/mobile/phone (6) Agency person (5) Agency UHF radio (2) Radio (2)
Visuals (1)
Other people via
text/mobile/phone (8) Radio (5)
Visuals (3) Agency person (3)
Recorded message/text from emergency services (2) RFS website (1)
Agency UHF radio (1) TV news/weather (1)
*“Agency person” means SES, local council or Sunwater staff.
SEA FM, evenly spread between respondents. Information seeking at Airlie Beach stopped either when the power went out late on Saturday March 21 or when radio stations stopped giving live bulletins late at night and generally started again the next morning after interviewees had looked around outside. From that time, those that used radio commented that reporters on the ground and call-ins from people around the area gave them the most valuable information that allowed them to construct a picture of the damaged area and then put into context some time frames for restoration to normality.
In St George, people first heard about the flood from a number of sources or realised that the river would flood as they saw the water get higher, then sought information from other people and any agency contacts they had and returned to those sources for regular updates. Agency sources were reported by four people as their confirmation point and six interviewees used agency sources as a constant source. Other people were also a constant source:
“There were lots of people in town and I think there was lots of people ventured out in the beginning to find information...but it was mainly just talking to one-another on the street – we probably met all our neighbours in that few days, everyone was out doing their furniture or packing or sandbagging or out in the street checking everyone else” (SGF2, 2010).
Visuals were an important confirmation tool during each event, with 20 of the 37 people interviewed using visuals as a source of information.
In St George, ABC local radio was the main radio source with one mention of a Roma commercial station, although five of those who used radio commented that it was either behind the times or concentrating on the Balonne River with no news of the Moonie. At least one interviewee hoped that people upstream on the Moonie would ring the ABC with news so she could work out what was happening further downstream at her own property. For those isolated from St George but still on the Balonne River, the ABC was an important source of information, particularly those without power. As SGF1 (2010) reported:
“(We listened to) Radio because it seemed up-to-date and they were doing one every 15 minutes or something pretty regular, every 15 or 30 minutes because they actually had a bloke in St George, Charleville and Roma and very much what they were saying they were getting from the locals.”
A number of people reported seeing or hearing of a flood map distributed by Balonne Shire Council, and in the previous tables, the source is recorded as an agency person. The map was helpful and seemed to contribute to the need for visual confirmation that featured across all three disasters.
At Gerogery, the most prevalent primary source of information was other people, followed by visuals (seeing the smoke). Every interviewee then contacted other people for information and to pass on information. Nine of the interviewees did not listen to radio at all.Four people turned eventually to radio, listening to ABC local radio, Radio 104.9 and 2AY. Each
commented on the inaccuracy of the geographic information and/or the lack of currency of information. There seemed to be some confusion about the location of the fire, which was on Gerogery West Road near Gerogery, but actually reported on radio as Gerogery West. One respondent said:
“But the biggest worry was listening to the wireless they kept saying it was Gerogery West and I could see the smoke was up at Gerogery itself, but no, only that a neighbour rang up who had a relative in Gerogery West said he said it was on (the property of a Gerogery family) and God! That’s what I thought” (GF1, 2010)
The predominant source at any stage of the disaster was of friends, family and neighbours with every respondent mentioning such contact in their information seeking pathway. Four interviewees commented that they were too busy defending their property to be actively looking for information but that people rang them on mobiles and from those calls they received a form of update. Four people at Gerogery complained that the information received by radio was wrong, and it did cause some angst amongst those with friends and family in the area or who were trying to evacuate their family. One respondent had directed her son to her property at Gerogery because the radio reports said the fire was at Gerogery West.
“The only time I really panicked, it was the fact that I had sent my child, thinking that it was a million miles away when it was actually in my backyard” (GF2, 2010).
This respondent lost her woolshed, which was 50m from the house.
Another respondent said she had no idea where to go after evacuating and sat in her car alongside the Hume Highway until a neighbour came along and they made a plan together.
What people were looking for
[image:8.595.91.513.438.640.2]A second category centred on the type of information people sought, which was similar across disaster types. Information about the event, where it was and when it would peak/hit/reach the interviewees was the most prevalent, followed by information about the safety of family and friends. However, other themes emerged within this category including location of safe places, road closures, how workplaces fared, when the power would be back on, when other places would peak (in the case of a flood).
Table 5 - Information sought
Disaster type Information sought Cyclone –
pre-impact
Track of the cyclone, category, wind speeds, crossing location (4) Checking on friends and family (5)
Responding to concern of friends and family (5)
Cyclone post-impact
When the power would be back on (3)
Getting post-cyclone supplies and equipment (6) When airport would be operating (2)
Damage information (7) Flood Flood peak information (12)
Information from neighbouring towns and close by rivers (2)
What the flood peak information meant for the individual (what’s going to happen) (1)
Bushfire Where the fire was and where it was going (7) Whether family and friends were OK (3)
Where there was somewhere safe to evacuate to (1) Road closures (1)
What they found
Across the disaster types, the majority of people thought that their patterns of information seeking and the sources they used were the best available, although the most satisfied were those in the slower moving disasters, flood and cyclone. The Bureau of Meteorology seemed to be a trusted and respected source, although in St George several interviewees commented on faulty river gauges delivering information that required reinterpreting with the help of local knowledge. These comments were delivered as matter of fact and did not seem to dent BOM’s reputation with these people as a source of information. In addition, in the flood and cyclone situations, certain experienced locals were considered an important source, usually older people or those with a scientific approach, although there seemed to be some filtering of this source with one respondent commenting that he would know next time which of the experienced locals to go to for information.
Of the cyclone, one respondent commented: “It was just a waiting game. Beforehand I think we had perfect information.” ABM1 (2010) commented:
“I think we handled it very well and I think the information we got was as good as is available to be delivered, so yeah, other than finding a source to give you information on when power is restored, which I don’t think is available, then no, we’d do the same again.”
Of the flood interviewees, nine of the 13 interviewed said they would do the same again in terms of looking for information and the type of information they sought. One person thought they might pay more attention to Council information during a future flood.
10 of the 11 interviewees who went through Cyclone Ului thought they would do exactly the same thing again, although a few commented that they would be better prepared to recharge their mobile phones next time a cyclone approached.
Many of the interviewees at Gerogery, however, thought they would add other sources to their search pattern, with only four thinking they might repeat their information searching patterns. The suggestions for more successful information-seeking including telephoning neighbours, getting a two-way radio to listen to the RFS traffic, listening to ABC local radio, listening to radio generally on “bushfire days” and getting online, particularly onto the RFS website.
Other themes
Police were mentioned across all locations as a possible but disappointing source of information. At Gerogery, seven people commented that police were manning road blocks but did not seem to know much, despite being the only source of information for people waiting at those road blocks to get to their homes. At St George, four interviewees
commented on police who were canvassing neighbourhoods that were to be evacuated, using words such as “bombastic” and “panicked” in relation to the police approach. Again, police at St George were unable to give concrete information and without exception, interviewees continued the course of action they were on when the police arrived, relying on visuals of the water heights and the knowledge of their own or experienced locals to tell them when to finish packing and leave. According to SGM1 (2010), who emerged as an important source of information for three other interviewees because of his active use of GPS technology to do rough surveys during the flood:
throwing her weight around. She could see I was packing the trailer and ready to get out...”
The local knowledge and the historical aspects were also very important to the flood and cyclone interviewees. In St George, which, from anecdotal evidence from the interviewees is an old community with relatively few newcomers, the experiences of those who had been through any floods since the 1950s was well respected and an important source for processing individual interpretations of what the flood heights would mean. In Airlie Beach, which seems to be a community of more newcomers than born and bred locals, fishermen and established locals, particularly those with some connection to the ocean, were mentioned as sources of integrity. At Gerogery there was no mention of historical factors, possibly because of the speed of the fire and the preoccupation of interviewees with finding out where it was and where it was going.
Three of the 11 Airlie Beach interviewees commented on the value of the Whitsunday Regional Council cyclone information booklet, but two said that while the booklet was invaluable for preparation, it did nothing to prepare residents for what to expect during the impact of the cyclone. ABM1 (2010) said:
“The general consensus from the community here for those that hadn’t been through a cyclone before, there was high levels of anxiety...there is a fair amount in the media, print, radio and television, telling people what they should do...but doesn’t prepare them for what they are going to be feeling and thinking. I think it would be good to prepare people more
psychologically for what they are going to go through than just taping up your windows and making sure you have got food in the fridge...”
Conclusions
While the data collected here needs to be confirmed or refuted by a large survey in order to allow legitimate generalisations to be made across the Australian
population, a few cautious and preliminary observations and recommendations might be drawn from the interviews.
1. Agencies need to publicise methods for residents to secure information during a disaster, particularly in bushfire where it did not seem to occur to the community that the RFS website and Twitter feeds to mobile phones might be a source of information.
2. The Gerogery experience shows that it is critical for agencies to
proactively contact radio stations at regular intervals to give recorded or live to air updates as opposed to a media advisory to be read out by announcers. Communication managers at such organisations need to use this and other research to lobby for the resources to allow this to occur. 3. Councils in flood areas should have flood maps ready for distribution to
residents during a flood, similar to those made available by Brisbane City Council earlier this year.
4. Agencies need to check with their local staff that messages containing locational information are correct and ask media to repeat the information verbatim, in order to prevent subtle changes to place names that can cause confusion.
5. Police manning roadblocks should be given up-to-date information on the disaster that they can impart to local residents, thereby making their job less confrontational.
residents in order to reinforce the message and allow people to process the information according to what it means for them. Such training and tools should allow police to move more quickly through neighbourhoods by anticipating people’s questions and the need for people to confirm what they are hearing.
7. Bureau of Meteorology flood gauges should be tested and maintained to ensure they work, particularly in urban areas where residents do not have local knowledge to realise that gauge readings on the BOM website could be faulty.
8. Mobile phones were the primary communication tool in each disaster. Research and development of this technology to eliminate the delay of texts and to cope with the added traffic volumes that are generated around disasters need to be a priority. In addition, Australians need to be trained to use text messages rather than mobile phone calls into and out of disaster zones.
Bibliography
Alexander, G 2010, Gerogery bushfire, Interview edn, Albury, NSW, 28 June.
Australian Bureau of Statistics 2007a, 2006 Census Quickstats: Airlie Beach, Australian Bureau of Statistics, Canberra.
---- 2007b, 2006 Census Quickstats: Gerogery, Australian Bureau of Statistics, Canberra.
---- 2007c, 2006 Census QuickStats: St George (Qld), Australian Bureau of Statistics, Canberra.
Bureau of Meteorology 2010, Severe Tropical Cyclone Ului, Bureau of Meteorology, viewed 15 June, 2010 2010.
Case, DO 2008, Looking for Information: A Survey of Research on Information Seeking, Needs, and Behaviour, 2nd edn, Library and Information Science, Emerald, Bingley, UK.
Cohen, E, Hughes, P & White, PB 2007, 'Media and bushfires: A community perspective of the media during the Grampians Fires 2006', Environmental Hazards, vol. 7, no. 2, pp. 88-96.
'Fire whirl: The startling Riverina bushfires', 2010, Bushfire Bulletin: the journal of the NSW Rural Fire Service, vol. 32, no. 1, pp. 4-6.
Greenberg, BS, Hofschire, B & Lachlan, K 2002, 'Diffusion, Media Use and Interpersonal
Communication Behaviours', in BS Greenberg (ed.), Communication and Terrorism: Public and Media Responses to 9/11, 1st edn, Hampton Press, Cresskill, New Jersey, p. 377.
King, D & Goudie, D 1997, Breaking Through the Disbelief - The March 1997 Cloncurry flood: A report for the Queensland Department of Emergency Services, James Cook University, Townsville.
Norman, S 2010, St George floods 2010, Interview edn, St George, 1 June.
Piotrowski, C & Armstrong, TR 1998, 'Mass Media Preference in Disaster: a study of Hurricane Danny', Social Behavior & Personality: An International Journal, vol. 26, no. 4, p. 341.
Roeser, J & Schaefer, G 2002, 'Media Use in Germany around the Attacks in the United States', in BS Greenberg (ed.), Communication and Terrorism: Public and Media Responses to 9/11, Cresskill, New Jersey, vol. Hampton Press, p. 377.
Savolainen, R 1995, 'Everyday life information seeking: Approaching information seeking in the context of "way of life"', Library & Information Science Research, vol. 17, no. 3, pp. 259-94.
---- 2008, 'Source preferences in the context of seeking problem-specific information', Information Processing & Management, vol. 44, no. 1, pp. 274-93.
Seeger, MW, Vennette, S, Ulmer, RR & Sellnow, TL 2002, 'Media Use, Information Seeking and Reported Needs in Post Crisis Context', in BS Greenberg (ed.), Communication and Terrorism: Public and Media Responses to 9/11, Hampton Press, Cresskill, New Jersey, p. 377.
Stempel III, GH & Hargrove, T 2002, 'Media Sources of Information and Attitudes About Terrorism', in BS Greenberg (ed.), Communication and Terrorism: Public and Media Respones to 9/11, 1st edn, Hampton Press, Creskill, New Jersey, p. 377.