Synthesis and characterization of modified Phenolic resins for
Composites with enhanced mechanical performance
F. Cardona
Centre of Excellence in Engineered Fibre Composites, University of Southern Queensland, Toowoomba, Australia
C. Moscou
Politech’Montpellier University, Montpellier, France
ABSTRACT: Resole phenolic resins were modified by forming copolymers with Cardanol, which is the main component of Cashew nut shell liquid (CNSL). The modified phenolic resins were prepared at various mole ratios of phenol to cardanol and the polymerization was carried out under basic conditions. In the synthesis a maximum content of 40% of Cardanol in the resin was possible to obtain, as a higher Cardanol content resulted in the formation of a resin with an extremely high viscosity. The effect of replacement of phenol by Cardanol on the thermal and mechanical properties of resole resins was experimentally investigated. An increases in the content of Cardanol resulted in a proportional increases in flexibility and the fracture toughness together with a decreases in the flexural modulus of the cured resins. The higher toughening effect of replacing phenol with Cardanol was obtained with the total Phenol:Formaldehyde ratio of 1.0:1.25 in the synthesis of the resin. Also a direct proportionality between the amount of Cardanol incorporated in the resins and the decreases in the crosslink density was observed.
1. INTRODUCTION
Phenolic resins have become a commoun product of the synthetic polymer industry for the past 80 years (Guionnet and Seferis, 1999) . These resins have been used extensively in the production of molded plastics, wood products, and aerospace components. In constructing aerospace components, the most important use of phenolic resins is in the manufacturing of high-performance composites (Knop and Pilato, 1985).
Typically, phenolic resins are thermosetting in nature and have properties of high-temperature resistance, infusibility, and flame retardance. Structures are widely variable, and the following conditions are known to affect the properties of the phenolic resin: the mole ratio of phenol to formaldehyde, reaction time, temperature, water content, and residual phenol content.
The reaction of formaldehyde with phenol can lead to either a resole or a novolak type of phenolic resin.
Figure 1. Chemical structure of Phenol, Formaldehyde and the structure of cured resole phenolic resin.
After the synthesis of the resole resin, this is cured by heating it to elevated temperature (150°C) or to lower temperature (80°C) with the aid of an acid catalyst. The cure proceeds through polycondensation reaction of the different substituted phenols, giving place to the formation of cured phenolic resin (Blackwood, 1955 and Francis, 1968), as shown in Figure 1.
The resin properties can be modified by
reacting phenol with other aldehydes, by etherification of phenol, and by using substituted phenols. The present investigation focused on modifying a phenolic resin by the partial substitution of phenol with Cardanol in the synthesis with formaldehyde. The purpose of these modifications was to prepare a more flexible resin, one even exhibiting rubberlike elasticity.Cashew nut shell liquid (CNSL) is a natural
product obtained from the shells of the cashew nut. In its natural form, crude CNSL is a mixture of different phenolic compounds. The main constituent is cardanol and alsothere are present anacardic acid and cardol. The structures of these components are shown in Figure 2.Because of the phenolic nature and unsaturation in the side chain, cardanol offers reaction sites on the aromatic ring and also on the side chain, which makes it a suitable raw material for variety of reactions. Cardanol reacts with active methylenes like formaldehyde or hexamethylene tetramine via the hydroxyl group and can undergo addition polymerization through unsaturation present in the side chain. Therefore, different type of resins can be synthesized from cardanol, and also from chemically modified CNSL (Aggarwal, 1961 and Kashani, 1978).
Anacardic Acid Cardol Cardanol
Figure 2. Chemical composition of CNSL.
2.EXPERIMENTAL ANALYSIS
2.1. Resin Synthesis
The modified phenolic resins were prepared with different mixtures of Cardanol and phenol reacting with formaldehyde in the presence of an alkaline catalyst. Phenol was replaced with Cardanol up to 40% by weight in the synthesis of different resins. Table 1 shows the proportions of the different modified resole phenolic resins synthesised in this work. The reactions were carried out in a glass reactor equipped with a stirrer, a condenser and an internal heating unit. The required amounts of phenol (88 % concentration), Cardanol and paraformaldehyde were mixed by keeping the mole ratio of total phenol (phenol + cardanol) to formaldehyde at 1:1.25 for the first set of resins, then 1:1.5 for the second set and 1:2.0 for the last one. An aqueous solution of NaOH 46% (4 %, w/w, on the basis of total phenol and cardanol) was employed as the catalyst. The temperature was maintained at 60°C for 1h, then rise to 80°C for 1h and finally reduced to 60°C for 1h. After the synthesis the density, solid content and viscosity were determined for each resin.
Each one of previous resins was neutralised to a pH ~ 7.0 using an acid solution of PTSA- 75%. The chosen acidic catalyst for the curing of the Cardanol modified phenolic resin was a phosphoric acid (Hexion Phencat10 from Burdon Ltd Pty), which cures the phenolic resoles relatively slowly and therefore enable better control and properties to be achieved. The test specimens were cured at room temperature for 8h, followed by post curing at 80°C in the oven for 4h. Infrared spectroscopy analysis, DMA analysis, mechanical test and fracture toughness were carried out.
Table.1. Synthesised resins with different proportions (%) of Cardanol/Phenol and different Phenol:Formaldehyde ratios (P:F).
Cardanol (% w/w)
Phenol (% w)
P:F 1.0:1,25
P:F 1.0:1,5
[image:2.595.35.245.38.206.2] [image:2.595.309.552.701.791.2]2.2. Density values and solid content.
An AccuPyc 1330 pycnometer was used to measure the density of the prepared phenolic resins. Viscosity values were established with a Brookfield viscometer and the solid content of the resins was measured by the difference of weight of the samples taken before and after exposure in an oven at 150°C for 2 hours.
After post curing the samples they were tested for flexural stress, elongation at break and flexural modulus taking 3 trials with each sample. This mechanical test was carried out with a MTS machine (10 kN). Fracture toughness tests were performed using the same test machine (MTS 10kN). The critical stress intensity factor, KIc, was calculated
using the following equation (Thachil, 2006):
KIc =
w h
F W a
f( / ) (1)
Where F is the load at break (N), h is the thickness of the specimen (m), w is the width of the specimen (m) and a is the notch length (m).
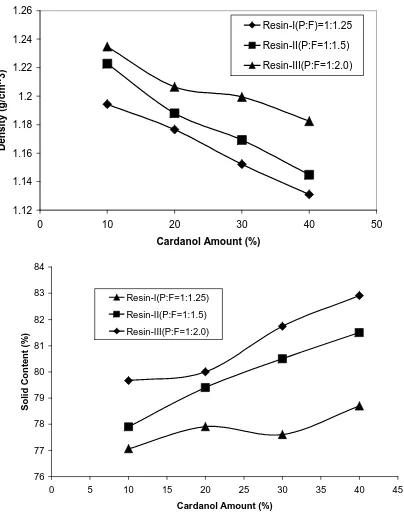
Figure 3 shows the density values as a function of the Cardanol ratio, for the different set of synthesized resin. Density decreases linearly with increasing cardanol ratio. Because of its long side chain, Cardanol-base resins tends to yield a network less dense. Also density increases with increasing the phenol/formaldehyde molar ratio.
1.12 1.14 1.16 1.18 1.2 1.22 1.24 1.26
0 10 20 30 40 50
Cardanol Amount (%)
D
e
n
s
it
y
(
g
/c
m
^
3
)
Resin-I(P:F)=1:1.25
Resin-II(P:F=1:1.5)
Resin-III(P:F=1:2.0)
Figure 3. Density (g/cm3) and solid content vs. Cardanol in the resins (% w/w).
Figure 3 also shows that the solid content increases linearly with the amount of Cardanol contents (%) in the synthesised resins. The more Cardanol is in the resin the higher the solid content of the resin. This means that there are less free formaldehyde, less free phenol and less water content. This appears to indicate that Cardanol is more reactive than pure phenol. Also the solid content increases with increasing (cardanol:phenol)/formaldehyde molar ratio as well.
Moreover, the solid content increase means that cardanol based phenolic resins are safer in comparison with phenolic resins prepared with neat phenol, because of the lower amount of volatile compounds (less emissions during curing and in the case of a fire).
2.3. Infrared spectroscopy analysis
The infrared spectra of the synthesised resin-II-4, the neat Cardanol and the neat phenolic (J2027L) are shown in Figure 4. The peak associated with the OH- group attached to the phenyl ring in the resins is observed in the region 3290 cm-1 to 3370 cm-1. The peak found at 1200 cm-1 in the infrared spectrum of resin-II-4 is associated with the presence of ether linkages. The peaks associated with the methylene groups 2926 cm-1, 2854 cm-1 in the neat cardanol and 2922 cm-1 and 2851 cm-1 in resin-II-4 are due to the cardanol side chain and also to etherification reactions. The peaks for monosubstitution at 752 cm-1 and 690 cm-1 in the phenyl ring are much decreased in the synthesised resin-II-4. This confirms that the polymerisation has taken place through the ortho or para positions. However, the vibrations at 911cm-1, 880cm-1 and 694cm-1 in the neat Cardanol are due to the side chain double bonds. These peaks have vanished in resin-II-4 indicating that the polycondensation has also taken place through the double bonds in the side chain. This explains the viscosity increase with increasing Cardanol content (see Figure 5), i. e., as the Cardanol content in the resins increases the higher will be the cross-linking through the opening of the double bonds present in the side aliphatic chain.
76 77 78 79 80 81 82 83 84
0 5 10 15 20 25 30 35 40 45
Cardanol Amount (%)
S
o
li
d
C
o
n
te
n
t
(%
)
Resin-I(P:F=1:1.25)
Resin-II(P:F=1:1.5)
[image:3.595.37.239.469.726.2]Figure 4. Infrared spectra of neat cardanol (bottom), neat phenolic (top) and of the synthesised resin-II-4 (middle).
2.4. Viscosity values and crosslink density.
Figure 5 shows the change in viscosity with the Cardanol content (%), for the different sets of prepared resins. Viscosity stays stable with increasing cardanol content for resin-I (P:F=1.25) and resin-II (P:F=1.5), whereas resin-III (P:F=2) reaches a maximum (15000cPs) at 30% in cardanol ratio. For this formulation, above 20wt%-cardanol, viscosity is multiplied by 15, which makes the resin difficult to work with. This is the reason why phenol was replaced only up to 40wt% by Cardanol, above 40% of Cardanol content, the obtained Resole resin have a extremely high viscosity value.
0 2000 4000 6000 8000 10000 12000 14000 16000
0 5 10 15 20 25 30 35 40 45
Cardanol Amount (%)
V
is
c
o
s
it
y
(
C
p
s
)
Resin-I(P:F=1: 1.25)
Resin-II(P:F=1:1.5) Resin-III(P:F=1:2.0)
0.0 20.0 40.0 60.0 80.0 100.0 120.0 140.0
0 10 20 30 40
Cardanol amount (%)
C
ro
s
s
li
n
k
D
e
n
s
it
y
(
1
0
-3m
o
le
s
/c
m
3)
100% Resin-I(P:F=1:1.25)
100% Resin-II(P:F=1:1.5)
100% Resin-III(P:F=1:2.0)
[image:4.595.49.246.42.220.2]
Figure 5. Viscosity values and crosslink density vs. Cardanol (%) in the synthesised resins.
The crosslink density can be defined as the fraction of monomer units that are crosslinked (Frechet,
1994). The crosslink density was calculated from the
rubber elasticity theory (Fay, 2004):
ν = E/3RT (2)
where ν represents the crosslink density (number of moles of chains per cm3), R is the gas constant (8.314 J/K.mole), T is the temperature in Kelvin, and E is the elastic modulus.
The crosslink density curves of the resins II and III (see Figure 5) show a decrease with increasing cardanol ratio. The crosslink values of resin I are very much lower than those of the other resins and stay relatively constant with increasing cardanol ratio. Moreover, all of the crosslink values are significantly lower than that of the phenolic resin with neat phenol, J2027L resin (140 x 10-3 moles/cm-3). Clearly, the presence of cardanol decreases the crosslink density and thereby makes the resole phenolic resins less brittle. The measured crosslink density of resin I-4 (2.7 x 10⁻³ moles/cm-3) is much lower than the obtained value for the neat commercial phenolic resin without any cardanol (140 x 10-3 moles/cm-3) and similar to the crosslink value for a cured Epoxy resin (1.7 x 10⁻³ moles/cm
-3
). This confirms that the brittleness of phenolic resins is due to the high crosslink density (about 100 times higher than that of epoxy resins). The crosslink density values in Figure 5 also confirms that the partial substitution of phenol with Cardanol in the synthesis of the Resole phenolic resin, significantly reduces the crosslink density of the prepared resin, producing a resin with lower brittleness and increased toughness.
2.5. Mechanical properties
0 500 1000 1500 2000 2500 3000
0 10 20 30 40
Cardanol Amount (%)
M
o
d
u
lu
s
(
M
P
a
)
Resin III(P:F=1:2.0)
Resin II(P:F=1:1.5)
Resin I)P:F=1:1.25)
[image:4.595.35.226.460.718.2] [image:4.595.309.500.582.739.2]0 10 20 30 40 50 60 70
0 10 20 30 40
Cardanol Amount (%)
M a x . S tr e s s ( M P a ) Resin III(P:F=1:2.0) Resin II(P:F=1:1.5) Resin I)P:F=1:1.25) 0 0.5 1 1.5 2 2.5 3 3.5 4 4.5 5
0 10 20 30 40
Cardanol Amount (%)
[image:5.595.37.226.39.349.2]S tr a in ( % ) Resin III(P:F=1:2.0) Resin II(P:F=1:1.5) Resin I)P:F=1:1.25)
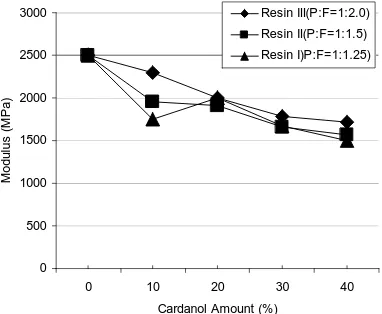
Figure 6. Results of the flexural tests vs Cardanol content for the synthesised phenolic resins.
Figure 6 shows the results of the flexural tests of the Cardanol modified resins vs. the amount of Cardanol in the resins. As shown, the flexural stress of resins III stays relatively constant, whereas the general tendency for the values for resins I and II is an increase with increasing cardanol content. This tendency can be attributed to a decrease in the crosslink density and the brittleness of the resins with increasing cardanol content. This decreases in brittleness with Cardanol also resulted in a proportional decreases in the flexural modulus. Resin I (P:F=1:1.25 ratio) showed superior results to those of the other resins.
The addition of Cardanol introduces molecular mobility due to the presence of the long aliphatic side chain, which resulted in increased strain (%) with Cardanol content, as shown in Figure 6.
0 0.2 0.4 0.6 0.8 1 1.2 1.4 1.6 1.8
0 10 20 30 40 50
Cardanol Amount (%)
F ra c tu re KIc ( M P a .m 1 /2) Resin-I(P:F=1:1.25) Resin-II(P:F=1:1.5) Resin-III(P:F=1:2.0)
Figure 7. KIc (MPa
2 / 1
.m− ) of Cardanol modified resins I, II and III vs. Cardanol content (%).
The critical stress intensity factor KIc (MPa.m−1/2)
for the resin I (P:F=1.25) is about 86% higher than that of the neat phenol resin (0.9 MPa.m-1/2), as shown in Figure 7. Significantly, at 40% content of Cardanol, the fracture toughness factor (KIc) is
similar for the resins, I and II. This indicates that at 40% content of Cardanol the P:F ratio between 1.25 and 1.50 does not make a significant difference on the toughness of the synthesised resins. From the three resins investigated in this work, the resin I shows the larger increase in the values of the fracture toughness factor with increasing Cardanol content. The enhanced fracture toughness may be attributed to a greater level of flexibility and ability for spatial rearrangement inside of the thermoset network. The KIc values of resin III remains
constant, but with lower value than the fracture toughness of neat phenolic resin. Given that the cost of phenol is about US$1.55/kg while the cost of Cardanol is around US$0.50/kg (from India), the use of Cardanol to partially substitute phenol may be not only a effective way to improve the toughness of the resins, but also a economical and environmental friendly substitution of a oil based component in the synthesis of the phenolic resins.
3. CONCLUSIONS
Cardanol modified Resole phenolic resin is very sensitive to experimental conditions, especially to the phenol/ formaldehyde molar ratio.
The Infrared spectroscopy analysis indicated that simultaneously with the formation of the Resole phenolic resin the double bonds in the aliphatic side chain of the Cardanol have been consumed, most likely by intermolecular crosslinking reactions. The results obtained by the DMA analyses of the post cured resins revealed the decrease of the crosslink density with increasing Cardanol content and also with the decreasing phenol/formaldehyde mole ratio.
[image:5.595.36.226.624.756.2]formulations are a phenol/formaldehyde molar ratio equal to 1.25 and/or 1.5 and with 40wt%-Cardanol substitution of phenol.
ACKNOWLEDGEMENTS
The Authors are very grateful to SATYA Cashew Chemicals Pty Ltd Company (from India) for their kind supply of the Cardanol resin used in this work.
REFERENCES
Aggarwal J. S., Menon M. C., Murthy B. G. K. and Zaheer S. H., 1961. Paint Mfr., 31, 47 - 53.
Blackwood R. K., Iffland D. C., Kornblum N. and Smiley R. A., 1955. J. Am. Chem. Soc., 77, 7269 - 7275.
Fay J. J., Murphy C. J., Sperling L. H. and Thomas D. A., 2004. Polymer Eng. Sci., 31 (24), 1731 - 1736.
Francis D. J. and Yeddanapalli L. M., 1968. J. Makromol.
Chem., 119, 17 - 24.
Frechet J. M.,Galia M. and Svec F., 1994. Journal of Polymer
Science. Part A: Polymer Chemistry Edition, 32 (11),
2169 - 2175.
Guionnet S., Seferis J. C., Shafizadeh J. E., and Tillamn M. S., 1999. Journal of Applied Polymer Science, 73, 505–514. Kashani M. A., Tyman J. H. and Wilczynski P., 1978., J. Am.
Oil Chem. SOC., 55, 663 - 670.
Knop A. and Pilato, L. A., 1985. Phenolic Resins—Chemistry,
Applications and Performance; Springer-Verlag:Berlin,
Germany, 68 - 74.
Thachil E. T. and Unnikrishnan K. P., 2006, International
Journal of Polymeric Materials, 55, (6), 385 - 391.