Development of two and three-dimensional method of fragments to analyse drainage behaviour in hydraulic fill stopes
262
0
0
Full text
(2) DEVELOPMENT OF TWO AND THREE-DIMENSIONAL METHOD OF FRAGMENTS TO ANALYSE DRAINAGE BEHAVIOR IN HYDRAULIC FILL STOPES. Thesis submitted by Kelda Shae RANKINE BEng(Hons) in September 2007. for the degree of Doctor of Philosophy in the School of Engineering James Cook University.
(3) STATEMENT OF ACCESS. I, the undersigned, the author of this thesis, understand that James Cook University will make it available for use within the University Library and, by microfilm or other means, allow access to users in other approved libraries. All users consulting this thesis will have to sign the following statement: In consulting this thesis, I agree not to copy or closely paraphrase it in whole or in part without the written consent of the author; and to make proper public written acknowledgement for any assistance which I have obtained from it. Beyond this, I do not wish to place any restriction on access to this thesis.. _________________________________. __________. Signature. Date. ii.
(4) STATEMENT OF SOURCES. DECLARATION. I declare that this thesis is my own work and has not been submitted in any form for another degree or diploma at any university or other institution of tertiary education. Information derived from the published or unpublished work of others has been acknowledged in the text and a list of references is given.. _________________________________. __________. Signature. Date. DECLARATION – ELECTRONIC COPY. I, the undersigned, the author of this work, declare that to the best of my knowledge, the electronic copy of this thesis submitted to the library at James Cook University is an accurate copy of the printed thesis submitted.. _________________________________. __________. Signature. Date. iii.
(5) Acknowledgements. The author wishes to thank,. My family – Dad, Mum, Tegan, Rudd, Shauna, Briony, Kirralee and Lachlan. Thankyou for being there through the good times and the bad, for sharing my laughter, tears, frustrations and achievements. I feel blessed to have the family that I have, and want to thank each and every one of them for always being there. Another person who I am very thankful to who constantly provided their support, guidance, and encouragement is Assoc. Prof. Nagaratnam Sivakugan. Siva, you have taught me so much and have not only been an excellent teacher and mentor throughout my research, but you have also been a true friend for whom I will never forget and with whom I hope to share a friendship with for the rest of my life. You have helped me in so many ways, and for that I am forever grateful. Thankyou. I would also like to thank Siva’s wife Rohini, for her friendship and for sharing Siva and so much of his time with me. Finally, I would like to thank the School of Engineering at James Cook University for allowing me to undertake this dissertation.. iv.
(6) This work is dedicated to my wonderful family – Dad, Mum, Tegan, Rudd, Shauna, Briony, Kirralee and Lachlan. v.
(7) Abstract The extraction and processing of most mineral ores, result in the generation of large volumes of finer residue or tailings. The safe disposal of such material is of prime environmental, safety and economical concern to the management of mining operations.. In underground metaliferous mining operations, where backfilling of. mining voids is necessary, one option is to fill these voids with a tailings-based engineered product. In cases where the fill is placed as a slurry and the fill contains free water, permeable barricades are generally constructed to contain the fill within the mining void whilst providing a suitable means for the drainage water to escape from the fill. Recent barricade failures, resulting from poor drainage, have led to an immediate need for an increased understanding of the pore pressure developments and flow rates throughout the filling operation. This thesis presents simple analytical solutions, based on the ‘method of fragments,’ for estimating discharge and maximum pore pressure for two and three-dimensional hydraulically filled stopes. Shape factors were developed to account for the inherent individuality associated with stope and drain geometry.. The influence of scaling on discharge and pore pressure. measurements is also investigated. The proposed solutions are verified against solutions derived from a finite difference program and physical modelling of a scaled mine stope and results showed excellent agreement. Using these analytical solutions developed for flow through three-dimensional hydraulic fill stopes, a user-friendly EXCEL model was developed to accurately and efficiently model the drainage behaviour in three-dimensional stopes. The model simulates the complete filling and draining of the stopes and was verified using the finite difference software FLAC3D. The variation and sensitivity in drainage behaviour and pore water pressure measurements with, the variation in geometry, fill properties and filling-cycles of a three-dimensional hydraulic fill stope was also investigated.. vi.
(8) List of Publications Journals Rankine, K.S. and Sivakugan N. (2007) “Application of Method of Fragments in Three-Dimensional Hydraulic Fill Stopes.” Journal of the Geotechnical Division ASCE, Under Review 3rd draft Sivakugan, N. and Rankine, K.S. (2006). "A simple solution for drainage through 2-dimensional hydraulic fill stope," Geotechnical and Geological Engineering, Springer, 24, 1229-1241. Sivakugan, N., Rankine, K.J., and Rankine, K.S. (2006). "Study of drainage through hydraulic fill stopes using method of fragments," Journal of Geotechnical and Geological Engineering, Springer, 24, 79-89. Sivakugan, N., Rankine, R.M., Rankine, K.J., and Rankine, K.S. (2006). "Geotechnical considerations in mine backfilling in Australia," Journal of Cleaner Production, Elsevier, 14(12-13), 1168-1175.. Refereed Conference Proceedings Rankine K.S., Sivakugan N., Rankine K.J. (2007). Drainage behaviour of threedimensional hydraulic fill stopes: A sensitivity analysis, 10th Australian and New Zealand Conference on Geomechanics – Common Ground, Paper accepted Rankine, K.S. and Sivakugan, N. (2005). "A 2-D numerical study of the effects of anisotropy, ancillary drains and geometry on flow through hydraulic fill mine stopes," Proceedings of the 16th ISSMGE, Osaka, Vol.2, 955-958 Rankine, K.J., Sivakugan, N. and Rankine, K.S. (2004). Laboratory tests for mine fills and barricade bricks, Proceedings of 9th ANZ Conference on Geomechanics, Auckland, 1, pp. 218–224. vii.
(9) Rankine, K.J., Rankine, K.S., and Sivakugan, N. (2003). "Three-dimensional drainage modelling of hydraulic fill mines," Proc. 12th Asian Regional Conf. on Soil Mech. and Geotech. Engineering, Eds. CF Leung, KK Phoon, YK Chow, CI Teh and KY Yong, 937-940. Rankine, K.J., Rankine, K.S. and Sivakugan, N. (2003). “Quantitative Validation of Scaled Modelling of Hydraulic Mine Drainage Using Numerical Modelling,” Proc. of the International Congress on Modelling and Simulation, MODSIM 2003,. viii.
(10) Contents Statement of Access. ii. Statement of Sources. iii. Acknowledgements. iv. Dedication. v. Abstract. vi. List of Publications. vii. Table of Contents. ix. List of Figures. xv. List of Tables. xx. List of Symbols. xxii. 2.. 1. INTRODUCTION 2.1. General. 1. 2.2. Problem Statement. 4. 2.3. Objectives. 4. 2.4. Relevance of the Research. 5. 2.5. Thesis Overview. 5. 2.. LITERATURE REVIEW. 8. 2.1. General. 8. 2.2. Mining with Minefills. 9. 2.3. Purpose of Minefill. 10. 2.4. Minefill Performance Requirements. 12. 2.4.1. Static Requirerments. 12. 2.4.2. Dynamic Requirements. 12. 2.4.3. Drainage Requirements. 12. 2.5. Minefill Types and Selection. 14. 2.6. Brief History of Minefill. 16. 2.7. Hydraulic Fill. 18. 2.8. Hydraulic Fill Properties. 19. 2.8.1. Grain Shape, Texture and Mineralogy ix. 19.
(11) 2.8.2. Grain Size Distribution. 21. 2.8.3. Specific Gravity. 23. 2.8.4. Dry Density, Relative Density and Porosity. 24. 2.8.5. Friction angle. 27. 2.8.6. Placement Property Test. 28. 2.8.7. Degree of Saturation. 30. 2.8.8. Chemical Reactivity. 30. 2.8.9. Permeability. 30. 2.9. 2.8.9.1 Anisotropic Permeability. 36. 2.8.9.2 The effect of cement on permeability measurements. 39. Empirical Relationships of Permeability. 42. 2.10 Consolidation. 49. 2.11 Placement and Drainage. 48. 2.12 Barricades. 51. 2.13 Physical Modelling of Hydraulic Fill Stopes. 64. 2.14 In situ Monitoring. 65. 2.15 Numerical Modelling of Hydraulic Fill Stopes. 68. 3.. APPLICATION OF METHOD OF FRAGMENTS TO TWO-. 72. DIMENSIONAL HYDRAULIC FILL STOPES 3.1. Overview. 72. 3.2. Introduction. 72. 3.3. Method of Fragments applied to a two-dimensional hydraulic-filled. 77. Stope 3.3.1. Numerical Model. 78. 3.3.1.1. Numerical Package FLAC. 78. 3.3.1.2. Boundary Conditions and Assumptions. 79. 3.3.1.3. Grid Generation and Input Parameters. 81. 3.3.2. Form Factors, Maximum Pore Pressure and Flow rate. 82. 3.3.3. Fragment Comparison. 88. 3.3.4. Decant Water in Two-dimensional Hydraulic Fill Stopes. 91. 3.3.5. Entry and Exit Hydraulic Gradients. 91. x.
(12) 3.3.6. Scaling Effect on Method of Fragments. 96. 3.3.7. Typical Stope Geometries. 96. 3.3.8. Validation of the Application of two-dimensional method of. 97. fragments 3.3.9. Further analysis of the pore water pressure in two-dimensional. 99. Stopes 3.4. Anisotropy. 3.4.1. 102. Laboratory Testing. 3.4.1.1. 102. Results. 105. 3.4.2. Pore Water Pressure. 106. 3.4.3. Flow rate. 107. 3.5. Ancillary Drainage in Two-dimensional Hydraulic Fill Stopes. 109. 3.5.1. Pore Water Pressure. 110. 3.5.2. Flow rate. 111. 3.6 4.. Summary and Conclusions. 113. APPLICATION OF METHOD OF FRAGMENTS TO THREE-. 115. DIMENSIONAL HYDRAULIC FILL STOPES 4.1. Overview. 115. 4.2. Introduction. 115. 4.3. Method of Fragments for Three-dimensional Hydraulic Filled Stopes. 116. 4.3.1. Numerical Model. 118. 4.3.1.1. Numerical Package FLAC3D. 118. 4.3.1.2. Input Parameters, Boundary Conditions and Assumptions. 119. 4.3.1.3. Grid Generation. 119. 4.3.2. Developing Equations for Form Factors, Flow rate and. 121. Maximum Pore Water Pressure 4.3.2.1. Drain Shape. 126. 4.3.2.2. Drain Location. 128. 4.3.2.3. Stope Shape. 131. 4.3.3. Scaling Effect on three-dimensional Method of Fragments. 132. 4.3.4. Summary of Equations. 132. xi.
(13) 4.4. Possible Drain Arrangements. 134. 4.5 Validation of MOF3D Analytical solutions of Varying Stope Geometries. 135. 4.6 Comparison of pseudo three-dimensional model with actual three-. 136. dimensional numerical models 4.7. Physical Modelling of Flow through a Hydraulic Filled-stope. 138. 4.7.1 Similitude and Dimensional Analysis. 139. 4.7.2 Laboratory Setup. 145. 4.7.3 Sample material. 147. 4.7.4 Procedure. 150. 4.7.5 Numerical Modelling of Scaled Laboratory Stope. 151. 4.7.6 Interpretation of Results. 151. 4.8. Application of three-dimensional method of fragments. 155. 4.9. Summary and Conclusions. 156. 5.. EXCEL MODEL. 158. 5.1. Overview. 158. 5.2. Verification Exercise. 158. 5.2.1. Problem Definition. 158. 5.2.2. Overview of Previous Drainage Models. 159. 5.2.3. Geometry and Boundary Conditions. 159. 5.2.4. Input parameters. 161. 5.2.5. Simulation of filling schedule within stope. 162. 5.2.6. Fill and water heights. 162. 5.3. Sequential Filling and Draining for Hydraulic Fill Stope Calculations. 166. 5.4. Sensitivity Analysis. 172. 5.4.1. Geometry. 172. 5.4.2. Geotechnical Properties. 175. 5.4.2.1. Permeability. 176. 5.4.2.2. Specific gravity and dry density. 178. 5.4.2.3. Solids Content. 180. 5.4.2.4. Residual water content. 185. 5.4.3. Filling Schedule. 186. xii.
(14) 5.4.4. Filling Rate. 187. 5.5 Two-dimensional versus three-dimensional stopes. 188. 5.6. 189. 6.. Summary and Conclusions SUMMARY, CONCLUSIONS AND RECOMMENDATIONS. 191. 6.1. Summary. 191. 6.2. Conclusions. 194. 6.3. Recommendations for future research. 198. REFERENCES. 201. APPENDICES APPENDIX A: Cemented hydraulic fill laboratory testing. 213. A.1. Initial and Final parameters for Copper Tailings. 214. A.2. Initial and Final parameters for Zinc Tailings. 214. A.3. Grain Size Distribution Curves for Copper and Zinc Tailings. 214. A.4. Summary of Copper Permeability Results. 215. A.3. Summary of Zinc Permeability Results. 216. APPENDIX B: FLAC / FLAC3D Codes. 217. B.1. Source listing FISH and FLAC code for progam used to develop. 218. the two-dimensional form factor B.2. Source listing FISH and FLAC code for two-dimensional Anisotropic. 220. Permeability analysis B.3.. Source listing FISH and FLAC3D code for program used to develop. 222. Three-dimenensional form factor APPENDIX C: Validation plots for additonal points on two-dimensional stope. 226. C.1. Validation graphs for Point A and B on two dimensional stope. 227. C.2. Validation graph for Point C on two-dimensional stope. 228. xiii.
(15) C.3. Validation graph for Point D on two-dimensional stope. 229. C.4. Validation graph for Point E and F on two-dimensional stop. 230. APPENDIX D: Anisotropic Permeability Cell Testing. 231. D.1. Permeability Cell Testing on Sample D3. 232. D.2. Permeability Cell Testing on Sample D4. 233. D.3. Permeability Cell Testing on Sample A1. 234. APPENDIX E: Physical Modelling Results. 235 3D. E.1. Scaled Stope Analysis: Numerical / Laboratory / MOF scaled stope. xiv. results for. 236.
(16) List of Figures Figure. Details. Page. 1.1. Schematic diagram of idealized hydraulic fill stope. 3. 2.1. Plan view of an ore body showing typical stope extraction 9 sequence in a nine-stope grid arrangement. 2.2. Idealized hydraulic fill stope. 10. 2.3. Brief timeline of Australian mines from 1850 – 2004. 17. 2.4. Electron micrograph of hydraulic fill sample at James Cook 20 University. 2.5. Grain Size Distribution of Hydraulic Fills tested at James Cook 22 University. 2.6. Decrease in minefill permeability with increasing ultrafines 23 content (Lamos, 1993). 2.7. Dry density versus specific gravity (Rankine et al. 2006). 25. 2.8. Placement property curve of an Australian hydraulic fill (Rankine 29 et al. 2006). 2.9. Three field permeameters (Herget and De Korompay, 1978). 32. 2.10. Constant head permeability test (a) Schematic diagram, (b) 34 Permeameter set-up in the Laboratory. 2.11. Falling head permeameter (a) Schematic diagram, (b) Actual 35 permeameter set-up. 2.12. Sample prepared in the permeameter – prior to testing. 40. 2.13. Permeability Variation with Time for Copper CHF. 41. 2.14. Permeability Variation with Time for Zinc CHF. 41. 2.15. Various laboratory measured soil permeabilities versus void 47 ratios (Qiu and Sego, 2001). 2.16. Various laboratory measured soil permeabilities for various void 48 ratios (Lambe and Whitman, 1979). 2.17. (a) A brick used in the construction of barricades (b) A barricade 53 wall under construction. xv.
(17) 2.18. Forces acting on the fill in an access drive (Potvin et al. 2005. 56. 2.19. Test apparatus for observing piping mechanism. 57. 2.20. Piping development in hydraulic fill due to unfilled access drive. 59. 2.21. Piping development due to fill escaping through rock joints. 60. 2.22. (a) Erosion pipe seen during drainage trials (Grice, 1989) (b) 61 Failed planar masonry barricade (Grice, 1998). 2.23. Bulkhead pressure measurements (Mitchell et al. 1975). 67. 3.1. Simplified schematic diagram of two-dimensional stope. 77. 3.2. Hydraulic fill stope with single drain (a) Flownet (b) Selected 78 equipotential lines (c) Flow region and three fragments. 3.3. Two possible pore water pressure distribution assumptions for 80 fill-barricade interface. 3.4. Two dimensional meshes investigated (a) 1 m x 1 m mesh; (b) 0.5 81 m x 0.5 m mesh; (c) 0.25 m x 0.25 m mesh (d) combination of fine and coarse mesh (0.25 m x 0.25 m mesh in drain and 1 m x 1 m mesh in stope). 3.5. Form factor for fragment 2 for case 1: Hw/B ≥ 1. 84. 3.6. Form factor for fragment 2 for all cases of Hw. 84. 3.7. Head losses within fragments (a) Case 1: Hw > B (b) Case 2: Hw < 86 B. 3.8. Coefficient α2D for fragment 2. 3.9. Flow rate comparison using varying fragments including Griffiths 90. 87. (1984) and Table 3.4 fragments against finite difference model FLAC 3.10. Dependence of ientry for several cases of X/D, D/B and Hw/B. 94. 3.11. Hw/B against ientry for two-dimensional stopes. 95. 3.12. Scaling of two dimensional stope and flow nets. 96. 3.13. Maximum pore water pressure comparison. 98. 3.14. Flow rate comparison. 98. 3.15. Points for pore pressure analysis. 99. 3.16. Coefficient αC for fragment 2 for point C. 101. xvi.
(18) 3.17. Coefficient αD for fragment 2 for point D. 3.18. (a) Permeability cell with filter paper (b) Placement of slurry in 103. 101. permeability cell (c) Secured permeability cell (d) Permeability cell connected to constant head apparatus 3.19. Design chart for pore water pressure measurements for. 106. anisotropic fill material: D/B = 0.025; X/D = 1 3.20. Design chart for pore water pressure measurements for. 107. anisotropic fill material: D/B = 0.05; X/D = 1 3.21. Design chart: effect of anisotropic permeability on flow rate 108 D/B=0.025; X/D=1. 3.22. Geometry of stope with ancillary drainage. 110. 3.23. Effects of ancillary drain on pore water pressure measurements. 111. 3.24. Comparison between maximum pore water pressures obtained 112 from FLAC and those calculated using Eq. 3.20. 3.25. Effect of ancillary drain on flow rate results. 112. 4.1. Three-dimensional hydraulic fill stope (a) Selected equipotential 117 surfaces (b) Flow region, dimensions and three fragments of 3D stope. 4.2. Mesh sensitivity (a) 2 m mesh spacing, (b) 1 m mesh spacing (c) 120 Combination of fine and coarse mesh (d) 0.5 mesh spacing. 4.3. Form Factor for fragment 2 (Γ2) for a three-dimensional stope. 124. 4.4. Coefficient α3D for fragment 2 in a three-dimensional (Case 1). 126. 4.5. Effect of drain shape on pore pressure measurements. 127. 4.6. Effect of drain shape on discharge measurements. 127. 4.7. Drain Location Analysis (a) Centre Square drain (b) Corner 128 square drain. 4.8. Effect of drain location on maximum pore pressure measurement. 129. 4.9. Effect of drain location on discharge measurements. 129. 4.10. Scaled three-dimensional stope. 132. 4.11. Validation of pore pressure measurements for varying stope 135 geometries. xvii.
(19) 4.12. Validation of discharge measurements for varying geometries. 136. 4.13. Investigated two and three dimensional models (a) Pseudo three- 137 dimensional stope (b) Three-dimensional stope with long, flat drain. (c) Three-dimensional stope with square drain of. equivalent cross-section as Model 1 and Model 2 4.14. General Form of the typical soil-fluid-flow problem (Butterfield, 141 2000). 4.15. Permeability versus vertical normal stress for various hydraulic 143 fills tested at James Cook University (Singh, 2007). 4.16. Schematic diagram of Experimental Apparatus. 146. 4.17. Barricade (Hall, 2006). 146. 4.18. Three different drain lengths of 5 cm, 20 cm and 14 cm (Hall, 147 2006). 4.19. Grain size distribution of sand samples (Hall, 2006). 148. 4.20. Laboratory model stope setup. 151. 4.21. Comparison between laboratory, numerical model and 3-D 152 method of fragment solution. 5.1. Verification Geometry (a) two-dimensional stope (b) three- 160 dimensional stope. 5.2. Pseudo three-dimensional stope used for comparison of models. 161. 5.3. Fill and water height comparison between Isaacs and Carter, 163 FLAC, FLAC3D, Rankine-file for the verification problem. 5.4. Magnified fill and water heights for a 24 hour period. 164. 5.5. Discharge rate comparison for between Isaacs and Carter, FLAC, 164 FLAC3D and Rankine-file. 5.6. Magnified discharge rate comparison for between Isaacs and 165 Carter, FLAC, FLAC3D and Rankine-file. 5.7. Input dimensions of a three-dimensional stope modelled in 167 Rankine-file simulations. 5.8. Water mass balance. 170. 5.9. Sensitivity analysis for varying geometries versus maximum pore 174. xviii.
(20) water pressure 5.10. Sensitivity analysis for varying geometries versus discharge. 174. 5.11. Dimensions of sample stope used in the geotechnical property 175 sensitivity analysis. 5.12. Permeability versus discharge. 176. 5.13. Permeability versus maximum pore pressure. 177. 5.14. Fill and water heights for varying specific gravity values. 179. 5.15. Maximum pore pressure versus specific gravity. 180. 5.16. Discharge versus specific gravity. 181. 5.17. Hydraulic fill Slurry density ranges (Potvin et al. 2005). 182. 5.18. Fill and water heights for varying specific gravities. 183. 5.19. Magnified fill and water heights for varying specific gravities. 183. 5.20. Discharge versus specific gravity. 184. 5.21. Maximum pore water pressure versus specific gravity. 184. 5.22. Water and fill heights during filling and draining of three- 186 dimensional stope with varying residual moisture contents. 5.23. Fill and water heights during filling for various filling schedules. xix. 188.
(21) List of Tables Table. Description. Page. 2.1. Ten largest Australian mines using minefill. 15. 2.2. Specific gravity values for a range of hydraulic fills. 24. 2.3. Published porosity values for hydraulic fills. 26. 2.4. Recorded relative density values of hydraulic fills. 27. 2.5. Published permeability values for a range of hydraulic fills. 37. 2.6. Hazen’s constant values reported by various authors. 43. 2.7. Mount Isa fill and pouring resting regimes (Cowling et al., 1988). 51. 3.1. Summary of Harr’s Fragments (Harr, 1977). 75. 3.2. Summary of Griffith’s form factors (Griffiths, 1984). 76. 3.3. Outputs by different mesh arrangements. 82. 3.4. Summary of equations for two-dimensional analysis. 89. 3.5. Summary of pore water pressure equations and design charts for. 100. various points 3.6. Permeability anisotropy values for hydraulic fills. 105. 4.1. Output for various three-dimensional meshes. 120. 4.2. The effect of drain location and drain shape on discharge 130 measurements. 4.3. Equations for three-dimensional hydraulic fill stopes. 133. 4.4. Four common cases and corresponding equations for various 134 Drain Arrangements. 4.5. Results of the investigated two and three-dimensional models. 138. 4.6. Classification summary of sand samples. 148. 4.7. Hall (2006) empirical relationships. 149. 4.8. Constant head permeability tests for various relative densities 149 (Hall, 2006). 4.9. Summarized percent differences between the numerical / 154 laboratory and MOF3D models for the various cases. 5.1. Input parameter for Verification Stope. xx. 161.
(22) 5.2. Input data for FLAC3D and EXCEL comparison. 166. 5.3. Results for various simulations described in Table 5.3. 166. 5.4. Suggested filling schedules (Cowling et al. 1988). 187. xxi.
(23) List of Symbols A = cross-sectional area a = air content B = stope width C = Hazen’s constant Cslurry = percent solids of slurry Cu = coefficient of uniformity Cv = viscosity coefficient C0 = Terzaghi (1925) shape factor C2 = Kozeny-Carman (1938) shape factor C3 = Taylor (1948) shape factor C4 = Samarasinghe (1982) constant C5 = Amer and Awad (via Das, 2002) constant c’ = effective cohesional stress D = drain height Dr = relative density Ds = effective particle dimeter D5 = the grain size for which 5% of the particles are finer D10 = the grain size for which 10% of the particles are finer; effective grain size D30 = the grain size for which 30% of the particles are finer D50 = the grain size for which 50% of the particles are finer D60, = the grain size for which 60% of the particles are finer E1, E2 = material property constants, Carrier et al. (1983) e = void ratio emax = maximum void ratio emin = minimum void ratio F = drain width Fr = Froude number f = soil fabric G = equivalent drain height Gs = Specific gravity g = acceleration due to gravity xxii.
(24) H = height Hw = height of water hi = head loss in ith fragment hL = head loss Δh = change in head between two points i = hydraulic gradient ientry = entry hydraulic gradient iexit = exit hydraulic gradient J = fill height increase per hour K0 = horizontal pressure coefficient (assumed to be 0.5) k = permeability k0.85 = permeability at void ratio of 0.85 ke = effective permeability kequiv = equivalent permeability for a layered system kh = permeability in the horizontal direction kv = permeability in the vertical direction L = length La = length of ancillary drain m = soil compressibility ms = mass of solids mw = mass of water Nd = number of equipotential drops Nf = number of flow channels n = porosity neff = effective porosity Pb = pressure exerted by the bulkhead on the fill Q = discharge q = discharge per unit length Re = Reynold’s number Rs = solids filling rate S = saturation Ss = specific surface area of grains. xxiii.
(25) Sv = grain surface per unit volume s = shape factor T = temperature t = time u = pore water pressure umax = maximum pore water pressure v = discharge velocity Vdrained = volume of water that has drained Vf = volume of fill Vfree = total free water that is drainable Vin = volume of water entering stope Vout = volume of water draining from the stope Vresidual = volume of residual water Vs = volume of solids Vto-drain = volume of water that is yet to drain Vv = volume of voids Vw =volume of water W = stope thickness w = water content wres = residual water content wsat = saturated water content wslurry = water content of hydraulic fill slurry X = drain length α2D = fraction of the head loss within fragment 2 for a two-dimensional stope that takes place in the horizontal segment of the largest stream line α3D = fraction of the head loss within fragment 2 for a three-dimensional stope that takes place in the horizontal segment of the largest stream line Δh = change in head between two points Φ = two-dimensional form factor for ith fragment Γi = three-dimensional form factor for ith fragment γt = total bulk unit weight of fill γw = unit weight of water xxiv.
(26) η = dynamic viscosity ϕ = effective frictional stress κ = intrinsic permeability μ = water viscosity μT = water viscosity at T degrees Celsius μ10 = water viscosity at 10 degrees Celsius ρd = dry density ρs = soil grain density ρw = density of water σh = horizontal/ barricade pressure σh′ = effective horizontal pressure σv′ = effective vertical pressure τw = shear strength of rock-fill interface ω = fluid surface tension. xxv.
(27) CHAPTER 1 INTRODUCTION 1.1. General Minefill refers to any waste material that is placed into voids mined underground to dispose of mining waste (tailings) or used to perform some engineering function. In addition to this, minefill provides the following benefits: •. Effective means of tailings disposal,. •. Increased local and regional rock stability,. •. Improvement in ore recovery,. •. Reduced environmental impacts of mining operations.. To accurately determine the support benefits that the minefill will provide, it is important that the geotechnical characteristics are properly understood. This will ensure that adequate provisions are made for the drainage, static and dynamic strength considerations. The static and dynamic strength stability requirements are typically imposed to ensure that the minefill has enough strength to prevent failure during the exposure of a minefill surface wall in the mining sequence and during blasting within the ore body. The dynamic and drainage requirements are linked inherently through the in-situ pore pressure in the fill mass. The major cause of failure in underground stopes is often attributed to the build-up of high pore water pressures behind the barricade, resulting in liquefaction due to blasting or piping (Bloss & Chen 1998; Grice 1998 a). Liquefaction occurs when the pore pressure increases dramatically, thus reducing the effective stress in the fill mass, to the point where the shear resistance of the soil is so low that the soil begins to “flow” like a liquid. If the fill mass liquefies, implications arise for the loading on the barricade walls which retain the fill in the stopes and prevent it from flowing into the mine. During liquefaction, all arching in the fill mass is lost and the loadings on the barricades will increase, which is significantly. 1.
(28) greater than current design strengths for which barricade walls are designed. A flow of fill material would then follow, with potentially catastrophic consequences. The open stoping mining method is a mining technique used as a means of obtaining ore from underground metalliferous mines. This method involves dividing the ore body into a series of prisms, approximately rectangular in geometry, called stopes. Blasting techniques are used to break down the ore within an individual stope to a size suitable for being removed via horizontal access at the bottom of the stope. Excavation initiates from the bottom of the stope and progresses upwards, so the ore falls to the base of the stope. Once the ore is extracted, it is processed, removing the valuable minerals from the rock and producing a waste material known as tailings. When used as minefill, these tailings are mixed with water and reticulated to an existing stope void. Where the walls of the fill mass are exposed by adjacent stoping, cement must be added to the minefill to provide sufficient strength to stabilize the fill over the exposed area. To complete the extraction of an ore body, many stopes are required. These stopes are generally set out in a standard grid pattern, but specific details depend on the ore body geometry, the host rock and specific mine conditions. At any given stage of an underground mine operation, the excavation of several stopes will be under way at one time, and similarly several stopes will be in the backfilling stage. These individual stope operations are planned and sequenced to allow sufficient distance between excavations to avoid stability problems. This research will focus on the drainage characteristics and associated properties of a particular type of minefill material known as hydraulic fill and issues related to using this fill material in underground mining operations. Hydraulic filling is one of the more popular backfilling methods used in Australia and worldwide and consists of deslimed tailings (i.e. finer fraction is removed via cycloning) and is placed underground hydraulically as a slurry. Hydraulic fills can be classified as sandy silts or silty sands with no clay fraction and are generally placed with a solids density of 65% – 75%.. 2.
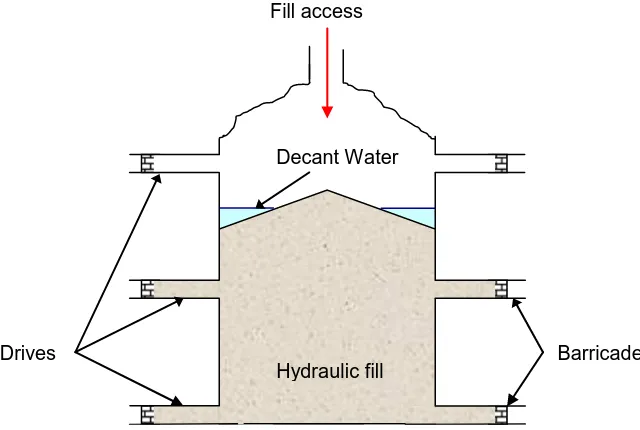
(29) Due to the high water content and permeability of hydraulic fill, free water exists in the placed fill and must be allowed to drain in order to minimize pore pressures To contain the hydraulic fill, barricades are constructed at each of the entrances to the stopes. A schematic diagram of an idealized hydraulic fill stope is shown in Fig. 1.1. Barricade construction varies from mine to mine. In a number of cases, these barricades are made of special porous bricks that have permeabilities 2 – 3 orders of magnitude greater than those of the hydraulic fills (Rankine et al. 2004). These barricades contain the wet hydraulic fill, whilst draining the water into the drives thus reducing the build-up of pore water pressure behind the barricades. The remaining water either pools on the surface as decant water, or is retained in the interstices of the fill. Upon placement in the stope, the hydraulic fill rapidly develops sufficient shear strength to prevent transmission of geostatic (earth) pressure to the barricades. Therefore once dewatering is complete, pressures on the barricades are minimal. After dewatering and resulting consolidation in stopes underground, the fill becomes capable of accepting loads and the next stope is ready to be blasted.. Fill access. Decant Water. Drives. Hydraulic fill. Hydraulic fill. Barricade. Fig. 1.1. Schematic diagram of idealized hydraulic fill stope. 3.
(30) Recent barricade failures Grice, 1998 a; Torlach, 2000), resulting from poor drainage, have emphasized a need for an increased understanding of the pore pressure developments and flow rates throughout the filling operation. The primary objective of this thesis is the improvement in the filling and drainage operations through a greater understanding of the drainage behavior in hydraulic fill mines, as well as the means by which the drainage of these mines is analyzed.. 1.2 Problem Statement Hydraulic fill is generally placed in the form of a slurry with high water content for the ease of transportation and placement. The problem with high water content is that there is a substantial amount of water entering the stope. During the filling process and in the early stages of draining, several failures have occurred as a result of poor drainage of excess water from the stope causing substantial financial and human loss to the mines.. As a result of these failures, there has been great importance placed on. developments in drainage analysis of hydraulically placed minefill. Therefore, it is necessary to be able to predict the pore water pressure developments and flow rates throughout the filling process, so that barricade performance can be predicted and barricades can be engineered to prevent failure.. 1.3 Objectives The focus of this research is to study the fundamental aspects of the drainage behavior in hydraulic fill stopes. More specifically, this thesis aims to achieve the following objectives: •. To develop and verify simple analytical solutions, based on the ‘method of fragments,’ for estimating discharge and maximum pore pressure for twodimensional hydraulically filled stopes.. •. To extend method of fragments to three dimensional geometries and use this to develop and verify analytical solutions to predict the discharge rates and pore water pressures in three-dimensional hydraulic fill stopes.. •. Develop a user-friendly EXCEL model to accurately and efficiently model the filling and draining of a three-dimensional minefill stope.. 4.
(31) •. Undertake a sensitivity analysis into the drainage behavior and pore water pressure measurements based on fill properties, geometries and filling schedules of a three-dimensional hydraulic fill stope.. 1.4 Relevance of Research The frequent historical occurrence of fill barricade failures around Australia and numerous underground mines worldwide has led to a need for an increased understanding of the factors which lead to failure of the fill in underground mining operations. Two major factors that have been identified are: i) The flow of water through the hydraulic fill mass, and ii) Poor drainage that leads to build-up of pore pressures, which results in piping, liquefaction and other forms of failures. By understanding the processes that lead to failure, an increased level of confidence in design of hydraulic fills will be achieved. More efficient mining, safer minefilling practices and increased cost savings may also result from the introduction of new designs. The drainage performance of hydraulic fill needs to be properly understood as it plays an important roll in the safety of underground hydraulic fill mining operations. Reliable knowledge of the drainage characteristics of underground hydraulic fill mines will improve mine safety and productivity through confidence in design and prediction.. 1.5 Thesis Overview Chapter 1 introduces the research problem, objectives and the relevance of the research. An overview of the major issues associated with the drainage of hydraulic fill mines and a brief description of the mining method have been presented. A broad overview of the thesis chapters is also discussed. Chapter 2 presents a more detailed introduction into hydraulic fill.. Initially an. overview of minefill types and selections, the purpose of minefill and a brief historical overview of hydraulic filling practices within Australia are given. Research carried 5.
(32) out on the characterization of hydraulic fills and barricade bricks is also presented. As well as the current practices and recent developments with regard to underground hydraulic fill mining and drainage analysis and prediction, including physical modeling, in-situ monitoring and previous numerical modeling of the hydraulic fill stopes Chapter 3 deals with the application of the method of fragments in two-dimensional stopes.. Using method of fragments (Harr 1962, 1977) and the finite difference. software FLAC (Fast Lagraingian Analysis of Continua, Itasca 2002), drainage and pore water pressure characteristics within a two-dimensional hydraulic fill stope were investigated in this chapter. Analytical solutions were proposed for determining the flow rate and the maximum pore water pressure within the stope. The proposed solutions were verified against solutions derived from the finite difference software package FLAC and were found to be in excellent agreement. The effects of ancillary drains and anisotropic permeability were also investigated. Chapter 4 deals with the development of method of fragments in three-dimensions. This chapter provides simple analytical solutions and design charts for estimating the maximum pore water pressure and discharge within three-dimensional hydraulic fill stopes of varying geometries. Shape factors were developed to account for the inherent individuality associated with stope and drain geometry and the influence of scaling on discharge and pore pressure measurements were also investigated. Previously, method of fragments has only been applied in two-dimensions; this chapter extends the concepts into a three-dimensional analysis. The proposed solutions are verified against solutions derived from the finite difference software package FLAC3D and results are found to be satisfactory. Using the analytical solutions developed for flow through three-dimensional hydraulic fill stopes in chapter 4, an EXCEL model was developed to accurately and efficiently model the drainage behaviour in three-dimensional stopes. This chapter discusses the development, application and verification of the EXCEL model which simulates the complete filling and draining of the stopes. Using this model, the sensitivity of. 6.
(33) drainage behaviour and pore water pressure measurements with the fill properties, geometries and filling schedules of a three-dimensional hydraulic fill stope was investigated. A summary of the findings from this research and recommendations for future research are presented in Chapter 6.. 7.
(34) CHAPTER 2 LITERATURE REVIEW 2.6 General Australians enjoy one of the highest living standards in the world and part of the reason for this is that we are a major trading nation. The minerals industry is one of the biggest contributors to Australia’s export trade with estimated export earnings of $58.3 billion in 2004-2005 (http://www.australianmineralsatlas.gov.au). The extraction and processing of most mineral ore, result in the generation of large volumes of finer residue or tailings. The safe disposal of such material is of prime environmental, safety and economical concern to the management of mining operations. For underground mines, the use of tailings in minefill not only reduces the environmental impact of surface disposal of tailings but also provides the base of an engineering material that can be used to improve both the ground conditions and economics of mining. Recent failures in Australia and worldwide have emphasized the need for proper understanding of underground filling practices, and in particular the use of hydraulic filling. Minefill refers to any waste material that is placed into voids mined underground for purposes of either disposal, or to perform some engineering function.. This thesis is concerned with one particular minefill material, called. hydraulic fill, which can be defined as deslimed mine tailings and a D10 value in excess of 10 μm.. Hydraulic filling is one of the most popular minefilling methods used in. Australia and worldwide. The literature review is not only limited to this chapter which deals with the hydraulic filling of mine stopes; problems associated with hydraulic filling; and research carried out on the characterization of hydraulic fills and barricade bricks. A more extensive coverage on method of fragments, anisotropy, ancillary drainage, scale, numerical and physical modelling is given in latter chapters. 8.
(35) 2.7 Mining with Minefills There are two distinct types of mining methods: stable stope and caving, with a complete spectrum of methods available between these two extremes. The three stable stope methods which use minefill are the open stoping, room and pillar, and cut and fill mining methods. Caving is an unstable form of mining where ore is allowed to collapse under its own weight through prolific natural cracking and failures. In caving the ore will fail where undermined and will continue to fail while there is a void to fill and when there is sufficient cracking of the ore body. A comprehensive description of each of the mining methods is given by Brady and Brown (1985); Franklin and Dusseault (1991) and Reedman (1979). This research is based on the open stoping mining method in conjunction with hydraulic fill. In an open stoping mining operation, the ore body is divided into separate stopes for mining. Fig. 2.1 illustrates a typical idealised plan view of an ore body, showing the typical stope extraction sequence in a nine-stope grid arrangement Tertiary. Secondary. Tertiary. 6. 5. 4. Secondary. Primary. Secondary. 3. 1. 2. Tertiary. Secondary. Tertiary. 9. 8. 7. Fig. 2.1. Plan view of an ore body showing typical stope extraction sequence in a nine-stope grid arrangement In large scale, underground, mining operations, ore body extraction may result in stopes that are tens to hundreds of metres in depth. The stopes are created by carefully controlled sequences of blasts. On completion of extraction of the blasted ore the stopes are generally filled using the by-products of ore extraction and mineral processing, commonly known as tailings. Mine filling techniques, which generally use. 9.
(36) these by-products, provide ground support to permit removal of adjacent, remaining ore, and are also effective means of disposal of waste materials. When hydraulic fill is used, barricades are constructed at each of the entrances to the stopes to contain the fill. These barricades can be made of special porous bricks that have permeabilities 2 – 3 orders of magnitudes greater than those of the hydraulic fills (Rankine et al. 2004). These barricades contain the wet hydraulic fill, whilst draining the water into the drives thus reducing the build-up of pore water pressure behind the barricades. The remaining water either pools on the surface as decant water, or is tied up in the interstices of the fill.. After dewatering and resulting consolidation in stopes. underground, the fill becomes capable of accepting loads and the next stope is ready to be blasted. It should be noted that for stoping sequences where adjacent stoping exposes the minefill, cemented hydraulic fill may be used and must cure to achieve the recommended design strength prior to adjacent stope extraction. A schematic diagram of an idealized hydraulic fill stope is shown in Fig. 2.2. Fill access. Decant Water. Drives. Hydraulic fill. Hydraulic fill. Barricade. Fig. 2.2. Idealized hydraulic fill stope 2.8 Purpose of Minefill Minefill refers to any waste material that is placed into underground voids, created by mining for the extraction of ore. Minefill is primarily used to maximise ore recovery. 10.
(37) with the objective of optimising the economics of the mining operation. Minefill may be placed underground as a means of disposing it and to provide additional support for the remaining mine infrastructure (mine pillars etc). In addition to this, minefill provides the following benefits: •. Reduces the environmental impacts of the mining operations;. •. Increases local and regional rock stability;. •. Reduces risk of rockbursting;. •. Provides an effective means of tailings disposal;. •. Improves ore recovery;. •. Reduces the need for large tailings dams; and. •. Provides a working floor in minefill stoping methods.. To accurately determine the support benefits that the minefill will provide, it is important that the geotechnical characteristics of the fill are properly understood. This will enable adequate provisions to be made for the drainage, static and dynamic stability considerations. The static and dynamic strength stability requirements are typically imposed to ensure that the minefill has enough strength to prevent failure during the exposure of a wall in the mining sequence and during adjacent blasting within the ore body. The dynamic stability and drainage requirements are linked inherently through the in situ pore pressure in the fill mass. A brief overview of these requirements is given in section 2.4. Nantel (1998) refers to the trend in Canada where future environmental legislations require the maximum quantity of mine waste to be returned to the underground workings. The obvious limit of this mining direction was reached when the Australian Federal Government recommended approving an alternative for the proposed Jabiluka Mine (JMA) whereby all mill wastes were required to be placed underground. Superficially, this may seem like a reasonable requirement based on a desire to preserve environmental integrity; however, such an approach may limit the financial viability of a significant number of mines (Grice, 1998 b). Grice showed that for one particular operation there was an excess mine volume of 46% which would have to be created to store all mill waste in the form of pastefill.. 11.
(38) 2.9 Minefill Performance Requirements Minefill is an engineered product and in order to satisfy performance criteria as part of an economic mine plan, it must achieve defined static stability, dynamic stability and drainage requirements (where the mine fill is placed as a slurry and contains free water, as well as minimising environmental impact. Each of these requirements is discussed briefly below.. 2.9.1. Static Requirements. Grice (2001) summarises the key static stability requirements as: •. Stand open in vertical faces when exposed by adjacent pillar mining;. •. Support the weight of loading equipment when used as a mucking (trafficked) floor;. •. Confine the rock mass surrounding the stope in order to maintain local and regional stability within mining areas;. •. Permit mining underneath fill by production blasting for undercut ore extraction; and. •. Permit mining through in development sized headings for the purposes of access or ventilation.. 2.9.2. Dynamic Requirements. The key dynamic stability requirements are: •. Withstand the effects of close proximity blasting from production or development sized excavations; and. •. 2.9.3. Withstand the effects of regional seismic events. Drainage Requirements. Drainage is an important consideration in hydraulic backfilling where free drainage water is present. The main requirements include: •. Permit drainage of excess water from minefilled stope to reduce liquefaction potential. 12.
(39) •. Reduce potential excessive pore pressure being applied to stope access barricades that may fail as a result of high loading.. Excess water in stopes may come from three main sources including: •. Water used in transporting the fill material;. •. Groundwater seepage from the stope walls; and. •. Service water (e.g. machine water from drilling).. Generally the majority of the water to be drained through the fill mass comes from the water used to transport the fill to the site of deposition i.e. the water used to suspend the particles, as a hydraulic fill. Once placed, the solid particles tend to consolidate, leaving the water on top of the solidified material to percolate through the fill mass. Research undertaken by Thomas (1969) was instrumental in establishing and documenting the rule-of-thumb percolation rate for hydraulic fill as 100 mm/hr, which has been standard across the industry since around the 1950’s (Nantel, 1998; Cowling, 1998; Keren and Kainian, 1983). With improved understanding into fill drainage and placement practices this standard has come under debate and the published permeability values of many hydraulic fills that are satisfactorily being used across Australia and worldwide fall well below this value (Brady and Brown, 2001; Herget and De Korompay, 1978; Pettibone and Kealy, 1971). It should also be noted that this value was often used as a good rate for cut and fill mining, which required relatively fast drainage to get back quickly on top of the fill with the mining equipment. In the 1980’s and 1990’s tailings became finer (due to finer grind) and this reduced percolation rates in the fill. For most open stoping methods, this was not as much of a problem because unlike cut and fill it was not necessary to be back on top of the fill within hours of placement. Also, cut and fill started reducing in popularity. Minefill barricades are also typically designed to allow for the drainage of water from stopes. Sivakugan et al. (2006) conducted permeability testing on barricades which use porous bricks and hydraulic fills and found the ratio of the permeability of the brick to hydraulic fill to be in the range of 100 – 1500. Therefore it was assumed in this. 13.
(40) dissertation that the fill-barricade interface is free draining and avoids any restriction to the flow of water from the stope and subsequent pore pressure buildup. 2.10. Min. efill Types and Selection There is a vast range of materials that can be used in minefill systems, including quarried rock, natural sands and gravels, total mill tailings, deslimed mill tailings, development mullock, open pit overburden, binders such as Portland cement, gypsum, lime, MINECEM and pozzolans (e.g. Flyash or slags) and chemical additives. Water is also required for the transport of hydraulic materials, hydration of binders and for dust control in “dry” systems. These materials provide a wide range of minefills that can be used in underground mines. Dorricott and Grice (2002) discuss four major fill types used in Australia: -. Hydraulic fill: This may be produced directly from coarse sands and or mill tailings, or by desliming tailings with hydrocyclones to meet a nominal standard of <10% passing 10 μm and adequate drainage rates. Current industry practice suggests that provided the hydraulic fill meets this specification, drainage requirements will be met. Hydraulic fill slurries are usually placed at a solids densities ranging from 65% - 75%, to minimize the amount of excess transport water that must be drained and pumped to the surface.. -. Pastefill: Consists of total mill tailings that are dried using filters and thickened to around 80% solids density. The size of tailings used in pastefill depends on what product is produced by the mill. Cement and water are added to the mix to achieve the required rheological and strength characteristics.. -. Rock fill: Waste rock, quarry rock or aggregate are used as bulking materials. Depending on the engineering purpose of the fill, a hydraulic component (cement slurry or cemented tailings) can be combined with the bulking material to produce a cemented fill mass.. 14.
(41) -. Blended fill: Blended fills are created by adding rock or aggregate to sand, hydraulic or pastefill.. For mines that use minefill, the economics can be significantly influenced by minefill selection.. The overall mine efficiency and viability is largely based on minefill. selection and therefore minefill type is of paramount importance to the plan for the mining of an ore body. For a more detailed description of fill types and production methods refer to McKinstry (1989) and Neindorf (1983). Table 2.1 illustrates the ten largest minefilling operations in Australia and the fill types used at each of these. Table 2.1. Ten largest Australian mines using minefill (vide Dorricott and Grice, 2002). Company. Mine. Fill Types*. BHP Billiton (WMC). Olympic Dam. CAF, RF. MIM. Mt Isa Copper. CAF, CHF, HF. MIM. Enterprise. PF, CHF. Delta Gold. Kanowna Belle. CAF, PF. Normandy Yandal. Bronzewing. CAF, CHF, HF. MIM. George Fisher. CAF. BHP Billiton. Cannington. PF. Normandy NFM. Granites. CAF. Placer Pacific. Osborne. HF, RF. Normandy. Golden Grove. HF, RF. * CHF = cemented hydraulic fill, HF = hydraulic fill, PF = pastefill, PAF = paste aggregate fill, CAF = cemented aggregate fill, CRF = cemented rock fill, RF = rock fill. The type of fill used at a mine site is chiefly controlled by the on-site availability of the particular waste materials, financial costs involved with that minefill (e.g. are binders. 15.
(42) required etc) performance characteristics and convenience of use. The selection of a minefill system involves a cost/benefit analysis of those systems that meet the basic technical and operational requirements. Development. Underground. Mine. EDUMine Online – Professional Backfill. 1-. Introduction. (2003). (www.civil.uwa.edu.au/teaching/MINE4162?f=130747) provides a design rationale for the minefill in six simple steps and is outlined below: 1. Specify the mining environment and mining system. 2. Identify the minefill purposes according to the mining system specified in step 1. 3. Define the target properties of minefill materials to serve the minefill purposes, based on the minefill purposes and mining condition. 4. Define the operating system so that minefill materials match target properties and the minefill operation itself. These include: Minefill material preparation; Minefill material transportation; Minefill material placement; and Minefill operation quality control and environment monitoring. To modify the design parameters, information monitoring at this stage will be fed back to earlier steps. 5. Do an economic evaluation of minefill system. 6. Document and implement minefill mining system. This research deals with the placement, containment and drainage of hydraulic fill, which can be considered as the traditional tailings based mine filling practice (Thomas and Holtham, 1989). Therefore hydraulic fill and the drainage and containment of hydraulic fill within underground stopes will be discussed further. 2.11. Brief History of Minefill. The concept of using recycled extracted material for backfills in mines dates back hundreds of years. The original minefills in underground mines consisted mainly of waste rock and filling may have occurred naturally through caving of overlying strata or as part of a mining process to conveniently dispose of waste rock.. 16.
(43) Over the past 150 years the Australian mining industry has developed into one of the world’s leading mining nations. The gold rushes of the 1850’s that put the Australian mining industry on the map have since expanded with the discovery of new minerals and resources. At present the Australian minerals industry is the third largest minerals sector. by. value. of. production. of. any. country. in. the. world. (http://www.minerals.org.au/corporate). Fig. 2.3 depicts a brief timeline of Australian mines from the 1850’s to that of present day.. The export earnings from the past 25. years (1980 – 2004) have expanded from 7.2 billion to 52.2 billion dollars.. Fig. 2.3. Brief timeline of Australian mines from 1850 – 2004 One of the earliest recordings of the systematic use of fill is that of the use of mullock fill at Mount Lyell and North Lyell mines in Tasmania in 1915 (Murray, 1915). Barkley (1927) reveals that although the use of fill was only documented in 1915, the practice had been in progress since approximately the turn of the century.. 17.
(44) The introduction of hydraulically transported fill in Australia was first reported by Black (1941) at the South Mine of Broken Hill South Limited, Broken Hill, New South Wales in 1939. By 1944, all underground transportation of fill within the South Mine was hydraulic. Hydraulic fill has been used for a long time in the mining industry and remains the most commonly placed mine fill type (Potvin et al. 2005). The historical development of hydraulic fill practice in Australia runs roughly parallel with that in other countries. Hydraulic fill is now used extensively in underground mines throughout the world. Therefore, a move towards an improved understanding of hydraulic fill performance is needed. The early days of fill in North America were not dissimilar to the Australian experience. Minefilling in Canadian mines has been practiced for close to 100 years and evidence suggests the application of minefill technology at an increasing rate during this decade (Nantel 1998, Udd and Annor 1993). The evolution of minefill technology is closely related to the establishment of new mining methods. 2.12. Hydraulic Fill. The most common source of material for hydraulic fill is the finely ground residues of mineral processing activities, however, they can be produced from a number of materials such as natural sand deposits and quarries. Hydraulic fills are simply silty sands or sandy silts with no clay fraction, which classify as ML or SM under the Unified Soil Classification System. The clay fraction is mostly removed through a process known as desliming, where the entire fill material is processed through hydrocyclones, and the fine fraction is sent to the tailings dam. The coarse fraction (referred to as hydraulic fill) is reticulated in the form of slurry through pipelines to the underground voids. Hydraulic fill is mostly commonly prepared using hydrocyclones, however several other less conventional methods are available. These can include: mechanical classifiers and thickeners, with sieve bend, filtration, and flocculation systems also worthy of consideration perhaps in conjunction with other more conventional processes (Thomas and Holtham, 1989). Differences in mineralogy,. 18.
(45) particle shape and size distribution can affect transport, placement, drainage and performance properties. Over the past decade, there has been a steady increase in the solids content of the hydraulic fill slurry placed in mines in an attempt to reduce the quantity of water that has to be drained and to increase the solids proportion. The problem with high solid content is that it becomes difficult to transport the slurry through the pipelines due to rheological considerations. Currently, solids contents of the hydraulic fill typically range between 65% - 75%. (Sivakugan et al. 2006). Even at 75% solid content, assuming specific gravity of 3.00 for the solid grains, 50% of the slurry volume is water. Therefore, there is a substantial amount of water that has to be drained from the hydraulic fill stope. To contain the fill, barricades or bulkheads generally block horizontal drives. The horizontal access drives are large enough to let the machinery in during the mining operation and are blocked by the barricades during filling. The drives are often located at more than one level. The upper level drains let the decant water out and also would serve as an additional drain when the fill slurry reaches this level (Refer to Fig. 2.2). 2.13. Hydraulic Fill Properties. Hydraulic fill is a tailings-based material that is sourced from a wide variety of rock types and processing techniques. Many geotechnical properties of typical hydraulic fills may be characterized or described within a range. The following section aims to detail some of the properties of hydraulic fills, commonly found within the mining industry.. 2.13.1 Grain Shape, Texture and Mineralogy Fig. 2.4 illustrates the typical grain shape of a hydraulic fill sample tested at James Cook University. As shown in Fig. 2.4 and reported by Pettibone and Kealy (1971) and Nicholson and Wayment (1964), hydraulic fills contain very angular grains, which is a result of the crushing of waste rock from the milling process.. 19.
(46) Fig. 2.4. Electron micrograph of hydraulic fill sample at James Cook University Permeability of fill varies according to particle shape and texture of the soil. Generally, rough-surfaced particles produce a greater frictional resistance to fluid flow, thus reducing the permeability (Head, 1982). Irregular-shaped particles create longer, more tortuous flow paths for the fluid to flow through, thus reducing the permeability. Conversely, when particles are smooth and spherical, interlocking between particles is less and the flow paths are less tortuous, thus increasing permeability. In fine-grained soils different types of minerals hold on to different thicknesses of adsorbed water and consequently the effective pore size varies. Thus, the mineral composition affects the permeability of clays, but has little effect on granular soils. The mineral composition of the fill also indirectly affects the frictional resistance of the fill grains. Mineralogy controls important grain characteristics such as size, shape, surface attributes, angularity, and strength of particles Angular grains interlock more effectively than rounded ones, creating a larger friction angle and increasing the fill strength.. Fill consisting of hard particles with rough surfaces that oppose grain. movements off greater resistance to deformation and displacement.. 20.
(47) 2.13.2 Grain Size Distribution Hydraulic fill is produced by passing the tailings from mineral processing in metalliferous mines through hydrocyclones to dewater and remove the fine fraction of the material. Research has suggested that the behavior of hydraulic fills depends critically on their grain size distribution (Clarke, 1988; Hinde, 1993). In general the smaller the grain, the smaller the voids between them and therefore the larger the resistance to flow of water. It is widely accepted within the mining industry that the effective grain size (D10 - which is defined as the grain size for which 10% of the particles are finer than), most suitably defines the ability of a hydraulic fill to percolate water and settle from a slurry (Nicholson and Wayment, 1964; Thomas and Holtham, 1989). Current industry specification suggests that provided a hydraulic fill has less than 10% of the grain size distribution smaller than 10 μm, drainage requirements will be met (Grice and Fountain, 1991; Grice et al., 1993; Bloss and Chen, 1998, Dorricott and Grice, 2002). Herget and De Korompay (1978), quote 35 μm as the typical D10 value, whilst other researches including Kuganathan (2002) and Brady and Brown (2002) have quoted typical hydraulic fill D10 values in excess of 10 μm. The D10 range for fills tested by Rankine et al. (2006) fell between 12 μm and 43 μm.. It should be noted that this criteria can vary, as long as the mining operation. understands how their minefill drains and what it means for their mining process. Wen at al. (2002) presents the results of a comparative study of particle size analyses by sieve-hydrometer and laser diffraction methods and suggests that laser diffraction methods should be adopted as the standard in geotechnical and geoenvironmental engineering.. From the results, it was found that the sieve-hydrometer analysis. underestimates the coarse silt and fine sand fractions which are the sizing that hydraulic fills fall within, and therefore this method may not be suitable or accurate. Due to the importance placed on the accuracy of the grain size distribution, all analysis is done through laser sizing in the mining industry. More than 20 different hydraulic fills representing a wide range of mines in Australia were studied at James Cook University, and the grain size distribution for all these fall. 21.
(48) within a narrow band as shown in Fig. 2.5.. Along with them, the grain size. distribution curve for a paste fill is shown. The addition of a very small percentage of cement has a limited effect on the grain size distribution. However, paste fills generally have a much larger fine fraction than hydraulic fills or cemented hydraulic fills as they contain the full plant tailings, but have negligible colloidal fraction finer than 2 μm.. 100 90 Pastefill Sample. 80. Percent Finer. 70 60 50 40 30. Hydraulic Fill Samples. 20 10 0 1. 10. 100. 1000. 10000. Partical Size (μ m). Fig. 2.5. Grain Size Distribution of Hydraulic Fills tested at James Cook University Lamos (1993), Uys (1993) and Thomas (1978) suggest that the portion of particles finer then 10 μm in size (ultrafines) strongly influences the properties of minefills and in particular its permeability. Fig. 2.6 illustrates the decrease in minefill permeability with increased ultrafines content (Lamos, 1993). The shear strength of a fill is also affected by the grain size distribution. As the friction angle increases so does the shear strength of a fill. Since well-graded fills have higher friction angles than poorly-graded fills, well graded fills tend to have a higher shear strength in the fill. Well graded fills also exhibit a large range of fine and coarse. 22.
(49) particle sizes; this tends to decrease void space between grains, in turn increasing the frictional resistance of the fill particles.. Fig. 2.6 Decrease in minefill permeability with increasing ultrafines content (Lamos, 1993). 2.13.3 Specific Gravity Typically, the specific gravity of natural soil grains, falls within a narrow range of 2.6 – 2.9. However, due to the presence of heavy metals in the hydraulic fill tailings, the specific gravities vary significantly, ranging from approximately 2.8 – 4.4 for various Australian hydraulic fills tested at James Cook University (Sivakugan et al. 2005). These values agree well with the classified tailings tested by Pettibone and Kealy (1971) who recorded specific gravities ranging from 2.80 – 3.35. Table 2.2 presents a range of previously recorded specific gravities for a variety of minefills and in particular hydraulic fills. Irrespective of specific gravity value, all hydraulic fills are generally placed into the stope at water contents of 30%-45%. At a certain solid content, the larger the specific gravity, the larger is the volume of water in the slurry, therefore the greater the volume of water that has to be drained from the stope.. 23.
(50) Table 2.2. Specific gravity values for a range of hydraulic fills Author. Material Type Testing. Specific Gravity. No. of Samples. Rankine et al. (2006). Hydraulic fill Laboratory. 2.80 - 4.40. 24. Kuganathan (2001). Hydraulic fill Assumed. 2.70 - 3.60. NA. Pettibone and Kealy (1971). Hydraulic fill Laboratory. 2.80 - 3.35. 9. Nicholson and Wayment (1964) Hydraulic fill Laboratory. 2.82 - 2.96. 4. Cowling et al. (1988). Hydraulic fill Assumed. 2.90 - 3.00. NA. Qiu and Sego (2001)1. Mine tailings Laboratory. 1.94 - 3.17. 4. 1. Tailings ranged from gold, copper, coal and consolidated tailings. 2.13.4 Dry Density, Relative Density and Porosity A common belief within the mining industry is that hydraulic fill settles to a dry density of approximately half the specific gravity of the material (Cowling, 1998). By simulating the hydraulic filling process in the mines, several laboratory sedimentation experiments were undertaken by Rankine et al. (2006). When these hydraulic fills, in the form of slurries at 65% - 75% solid content settled within the permeameter, they settled to porosity values in the narrow range of 36 – 49% and therefore it may be expected that the dry density is proportional to the specific gravity. Fig 2.7 illustrates the variation of dry density of the settled fill against the specific gravity, for hydraulic fills from several Australian and US mines as tested in the laboratory and in situ (Rankine et al. 2006). In situ measurements both from overseas hydraulic fill mines (Pettibone and Kealy, 1971) and several Australian mines, agree well with the laboratory values tested at James Cook University (Rankine et al. 2004). From Fig. 2.7, Rankine et al. (2006) showed that the dry density of the hydraulic fill is directly proportional to the specific gravity and can be estimated by Eq. 2.1. 24.
(51) 2.5 3. dry density (g/cm ) = 0.56 x specific gravity. 2. r = 0.81. Dry density of fill (g/cm3). 2.0. 1.5 A1 A2 B1 B2 C1 D In situ - Pettibone & Kealy (1971) In situ - mine A In situ - mine B In situ - mine D. 1.0. 0.5. 0.0 0.0. 0.5. 1.0. 1.5. 2.0. 2.5. 3.0. 3.5. 4.0. 4.5. Specific gravity of soil grains. Fig. 2.7. Dry density versus specific gravity (Rankine et al. 2006) Laboratory dry density (g/cm3) = 0.56 x Specific gravity (g/cm3). (2.1). The dry density (ρd) and void ratio (e) are related by:. ρd =. Gs .ρ w 1+ e. (2.2). Brandon et al. (2001) conducted large and small scale testing on the fabrication of silty sand specimens and concluded that the density of the specimens along a vertical profile varied less than 6% from the average density. Sample sizes range from 3.1 by 7.6 cm in diameter to 1.5 by 1.5 m in diameter). The porosity is given by:. 25.
(52) n=. e 1+ e. (2.3). Grice (1998 b) assumes the porosity of a free-draining hydraulic fill to be approximately 50%, whilst published in situ values (Nicholson and Wayment, 1964; Pettibone and Kealy, 1971; Potvin et al., 2005) have been in the range of 30 % - 50%. A summary of several published porosity values for a number of hydraulic fills is recorded in Table 2.3. Table 2.3. Published porosity values for hydraulic fills Author. Material Type Testing. Porosity No. of (%) Samples. Potvin et al (2005). Hydraulic fill. Assumed. 29 - 50. NA. Nicholson and Wayment (1964). Hydraulic fill. Laboratory. 41 - 48. 4. Grice (1998). Hydraulic fill. Assumed. 50. NA. Herget and De Korompay (1978). Hydraulic fill. In situ. 45 - 48. 2. Laboratory. 37. 1. Rankine et al. (2006). Hydraulic fill. Laboratory. 37 - 49. 24. Relative density is a good measure of the density of the grain packing, and it depends on the maximum and minimum possible void ratios for the soil, still maintaining intergranular contact. The relative density can be defined as:. Dr =. emax − ecurrent × 100% emax − emin. (2.4). The maximum void ratio is generally achieved by saturating the tailings and vibrating them to attain the densest possible packing whilst the minimum void ratio is generally determined by pouring the dry tailings from a fixed height so that the grains are placed at the loosest possible state. Using the two extreme void ratios and the current void ratio, the relative density of the fill is calculated from Eq. 2.4. Laboratory. 26.
(53) sedimentation exercises at James Cook University laboratories (Rankine et al. 2004), showed that when the slurry settles under its self-weight, the relative density of the fill is in the range of 40%-70%. These values suggest that the hydraulic fills settle to a dense packing of grains. Extensive in situ testing at various hydraulic fill operations around the world indicate hydraulic fills are typically placed at a medium-dense state, with a relative density of approximately 55% (Nicholson and Wayment, 1964; Pettibone and Kealy, 1971; Corson et al., 1981). Refer to Table 2.4 for a list of various published relative densities of a number of hydraulic fills. Table 2.4. Recorded relative density values of hydraulic fills. Material Type Testing. Relative No. of Density (%) Samples. Pettibone and Kealy (1971). Hydraulic fill Laboratory. 44 - 66. 4. Corson D.R. (1981). Hydraulic fill Assumed. 55. NA. Nicholosn and Wayment (1964)2 Hydraulic fill Laboratory. 51 - 65. 3. Rankine et al. (2006). 50 - 80. 9. Author 1. Hydraulic fill Laboratory. 1. Mine H data omitted (Relative density = 11%), as was an anomaly in results. 2. Mine H data omitted (Relative density = 23%) as produced highly variable results. The relative density of the fill also affects the shearing resistance. As the void ratio decreases the amount of space between grains is reduced resulting in a denser fill. The increase in density of the fill implies an increase in interparticle contact area, and thus, in shearing resistance of the fill (Terzaghi et al., 1996). The closely packed grains of a dense fill give a greater resistance to shear forces, as grains must be forced up and around adjoining grains.. 2.13.5 Friction Angle. Friction angle is an important parameter in the static and dynamic stability analysis of hydraulic fill mine stopes. Due to the limited access and safety issues, it is often difficult to carry out in situ tests within the stopes. Therefore laboratory tests such as direct shear testing on reconstituted samples are the preferred alternative.. 27.
(54) Several hydraulic fills have been reported with friction angles between 30º and 47º Bloss (1992), and published triaxial test results on several hydraulic fill samples across the world also fall within this range (Pettibone and Kealy, 1971; Nicholson and Wayment, 1964). As the friction angle increases, so does the shear strength of the fill. It should be noted that the hydraulic fill sample with a friction angle of 47˚ recorded by Bloss (1992) was recorded for a high density sample. Using reconstituted fills representing the in situ grain packing in the stope, a number of direct shear tests were conducted at James Cook University (Rankine et al. 2006). The tests reveal that the friction angles determined from direct shear tests are significantly higher than those determined for common granular soils. This can be attributed to the very angular grains that result from crushing the waste rock, which interlock more than the common granular soils. From limited experimental data, Rankine et al (2006) showed that a unique relationship exists between the friction angle of the hydraulic fill and the relative density.. 2.13.6 Placement Property Test. The initial water content of hydraulic fill has significant influence on the in situ void ratio.. A placement property test, proposed by Clarke (1988) is essentially a. compaction test, where the compactive effort is applied through 5 minutes of vibration on a vibrating table. The main objective of the placement property test is to identify the optimum water content for the hydraulic fill that gives the minimum porosity and thus maximum dry density on placement in the stope. It is important to note that although this test provides us with the optimum water content, the rheological requirements required for ease of transportation through pipes generally results in water contents much higher than the optimum water content. Fig. 2.8 illustrates porosity versus the water content for a sample tested at JCU (Rankine et al. 2006), where air contours are also shown. The shaded region, bounded by the horizontal maximum porosity (loosest state) and minimum porosity (densest state) lines at the top and bottom, and the saturation line on the right, is where the fill can exist with intergranular contact.. The intersection of the saturation line and the. 28.
Figure


+7
Related documents
