Children's Workforce Research
Gemma Deakin and Graham Kelly
BMRB Social Research
Research Report No 716
Children’s Workforce Research
Gemma Deakin and Graham Kelly
BMRB Social Research
The views expressed in this report are the authors’ and do not necessarily reflect those of the Department for Education and Skills.
Table of Contents
1 Introduction ... 1
1.1 Research Objectives ... 1
1.2 Research method ... 2
1.3 Arrangement of this report... 2
1.4 Presentation of results ... 2
1.5 Notes on reading the report ... 2
2 Management Summary... 3
2.1 Profile of respondents ... 3
2.2 Job satisfaction ... 3
2.3 Training ... 4
2.4 Safeguarding Children... 4
2.5 Information sharing... 4
2.6 Awareness and recognition ... 5
2.7 Communication ... 5
2.8 Impact of Every Child Matters on job and children’s services ... 6
3 Job satisfaction... 7
3.1 Satisfaction with current job ... 7
3.2 Reasons for job dissatisfaction ... 9
3.3 Attitudes towards working in children’s and young people’s services ... 9
3.3.1 ‘I enjoy working with children and young people as part of my job’ ... 9
3.3.2 ‘People who work with children and young people are not valued highly enough by society’ ... 11
3.3.3 ‘My job has good career prospects’ ... 13
3.3.5 Agreement with both “difficult to move between jobs” and “current job does not
have good career prospects”...17
4 Training ... 20
4.1 Awareness of Common Core of Skills, Knowledge and Competencies ... 20
4.2 How seriously organisation takes training opportunities ... 22
4.3 Awareness of activities or training to improve information sharing... 24
4.4 Awareness of activities or training for a Common Assessment Framework 26 5 Safeguarding Children... 29
5.1 Experience of guidelines/ standards... 29
5.2 Knowledge of what to do if a child or young person was being abused ... 31
6 Information sharing ... 34
6.1 Time spent finding out which other organisations are working with the same case 34 6.2 Partner organisations worked most closely with as part of current job... 36
6.3 Ways work with partner organisations ... 39
7 Awareness and recognition ... 43
7.1 Awareness of Every Child Matters ... 43
7.2 Whether known as Every Child Matters or Change for Children ... 45
7.3 Main issues covered by Every Child Matters programme... 47
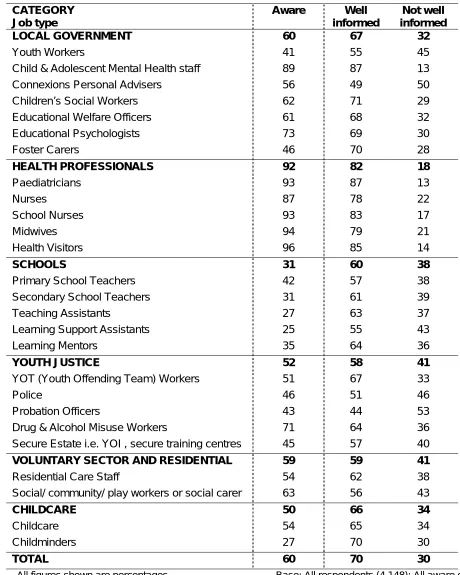
7.4 Awareness of specific elements of ECM and how well informed... 48
7.4.1 Core of training for those working with children and young people ... 48
7.4.2 Common occupational standards ... 50
7.4.3 High profile recruitment campaign... 52
7.4.4 A common assessment framework ... 54
7.4.5 Information sharing... 56
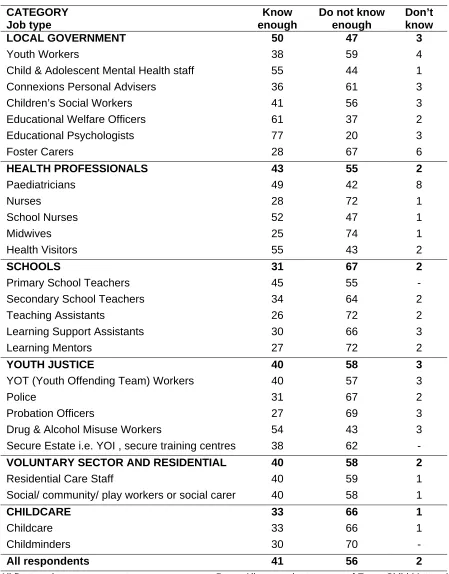
7.5 Knowing enough about Every Child Matters... 60
7.6 Aspect of Every Child Matters more information wanted to do job ... 62
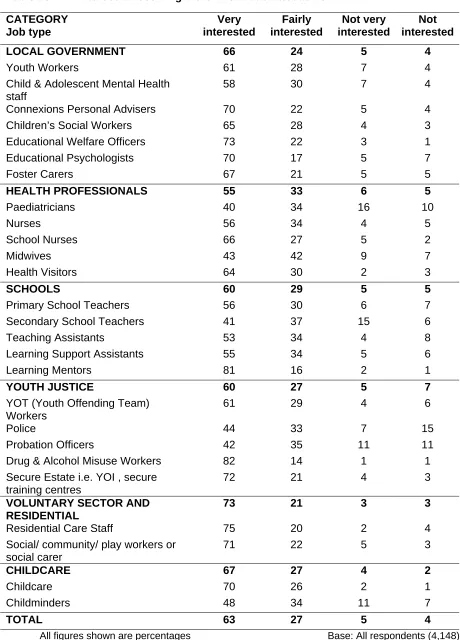
7.7 Interest in receiving more information about Every Child Matters ... 63
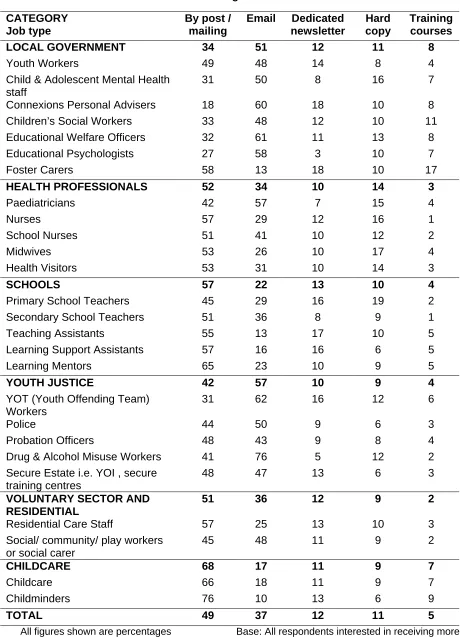
7.8 Preferred method for receiving information about Every Child Matters... 65
7.9 Topics of interest ... 67
8 Communication ... 70
8.1 How first became aware of Every Child Matters ... 70
8.2 How clear was information on Every Child Matters... 72
8.3 Involvement in discussions about Every Child Matters ... 74
8.4 How helpful were discussions?... 76
8.5 Whether discussions are planned ... 78
8.6 Likelihood of attending planned discussions ... 80
9 Impact of Every Child Matters on job and children’s services ... 81
9.1 Difference Every Child Matters will make to job in near future ... 81
9.2 Whether services are more or less joined-up than they were one year ago . 83 9.3 Influence of Every Child Matters on referrals... 85
9.4 Extent that Every Child Matters will improve outcomes for children using services... 85
Appendices... 88
A. Profile of respondents ... 89
category and job type ... 89
A1. Length of time in current job... 90
A2. Full-time/ part time ... 91
A3. Time working with children in typical day ... 93
A5. Age of children worked with ... 95
A6. Peripatetic role ... 97
A7. Working with children with additional needs ... 98
B Demographic profile of respondents ... 101
Summary of demographic profile... 104
C. Research Method ... 105
C1. Sampling ... 105
C2. Fieldwork... 106
C3. Analysis... 108
Coding ... 108
Attitudes towards working in children’s and young peoples services ... 109
D: Survey fieldwork report ... 110
E: Pre-notification letters ... 111
1 Introduction
The Government published the Every Child Matters: Change for Children (ECM) Green Paper in 2003. The Green Paper recommended the overhaul of services to children and young people and the improvement of outcomes for children, and their families, in a number of different ways and settings.
The aim of Every Child Matters is for every child, whatever their background or their circumstances, to have the support they need to:
Be healthy Stay safe
Enjoy and achieve
Make a positive contribution Achieve economic well-being
This means that the organisations involved with providing services to children - from hospitals and schools, to police and voluntary groups - will be teaming up in new ways, sharing information and working together, to protect children and young people from harm and help them achieve what they want in life. Children and young people will have far more say about issues that affect them as individuals and collectively.
Further information about the Every Child Matters programme can be found at http://www.everychildmatters.gov.uk/
1.1 Research
Objectives
Research was required to establish the baseline perceptions of key groups of staff involved in the delivery of the Every Child Matters agenda.
The broad objectives of the research were to:
• Obtain baseline perceptions of staff in the six key categories comprising the ECM Children’s Workforce:
• To gauge levels of awareness and understanding of the ECM agenda, • To gauge the impact of the ECM delivery agenda on working practices,
• To gauge levels of joined-up-ness amongst staff involved in the delivery of the agenda,
• To gauge the effectiveness of the ECM agenda generally,
• To identify any issues arising from the introduction of the ECM agenda.
1.2 Research
method
The sample consisted of workers in 26 different job-types involved in delivering services for children and young people. The job types have been grouped under six headings for the purposes of presentation and analysis, however we recognise that many workers deliver services in a range of settings therefore there is likely to be overlap between groups. Targets of either 100 or 200 were set for each job-type. This wave of fieldwork sets out the baseline for future waves of the survey. For more information about the sample see Appendix C.
1.3
Arrangement of this report
Directly following this introduction is a management summary of the study findings. This is followed by the main body of the report. This provides a detailed commentary, illustrated by summary charts and tables.
Appendices contain details of the profile of respondent, research and sampling method, fieldwork, the questionnaire and other fieldwork documents.
1.4
Presentation of results
The number of workers differs greatly across job types, from a few thousand Educational Psychologists, to hundreds of thousands of teachers. It was decided not to weight the data, and this should be considered when examining “total” and “category” data figures as they are provided for illustrative purposes only, and should not be viewed as generalisable to the total or category.
Please note that the following conventions have been used in charts and tables in this report:
1.5
Notes on reading the report
0 or - = a "true zero" (i.e. no responses in that category) * = less than 0.5%, but more than zero responses
All figures in tables are percentages unless otherwise indicated
‘Prompted’ means that respondents were read a list of possible responses by the interviewer and could indicate which items on the list applied to them
2 Management
Summary
2.1
Profile of respondents
“Total” and “category” data have not been weighted to reflect the differing sizes of the populations in the job types. Therefore “total” and “category” figures are provided for illustrative purposes and should not be viewed as an accurate estimation of the picture for the “total” or “category”.
Workers across 26 job-types were interviewed. These 26 groups were split across 6 categories: Local government, NHS acute primary care (Health Professionals), Schools, Youth Justice, Voluntary Sector and Residential, and Childcare. These 26 job types will form the basis of analysis throughout the report.
Length of time workers have been in their current job varies between the job-types. Long-serving staff were most likely to be found in the Health services while workers new to the post (less than one year’s service) were most likely to be found in Youth Justice.
Overall one in five worked part-time in their current job. This was more common within Schools and Health services, but quite rare in Youth Justice.
Further information on the profile of respondents can be found in the technical appendix.
2.2 Job
satisfaction
Nine in ten were satisfied with their current job.
Only 6% were dissatisfied with their current job. The main reasons mentioned for job dissatisfaction were not having enough resources to do the job and having a heavy workload (both mentioned by one third).
Agreement with the statement ‘I enjoy working with children and young people as part of my job’ was high across all job types, at 90% for all but three job types.
Two thirds (68%) of all respondents agreed (‘a lot or ‘a little’) that people who work with children and young people are not valued highly enough by society.
Nearly two-thirds (62%) of workers agreed (‘a lot’ or ‘a little’) that their current job had good career prospects.
Overall two-fifths (38%) agreed (‘a lot’ or ‘a little’) that it was difficult to move between jobs across children’s and young people’s services.
2.3 Training
This chapter looks at awareness and knowledge of the skills and training for staff that form part of Every Child Matters.
In general most workers were either not aware, or had little knowledge about the Common Core of Skills Competencies for those working with children and young people. Among the better informed workers were Educational Welfare Officers, Educational Psychologists and Children’s Social Workers, but Schools and Childcare staff had particularly low levels of awareness and knowledge.
The vast majority thought that their organisation took training opportunities ‘very’ or ‘quite’ seriously.
Awareness of training for information sharing ranged from 77% among Educational Welfare Officers to 39% among Secure Estate workers, with Schools again exhibiting lower awareness levels than other categories.
The level of awareness of training activities for the Common Assessment Framework was overall slightly lower than for information sharing. Again Educational Welfare Officers were the workers who were most likely to be aware (74%). Those working in Schools were again at the lower end of the awareness scale.
2.4 Safeguarding
Children
Most respondents had either used (54%) or seen (24%) the central government guidance that covers the need to safeguard and promote the welfare of children and young people. Nearly all respondents (99%) said they knew what to do if a child or young person was being abused. Actions they were likely to take if they were working with a child or young person who was being abused included informing social services (48%), following child protection procedures (44%) and telling their supervisor, then making a decision (35%).
2.5 Information
sharing
When asked how long they spent finding out which other organisations were working with a particular case, over a third of YOT Workers (37%), School Nurses (36%) and Social Workers (35%) said they spent more than one hour. The majority of workers in other groups said they typically spent less than an hour, or that it varied too much to say.
Of all the partner organisations the one that most respondents worked with as part of their current job was the Local Authority. The second most frequently mentioned were Schools, and the third was NHS hospital/ Primary Care Trust.
2.6
Awareness and recognition
Altogether, eight in ten (79%) respondents were aware of Every Child Matters.
Awareness of Every Child Matters was higher among Local Government workers (90%) but lower among Childcare (69%) and School staff (70%).
Most respondents (88%) knew the programme by the term ‘Every Child Matters’ and only a few (three per cent) knew it exclusively as ‘Change for Children’.
The most commonly acknowledged issues covered by Every Child Matters included protecting and safeguarding children, and services sharing information and working together. Both of these issues were spontaneously mentioned by 28% of respondents.
We then checked ‘prompted awareness’. Respondents were asked if they were aware of six specific elements of Every Child Matters and if so how well informed they were about them. Respondents were most likely to be aware of information sharing across services or agencies (87%) and least likely to be aware of a high profile recruitment campaign (29% aware).
Three quarters (74%) of respondents were aware of a common assessment framework, three fifths (60%) were aware of the common core of training for those working with children and young people, and the same proportion were aware of the national services framework for children, young people and maternity services. Half (49%) were aware of common occupational standards across different children’s and young people’s services.
More than half of those aware of Every Child Matters thought they did not know enough about it for doing their current job, and two thirds said they would welcome more information. Interest in receiving more information about Every Child Matters was high. Overall just nine per cent said they did not want any information. The proportion not wanting information was higher among Police, Probation Officers and Paediatricians.
The preferred methods for receiving information were by post/mailing and by email.
Of those who wanted more information, nearly all said they would be interested in receiving more information about information sharing, the Common Assessment Framework, the Local Safeguarding Children Board and the role of the lead professional.
2.7 Communication
Overall the information received was rated as ‘fairly clear’ (61%). Nineteen per cent rated the information as ‘very clear’. Fourteen per cent said the information was ‘not clear’.
Only around one third of respondents had had formal training formal meeting(s) about Every Child Matters, though 63% of workers had been involved in formal and/or informal discussions. Thirty six per cent had not been involved in discussions yet.
Of those who had been involved in discussions, 36% had found the discussions ‘very helpful’, 56% found them ‘fairly helpful’, six per cent found them ‘fairly unhelpful’ and just one per cent found the discussions ‘very unhelpful’.
Among workers who had not been involved in discussions yet, just 12% said that discussions were planned for them. Only four workers said they would be unlikely to attend the discussions that were planned for them. The main reasons for this were work commitments and meeting clashes.
The survey findings suggest that relevant workers have interest in Every Child Matters, but that the ‘roll-out’ of necessary information needs to reach a wider audience, with clearer information.
2.8
Impact of Every Child Matters on job and children’s services
A quarter (25%) thought Every Child Matters would make a great deal of difference to their job. A further 39% said it would make a fair amount of difference, 22% said it would make ‘not very much’ difference’ and four per cent thought it would make no difference at all. Over half of Educational Psychologists (58%) thought that Every Child Matters would make a great deal of difference to their job. This was the highest level out of all the job-types.
On balance, services are thought to be a little more joined up than one year ago. Twenty-six per cent of respondents thought that services for children and young people were ‘more joined up’, 40% said ‘a little more joined-up’; a further 22% said there was ‘no difference’. Only two per cent thought services had become less joined up and 10% did not know. Opinion is evenly split in terms of the impact on referrals. Amongst CAMHs, Social Workers, Educational Psychologists and Paediatricians on average around two in five thought Every Child Matters would increase the number of referrals to their service, and the same proportion thought it would make no difference to referrals. Only eight per cent expect a reduction in referrals.
3 Job
satisfaction
This section covers satisfaction with current job and, if dissatisfied, reasons for job dissatisfaction. Respondents were also presented with a list of statements about their job and working in children’s and young people’s services, to which they had to rate their agreement/ disagreement. These statements gauge how much those working in children’s and young people’s services think their job has good career prospects and how much society values such workers among other measures.
3.1
Satisfaction with current job
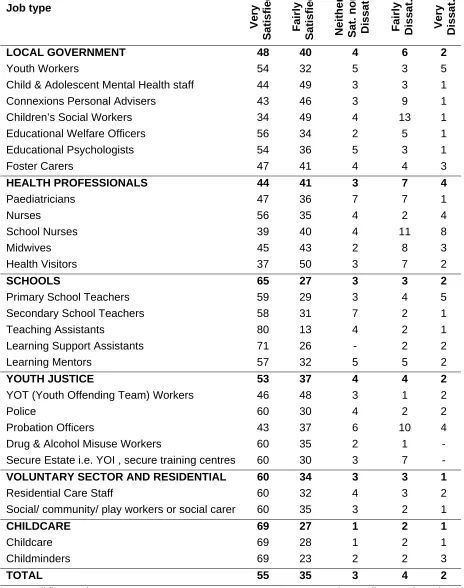
Overall, over half (55%) of respondents said they were very satisfied with their job and 35% were fairly satisfied. This total of 90% satisfied compares well with figures for workers across all children’s services, among whom 79% feel positive about their job satisfaction1.
Relatively few were dissatisfied; four per cent were slightly dissatisfied and two per cent were very dissatisfied.
Job satisfaction was high across all job types, with those working as Teaching Assistants most likely to say they were very satisfied (80%).
Dissatisfaction was highest among School Nurses (18%), Probation Officers (14%) and Children’s Social Workers (13%) (Either ‘very’ or ‘fairly dissatisfied’).
Table 1 Satisfaction with current job
CATEGORY Job type
Very
Satisfied Fairly Satisfied Neither Sat. nor Dissat Fairly Dissat.
Very
Dissat.
LOCAL GOVERNMENT 48 40 4 6 2
Youth Workers 54 32 5 3 5
Child & Adolescent Mental Health staff 44 49 3 3 1
Connexions Personal Advisers 43 46 3 9 1
Children’s Social Workers 34 49 4 13 1
Educational Welfare Officers 56 34 2 5 1
Educational Psychologists 54 36 5 3 1
Foster Carers 47 41 4 4 3
HEALTH PROFESSIONALS 44 41 3 7 4
Paediatricians 47 36 7 7 1
Nurses 56 35 4 2 4
School Nurses 39 40 4 11 8
Midwives 45 43 2 8 3
Health Visitors 37 50 3 7 2
SCHOOLS 65 27 3 3 2
Primary School Teachers 59 29 3 4 5
Secondary School Teachers 58 31 7 2 1
Teaching Assistants 80 13 4 2 1
Learning Support Assistants 71 26 - 2 2
Learning Mentors 57 32 5 5 2
YOUTH JUSTICE 53 37 4 4 2
YOT (Youth Offending Team) Workers 46 48 3 1 2
Police 60 30 4 2 2
Probation Officers 43 37 6 10 4
Drug & Alcohol Misuse Workers 60 35 2 1 -
Secure Estate i.e. YOI , secure training centres 60 30 3 7 -
VOLUNTARY SECTOR AND RESIDENTIAL 60 34 3 3 1
Residential Care Staff 60 32 4 3 2
Social/ community/ play workers or social carer 60 35 3 2 1
CHILDCARE 69 27 1 2 1
Childcare 69 28 1 2 1
Childminders 69 23 2 2 3
TOTAL 55 35 3 4 2
3.2
Reasons for job dissatisfaction
Only 6% were (‘very’ or ‘fairly’) dissatisfied, with their current job, and these respondents were asked why they were dissatisfied. The most commonly mentioned reasons are shown in chart 1.
Chart 1 Reasons for job dissatisfaction
Base: All respondents who were dissatisfied with their current job (268)
The main reasons mentioned for job dissatisfaction were not having enough resources to do the job (34%) and having a heavy workload (33%).
The numbers within individual job-types are too small to allow for analysis at that level.
3.3
Attitudes towards working in children’s and young people’s services
Respondents were asked to rate their agreement to a series of four statements about attitudes towards working in children’s and young people’s services. The possible responses were ‘agree a lot’, ‘agree a little’, ‘neither agree or disagree’, ‘disagree a little’ and ‘disagree a lot’.
3.3.1 ‘I enjoy working with children and young people as part of my job’
Agreement with the statement ‘I enjoy working with children and young people as part of my job’ was high for across all job types. Levels of agreement for each job type and category are shown in table 2.
7%
8%
9%
10%
12%
12%
33%
34%
Workload too heavy
Not paid enough
Not respected enough
Too much bureaucracy
Management issues
Not enough staff
Not enough emphasis on
working with children
Not enough resources
Other reasons
mentioned by 4% or
Table 2 Agreement with ‘I enjoy working with children and young people as part of my job’
CATEGORY
Job type
Agree a
lot
Agree a little Neither
agree or disagree Disagree
a little
Disagree
a lot
LOCAL GOVERNMENT 97 2 * * *
Youth Workers 96 2 - - -
Child & Adolescent Mental Health staff 98 1 1 - 1
Connexions Personal Advisers 96 5 - - -
Children’s Social Workers 97 1 1 1 -
Educational Welfare Officers 96 3 1 - -
Educational Psychologists 99 1 - - -
Foster Carers 99 1 - - -
HEALTH PROFESSIONALS 95 4 1 * *
Paediatricians 98 2 - - -
Nurses 94 6 1 1 -
School Nurses 100 1 - - -
Midwives 89 7 3 8 1
Health Visitors 97 2 1 - -
SCHOOLS 99 1 - - -
Primary School Teachers 98 2 - - -
Secondary School Teachers 98 2 - - -
Teaching Assistants 98 2 - - -
Learning Support Assistants 99 1 - - -
Learning Mentors 97 2 1 - -
YOUTH JUSTICE 90 8 1 1 *
YOT (Youth Offending Team) Workers 98 1 - - -
Police 85 13 - 1 -
Probation Officers 79 15 3 2 1
Drug & Alcohol Misuse Workers 98 2 - - -
Secure Estate i.e. YOI , secure training centres 91 7 1 - -
VOLUNTARY SECTOR AND RESIDENTIAL 98 2 * - -
Residential Care Staff 99 1 - - -
Social/ community/ play workers or social carer 97 3 1 - -
CHILDCARE 99 1 * - -
Childcare 99 1 * - -
Childminders 99 1 - - -
TOTAL 97 3 * * *
Almost all job types had nine in ten or more replying “agree a lot”. The only job types with a different response pattern to the norm were Probation Officers and Police, but even here there was high agreement; 79% and 85% agree ‘a lot’.
3.3.2 ‘People who work with children and young people are not valued highly enough by society’
Table 3 Agreement with ‘people who work with children and young people are not valued highly enough by society’
CATEGORY
Job type
Agree a
lot
Agree a little Neither
agree or disagree Disagree
a little
Disagree
a lot
LOCAL GOVERNMENT 48 20 7 16 6
Youth Workers 61 18 4 13 2
Child & Adolescent Mental Health staff 34 16 11 21 14
Connexions Personal Advisers 39 24 8 21 7
Children’s Social Workers 64 16 7 9 3
Educational Welfare Officers 46 21 7 17 6
Educational Psychologists 34 27 9 21 7
Foster Carers 64 15 2 10 6
HEALTH PROFESSIONALS 35 18 9 21 15
Paediatricians 29 24 7 19 19
Nurses 29 12 10 27 21
School Nurses 44 20 10 14 11
Midwives 30 19 12 22 16
Health Visitors 41 17 6 23 10
SCHOOLS 47 20 6 17 9
Primary School Teachers 50 22 4 15 9
Secondary School Teachers 49 22 10 16 2
Teaching Assistants 40 18 5 23 12
Learning Support Assistants 47 22 6 16 9
Learning Mentors 48 18 5 18 11
YOUTH JUSTICE 43 21 7 19 7
YOT (Youth Offending Team) Workers 47 24 6 19 1
Police 42 18 6 19 12
Probation Officers 50 17 7 18 6
Drug & Alcohol Misuse Workers 31 29 7 22 8
Secure Estate i.e. YOI , secure training centres 43 15 12 18 12
VOLUNTARY SECTOR AND RESIDENTIAL 59 22 5 9 5
Residential Care Staff 59 20 3 11 7
Social/ community/ play workers or social carer 60 24 7 7 3
CHILDCARE 65 18 5 6 5
Childcare 67 18 4 6 5
Childminders 57 20 9 8 6
TOTAL 48 20 7 16 8
All figures shown are percentages Base: All respondents (4,148)
Residential staff where 84% and 81% of respondents agreed (either ‘a lot’ or ‘a little’); likewise, agreement was high among Foster Carers (79%).
Among Health Professionals there was a less negative view on this measure, with one third (35%) agreeing ‘a lot’. However, interestingly School Nurses were more negative than other Health Professionals, with 64% agreeing ‘a lot’, which was close to the average for Schools staff (67% agree ‘a lot’).
3.3.3 ‘My job has good career prospects’
Table 4 Agreement with ‘my job has good career prospects’
CATEGORY
Job type
Agree a
lot
Agree a little Neither
agree or disagree Disagree
a little
Disagree
a lot
LOCAL GOVERNMENT 31 27 7 14 19
Youth Workers 29 24 7 16 22
Child & Adolescent Mental Health staff 24 30 10 16 18
Connexions Personal Advisers 24 30 10 16 18
Children’s Social Workers 44 30 3 11 11
Educational Welfare Officers 23 27 7 16 25
Educational Psychologists 37 34 5 12 11
Foster Carers 15 12 6 19 44
HEALTH PROFESSIONALS 36 28 6 12 16
Paediatricians 49 19 10 9 11
Nurses 46 24 5 9 16
School Nurses 24 35 6 15 21
Midwives 40 24 6 15 17
Health Visitors 29 34 7 12 15
SCHOOLS 31 23 7 16 22
Primary School Teachers 42 26 7 13 11
Secondary School Teachers 43 24 9 11 11
Teaching Assistants 35 26 8 16 15
Learning Support Assistants 29 24 6 17 24
Learning Mentors 20 19 6 18 36
YOUTH JUSTICE 38 31 6 11 12
YOT (Youth Offending Team) Workers 38 30 4 15 12
Police 42 31 9 10 7
Probation Officers 34 35 3 11 17
Drug & Alcohol Misuse Workers 40 30 9 9 11
Secure Estate i.e. YOI , secure training centres 39 30 6 10 15
VOLUNTARY SECTOR AND RESIDENTIAL 46 27 4 12 10
Residential Care Staff 53 28 4 8 8
Social/ community/ play workers or social carer 39 27 4 17 13
CHILDCARE 40 22 7 14 16
Childcare 44 24 7 12 13
Childminders 23 15 7 21 33
TOTAL 36 26 6 13 17
All figures shown are percentages Base: All respondents (4,148)
agree that their current jobs had good career prospects. Foster Carers (27%), Childminders (38%) and Learning Mentors (39%) were the workers least likely to agree with this statement. Interestingly, workers who thought that Every Child Matters was likely to make a difference to their job (see section 9.1) were more likely to agree that their current job had good career prospects than those who thought Every Child Matters would make little or no difference to their job (68% compared with 51%).
3.3.4 It is difficult to move between different types of jobs across different children’s and young people’s services
Table 5 Agreement with ‘it is difficult to move between different types of jobs across different children’s and young people’s services’
CATEGORY
Job type
Agree a
lot
Agree a little Neither
agree or disagree Disagree
a little
Disagree
a lot Don’t know
LOCAL GOVERNMENT 20 18 7 28 19 7
Youth Workers 15 13 8 38 17 10
Child & Adolescent Mental Health staff 19 17 7 30 21 5
Connexions Personal Advisers 16 25 5 30 15 10
Children’s Social Workers 11 10 6 36 33 4
Educational Welfare Officers 23 20 4 26 23 3
Educational Psychologists 36 22 10 17 10 4
Foster Carers 25 16 16 14 15 14
HEALTH PROFESSIONALS 26 20 10 21 14 8
Paediatricians 25 24 16 19 9 7
Nurses 24 15 8 26 20 8
School Nurses 20 24 10 27 17 5
Midwives 31 18 13 14 12 13
Health Visitors 32 22 8 19 10 8
SCHOOLS 19 17 9 27 15 12
Primary School Teachers 28 16 10 22 12 12
Secondary School Teachers 25 23 6 24 10 12
Teaching Assistants 11 17 15 26 20 11
Learning Support Assistants 18 14 10 28 16 16
Learning Mentors 18 19 8 30 19 9
YOUTH JUSTICE 15 14 11 32 20 9
YOT (Youth Offending Team) Workers 15 17 6 34 26 2
Police 10 3 24 24 17 9
Probation Officers 17 17 9 31 17 9
Drug & Alcohol Misuse Workers 16 16 6 37 19 5 Secure Estate i.e. YOI , secure training
centres
15 18 12 31 19 4
VOLUNTARY SECTOR AND RESIDENTIAL
14 15 6 30 28 8
Residential Care Staff 17 18 5 26 28 8
Social/ community/ play workers or social carer
11 13 7 34 29 8
CHILDCARE 15 21 9 32 16 6
Childcare 14 22 8 33 18 4
Childminders 24 16 15 26 7 12
TOTAL 20 18 9 27 18 8
Those most likely to view movement as difficult were Educational Psychologists (58%) and Health Visitors (54%). Police (13%), Children’s Social Workers (22%) and social and community workers in children’s charities (24%) were less likely to foresee such difficulties. Perceptions of difficulty in moving between jobs in children’s services was associated with feelings of job dissatisfaction. Agreement was higher among dissatisfied workers than among satisfied workers (49% compared with 37%). Agreement also increased by length of time the respondents had been in their current jobs with a third (33%) of respondents who had been in their job for less than two years expressing agreement compared with 44% of those in their current job for more than ten years.
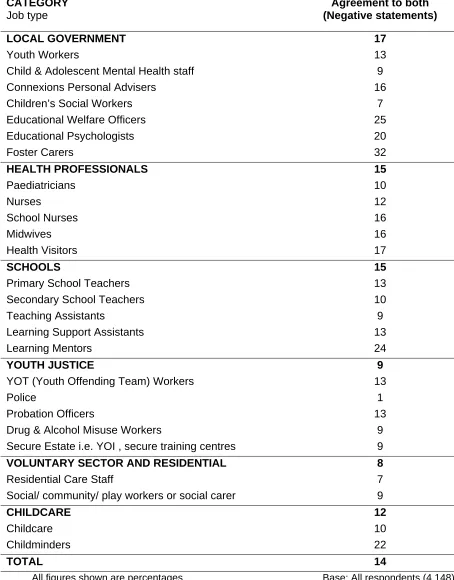
3.3.5 Agreement with both “difficult to move between jobs” and “current job does not have good career prospects”
Table 6 It is difficult to move between jobs and their current job does not have good career prospects
CATEGORY
Job type
Agreement to both (Negative statements)
LOCAL GOVERNMENT 17
Youth Workers 13
Child & Adolescent Mental Health staff 9
Connexions Personal Advisers 16
Children’s Social Workers 7
Educational Welfare Officers 25
Educational Psychologists 20
Foster Carers 32
HEALTH PROFESSIONALS 15
Paediatricians 10
Nurses 12
School Nurses 16
Midwives 16
Health Visitors 17
SCHOOLS 15
Primary School Teachers 13
Secondary School Teachers 10
Teaching Assistants 9
Learning Support Assistants 13
Learning Mentors 24
YOUTH JUSTICE 9
YOT (Youth Offending Team) Workers 13
Police 1
Probation Officers 13
Drug & Alcohol Misuse Workers 9
Secure Estate i.e. YOI , secure training centres 9
VOLUNTARY SECTOR AND RESIDENTIAL 8
Residential Care Staff 7
Social/ community/ play workers or social carer 9
CHILDCARE 12
Childcare 10
Childminders 22
TOTAL 14
All figures shown are percentages Base: All respondents (4,148)
4 Training
This chapter will cover awareness and knowledge about the common core of skills, knowledge and competencies for those working with children and young people, and how seriously workers think their organisation takes training opportunities and training activities for information sharing and the Common Assessment Framework.
4.1
Awareness of Common Core of Skills, Knowledge and Competencies
The Common Core of Skills, Knowledge and Competencies for the Children's Workforce sets out the basic skills and knowledge needed for those working with children and young people. The common core will enable multi-disciplinary teams to work together more effectively in the interests of the child.
Respondents were asked whether they had ever heard of the Common Core of Skills, Knowledge and Competence, and those who said they were aware of it were asked how much they knew about it. Table 7 show each job-type split between those:
• aware and having knowledge2,
• aware but with little/ no knowledge3,
• not aware at all.
2 This comprises those saying ‘a great deal’ or ‘fair amount’
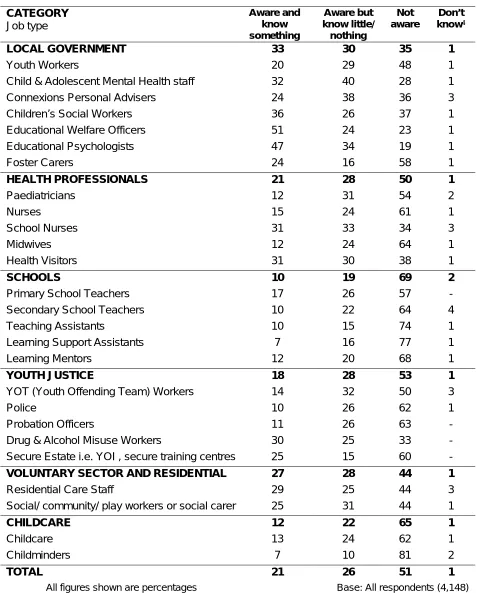
Table 7 Awareness of Common Core of Skills, Knowledge and Competencies CATEGORY Job type Aware and know something Aware but know little/ nothing Not aware Don’t know4
LOCAL GOVERNMENT 33 30 35 1
Youth Workers 20 29 48 1
Child & Adolescent Mental Health staff 32 40 28 1
Connexions Personal Advisers 24 38 36 3
Children’s Social Workers 36 26 37 1
Educational Welfare Officers 51 24 23 1
Educational Psychologists 47 34 19 1
Foster Carers 24 16 58 1
HEALTH PROFESSIONALS 21 28 50 1
Paediatricians 12 31 54 2
Nurses 15 24 61 1
School Nurses 31 33 34 3
Midwives 12 24 64 1
Health Visitors 31 30 38 1
SCHOOLS 10 19 69 2
Primary School Teachers 17 26 57 -
Secondary School Teachers 10 22 64 4
Teaching Assistants 10 15 74 1
Learning Support Assistants 7 16 77 1
Learning Mentors 12 20 68 1
YOUTH JUSTICE 18 28 53 1
YOT (Youth Offending Team) Workers 14 32 50 3
Police 10 26 62 1
Probation Officers 11 26 63 -
Drug & Alcohol Misuse Workers 30 25 33 -
Secure Estate i.e. YOI , secure training centres 25 15 60 -
VOLUNTARY SECTOR AND RESIDENTIAL 27 28 44 1
Residential Care Staff 29 25 44 3
Social/ community/ play workers or social carer 25 31 44 1
CHILDCARE 12 22 65 1
Childcare 13 24 62 1
Childminders 7 10 81 2
TOTAL 21 26 51 1
All figures shown are percentages Base: All respondents (4,148)
4 ‘Don’t know’ responses are made up of those who did not know if they were aware and those who
Overall, only one in five were both aware and felt knowledgeable. One quarter were aware but knew little, leaving half totally unaware of the Common Core of Skills, Knowledge and Competencies.
These figures show that awareness and knowledge is related to the nature of the job. Jobs involving a great deal of multi-agency working tended to have higher awareness and
knowledge. Of the 26 job-types, awareness and knowledge of the Common Core of Skills, Knowledge and Competence was highest amongst Educational Welfare Officers (51%), Educational Psychologists (47%) and Children’s Social Workers (36%).
The proportion that were aware was lowest among Childminders, Learning Support Assistants and Teaching Assistants where at least 74% were not aware.
4.2
How seriously organisation takes training opportunities
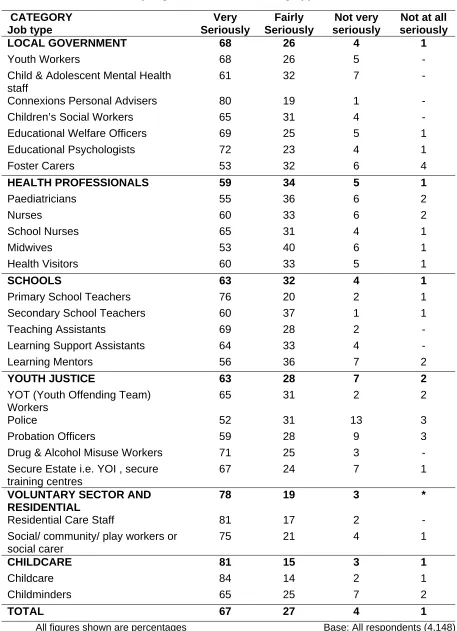
Table 8 How seriously organisation takes training opportunities CATEGORY Job type Very Seriously Fairly Seriously Not very seriously
Not at all seriously
LOCAL GOVERNMENT 68 26 4 1
Youth Workers 68 26 5 -
Child & Adolescent Mental Health staff
61 32 7 -
Connexions Personal Advisers 80 19 1 -
Children’s Social Workers 65 31 4 -
Educational Welfare Officers 69 25 5 1
Educational Psychologists 72 23 4 1
Foster Carers 53 32 6 4
HEALTH PROFESSIONALS 59 34 5 1
Paediatricians 55 36 6 2
Nurses 60 33 6 2
School Nurses 65 31 4 1
Midwives 53 40 6 1
Health Visitors 60 33 5 1
SCHOOLS 63 32 4 1
Primary School Teachers 76 20 2 1
Secondary School Teachers 60 37 1 1
Teaching Assistants 69 28 2 -
Learning Support Assistants 64 33 4 -
Learning Mentors 56 36 7 2
YOUTH JUSTICE 63 28 7 2
YOT (Youth Offending Team) Workers
65 31 2 2
Police 52 31 13 3
Probation Officers 59 28 9 3
Drug & Alcohol Misuse Workers 71 25 3 -
Secure Estate i.e. YOI , secure training centres
67 24 7 1
VOLUNTARY SECTOR AND RESIDENTIAL
78 19 3 *
Residential Care Staff 81 17 2 -
Social/ community/ play workers or social carer
75 21 4 1
CHILDCARE 81 15 3 1
Childcare 84 14 2 1
Childminders 65 25 7 2
TOTAL 67 27 4 1
All figures shown are percentages Base: All respondents (4,148)
Advisers (80%) were most likely to say that their employer takes training opportunities very seriously. Slightly less positive scores were found amongst Youth Justice and Health workers, though generally they were still quite positive. Seventeen per cent of Police thought that training opportunities were not taken very seriously or not taken seriously at all. The corresponding figure was 12% among probation staff and nine per cent among Secure Estate workers.
4.3
Awareness of activities or training to improve information sharing
Good practice on information sharing between Local Authorities and other agencies who work with children and young people is considered key for early intervention for helping those at risk of poor outcomes. It is through training of managers and practitioners that the cultural barriers within each agency are broken down and mechanisms for multi-agency information sharing can be facilitated.
Table 9
Whether respondent aware of activities or training to improve
information sharing
CATEGORY Job type
Yes No Don’t know
LOCAL GOVERNMENT 66 33 1
Youth Workers 56 43 1
Child & Adolescent Mental Health staff 66 33 1
Connexions Personal Advisers 66 34 1
Children’s Social Workers 64 35 1
Educational Welfare Officers 77 23 1
Educational Psychologists 74 25 1
Foster Carers 63 35 2
HEALTH PROFESSIONALS 61 38 1
Paediatricians 64 36 -
Nurses 50 50 1
School Nurses 66 34 1
Midwives 59 41 1
Health Visitors 68 30 1
SCHOOLS 45 54 1
Primary School Teachers 55 43 2
Secondary School Teachers 41 58 1
Teaching Assistants 42 57 1
Learning Support Assistants 45 56 -
Learning Mentors 46 53 2
YOUTH JUSTICE 56 43 1
YOT (Youth Offending Team) Workers 61 38 1
Police 49 51 -
Probation Officers 64 35 1
Drug & Alcohol Misuse Workers 63 37 -
Secure Estate i.e. YOI , secure training centres 39 60 1
VOLUNTARY SECTOR AND RESIDENTIAL 58 41 1
Residential Care Staff 62 38 1
Social/ community/ play workers or social carer 55 44 2
CHILDCARE 65 34 1
Childcare 64 34 1
Childminders 68 31 1
TOTAL 60 39 1
All figures shown are percentages Base: All respondents (4,148)
4.4 Awareness of activities or training for a Common Assessment
Framework
The Common Assessment Framework (CAF) is a nationally standardised approach to conducting an assessment of the needs of a child or young person and deciding how those needs should be met. This will assist with early preventative intervention rather than the previous approach that focused on dealing with the consequences. It will also also allow for greater information sharing between agencies working with the same child or family. The CAF is particularly useful in Education and Health, the ‘universal’ services. The aim is for all Local Authorities to implement the CAF between April 2006 and 2008 so they should be training staff throughout 2005 and 2006 on how to use it.
Table 10 Whether respondent aware of activities or training for a CAF
CATEGORY Job type
Yes No Don’t know
LOCAL GOVERNMENT 56 43 1
Youth Workers 36 62 1
Child & Adolescent Mental Health staff 62 37 1
Connexions Personal Advisers 51 47 3
Children’s Social Workers 64 35 1
Educational Welfare Officers 74 25 1
Educational Psychologists 68 32 -
Foster Carers 40 59 1
HEALTH PROFESSIONALS 48 52 1
Paediatricians 43 56 1
Nurses 26 72 2
School Nurses 63 37 -
Midwives 32 68 -
Health Visitors 71 29 -
SCHOOLS 25 74 1
Primary School Teachers 29 70 1
Secondary School Teachers 38 61 1
Teaching Assistants 22 76 2
Learning Support Assistants 24 76 1
Learning Mentors 19 80 3
YOUTH JUSTICE 44 55 *
YOT (Youth Offending Team) Workers 51 49 -
Police 38 62 -
Probation Officers 42 58 -
Drug & Alcohol Misuse Workers 48 49 2
Secure Estate i.e. YOI , secure training centres 40 60 -
VOLUNTARY SECTOR AND RESIDENTIAL 48 51 1
Residential Care Staff 48 53 -
Social/ community/ play workers or social carer 49 49 2
CHILDCARE 41 58 1
Childcare 43 56 1
Childminders 30 67 3
TOTAL 45 54 1
All figures shown are percentages Base: All respondents (4,148)
5 Safeguarding
Children
This chapter covers awareness and experience of current guidelines or standards for handling cases of child abuse, as well as knowledge of what to do if a child or young person was being abused.
5.1
Experience of guidelines/ standards
Respondents were asked about their experience of central government guidance that covers the need to safeguard and promote the welfare of children and young people. An example of such guidelines are "Safeguarding Children in Education' and "Working together to Safeguard Children"5. Respondents could indicate whether they had used these guidelines, if
they had seen these guidelines but had not used them, or if they had not seen these guidelines. The experience of these guidelines for all respondents, and also for each job type, is shown in Table 11.
5 Childminders were asked about their experience of National standards for under 8's day care and
Table 11 Experience of guidance/ standards to safeguard children
All figures shown are percentages Base: All respondents (4,148)
Voluntary Sector and Residential staff have the most experience and Schools staff the least, but the data show remarkable consistency across other categories. Just over half (54%) of all respondents had used the guidelines; a further quarter (24%) had seen the guidelines but
CATEGORY Job type
Used guidelines Seen but not used guidelines Not seen guidelines Don’t know
LOCAL GOVERNMENT 55 25 17 2
Youth Workers 44 24 28 4
Child & Adolescent Mental Health staff 56 30 10 4
Connexions Personal Advisers 31 35 32 3
Children’s Social Workers 84 11 5 -
Educational Welfare Officers 87 10 2 1
Educational Psychologists 46 42 11 1
Foster Carers 57 19 22 2
HEALTH PROFESSIONALS 55 23 20 1
Paediatricians 50 24 24 2
Nurses 45 27 27 2
School Nurses 74 19 6 2
Midwives 32 27 39 3
Health Visitors 73 22 5 -
SCHOOLS 42 26 31 1
Primary School Teachers 42 39 18 1
Secondary School Teachers 38 19 41 2
Teaching Assistants 38 32 28 2
Learning Support Assistants 37 28 35 1
Learning Mentors 51 19 31 1
YOUTH JUSTICE 55 21 22 1
YOT (Youth Offending Team) Workers 46 26 27 1
Police 72 11 17 -
Probation Officers 44 22 32 2
Drug & Alcohol Misuse Workers 65 22 12 1 Secure Estate i.e. YOI , secure training centres 51 24 22 3
VOLUNTARY SECTOR AND RESIDENTIAL 70 18 11 1
Residential Care Staff 72 20 9 -
Social/ community/ play workers or social carer 69 17 13 2
CHILDCARE 55 28 15 2
Childcare 49 32 18 2
Childminders 83 12 3 2
had not used them. A fifth (20%) of respondents had not seen the guidelines.
Workers who were most likely to have used the guidelines include Educational Welfare Officers (87%), Children’s Social Workers (84%) and Childminders (83%). Connexions Personal Advisers (31%) and Midwives (32%) were least likely to have used the guidelines. Secondary School Teachers (41%) were most likely to have not seen any guidelines, followed by Midwives (39%).
Not surprisingly, those who were aware of Every Child Matters before the interview were more likely to have used the guidelines than those who were not aware (58% compared with 42%).
Respondents who work with children with additional needs, either specifically (58%) or sometimes (55%), were more likely to have used guidelines than those who did not work with children with additional needs (42%).
5.2
Knowledge of what to do if a child or young person was being abused
Respondents were firstly asked whether they knew what to do if a child or young person was being abused. Respondents who said they knew what to do were asked what they would do. This was an unprompted question.
Table 12 Action if a child or young person was being abused
All figures shown are percentages Base: All respondents who knew what to do if a child or young person was being abused (4,121)
CATEGORY Job type
Inform social services Follow child protection procedures Tell supervisor and make decision Discuss with other agencies
LOCAL GOVERNMENT 54 49 34 12
Youth Workers 39 52 50 9
Child & Adolescent Mental Health staff 56 51 25 13
Connexions Personal Advisers 53 56 56 11
Children’s Social Workers 24 53 32 18
Educational Welfare Officers 76 39 25 15
Educational Psychologists 52 60 21 9
Foster Carers 91 12 14 14
HEALTH PROFESSIONALS 60 47 27 11
Paediatricians 76 36 13 15
Nurses 45 44 36 6
School Nurses 60 55 25 11
Midwives 56 46 30 11
Health Visitors 71 49 24 14
SCHOOLS 18 37 43 5
Primary School Teachers 38 46 26 11
Secondary School Teachers 18 30 34 4
Teaching Assistants 9 19 60 4
Learning Support Assistants 8 30 55 5
Learning Mentors 20 51 38 5
YOUTH JUSTICE 55 43 31 17
YOT (Youth Offending Team) Workers 65 42 41 12
Police 45 28 4 24
Probation Officers 78 29 38 25
Drug & Alcohol Misuse Workers 52 55 38 15 Secure Estate i.e. YOI , secure training centres 22 66 31 5
VOLUNTARY SECTOR AND RESIDENTIAL 44 53 38 13
Residential Care Staff 33 61 33 14
Social/ community/ play workers or social carer 56 45 44 11
CHILDCARE 51 38 37 12
Childcare 47 39 42 8
Childminders 72 31 13 33
Workers in particular jobs were more likely than average to mention taking certain actions. Those who were more likely to mention informing social services include Foster Carers (91%), Probation Officers (78%), Educational Welfare Officers (76%) and Paediatricians (76%). Secure Estate workers (66%), Residential staff (61%) and Educational Psychologists (60%) were among those more likely to mention following child protection procedures. Teaching Assistants and Learning Support Assistants were most likely to say they would tell their supervisor and then make a decision (60% and 55% respectively).
Other actions mentioned included ‘inform the Police’ (10% of all respondents), ‘discuss with parents’ (9%) ‘consult child protection officer’ (7%), ‘gather information’ (7%) and ‘talk to school’ (4%)
6 Information
sharing
This chapter will cover the practice of information sharing and joint working across different organisations by looking at the typical time spent finding out whether other organisations are working with the same child. It also considers the partner organisations that are worked with and the content of partnership working.
6.1
Time spent finding out which other organisations are working with the
same case
Respondents were asked how long they typically spend per case finding out which other organisations are working with the same child or young person. Possible responses were ‘more than 5 hours’, ‘1-5 hours’, ‘up to 1 hour’, ‘varies too much to say’, and ‘not applicable to job’.
Table 13 Time spent finding out which other organisation are working with the same case
CATEGORY Job type
More than 5 hours 1-5 hours Up to 1 hour Varies
Not
applicable
to job Don’t know
LOCAL GOVERNMENT 4 22 28 39 2 4
Youth Workers 8 17 21 39 5 9
Child & Adolescent Mental Health staff 2 30 22 43 1 1
Connexions Personal Advisers 2 17 27 50 1 4
Children’s Social Workers 5 30 28 33 1 4
Educational Welfare Officers 5 27 33 33 - 1
Educational Psychologists 1 17 49 31 1 2
Foster Carers 10 26 13 41 4 6
HEALTH PROFESSIONALS 4 23 24 45 2 3
Paediatricians 1 18 42 33 3 3
Nurses 4 19 24 46 4 5
School Nurses 4 32 14 49 1 1
Midwives 6 18 27 45 2 4
Health Visitors 6 24 21 45 * 2
SCHOOLS 3 18 25 32 13 10
Primary School Teachers 4 21 22 36 4 13
Secondary School Teachers 5 8 33 31 15 8
Teaching Assistants - 15 19 29 22 15
Learning Support Assistants 2 15 24 26 21 13
Learning Mentors 5 25 26 38 5 3
YOUTH JUSTICE 5 25 26 39 2 3
YOT (Youth Offending Team) Workers 7 30 23 34 2 4
Police 1 19 22 49 3 4
Probation Officers 1 29 27 40 1 2
Drug & Alcohol Misuse Workers 5 24 33 34 1 2
Secure Estate i.e. YOI , secure training centres
10 24 25 36 - 4
VOLUNTARY SECTOR AND RESIDENTIAL
10 23 22 40 3 3
Residential Care Staff 14 24 18 39 2 5
Social/ community/ play workers or social carer
6 22 25 42 4 2
CHILDCARE 3 22 23 37 7 8
Childcare 4 24 24 37 4 8
Childminders 1 12 20 38 19 10
TOTAL 5 22 25 39 4 5
Looking at category totals, the proportions look remarkably similar, though this sometimes hides greater variations within category. Schools staff were the most likely to cite “not applicable” or “don’t know”. Of the 26 job-types the groups most likely to report spending more than one hour finding out were YOT workers (37%), School Nurses (36%) and Social Workers (35%).
6.2
Partner organisations worked most closely with as part of current job
Multi-agency working is seen as beneficial to children and young people. Every Child Matters identified three forms of multi-agency working: multi-agency panels, integrated services and multi-agency teams. More information about approaches to multi-agency working can be found on the Every Child Matters website. Respondents were read a list of possible partner organisations and stated whether they worked with this particular organisation as part of their current job. Findings for the five most frequently mentioned partner organisations (on average across all respondents) are shown in table 14, and for the less frequently mentioned organisations in table 15.
Table 14 Partner organisations worked most closely with as part of current job
CATEGORY Job type
Local
authority Schools
NHS/ PCT
Vol gp/
charity Surestart
LOCAL GOVERNMENT 89 90 62 72 59
Youth Workers 87 84 43 80 45
Child & Adolescent Mental Health staff
96 91 87 76 70
Connexions Personal Advisers 76 91 40 80 57
Children’s Social Workers 90 90 79 78 75
Educational Welfare Officers 93 98 75 73 59
Educational Psychologists 93 96 78 69 79
Foster Carers 92 82 47 29 25
HEALTH PROFESSIONALS 70 61 96 56 64
Paediatricians 60 65 96 52 52
Nurses 55 54 96 32 52
School Nurses 82 97 95 73 58
Midwives 63 17 97 45 83
Health Visitors 86 74 95 79 71
SCHOOLS 75 88 41 46 35
Primary School Teachers 91 92 49 54 49
Secondary School Teachers 64 80 28 42 15
Teaching Assistants 75 82 32 25 25
Learning Support Assistants 67 88 43 44 28
Learning Mentors 81 94 46 58 50
YOUTH JUSTICE 87 77 64 69 34
YOT (Youth Offending Team) Workers
89 88 54 71 26
Police 96 98 74 61 47
Probation Officers 88 50 57 73 35
Drug & Alcohol Misuse Workers 93 92 82 80 35
Secure Estate i.e. YOI , secure training centres
61 49 51 57 22
VOLUNTARY SECTOR AND RESIDENTIAL
90 87 60 62 46
Residential Care Staff 90 87 55 41 29
Social/ community/ play workers or social carer
89 87 64 84 64
CHILDCARE 80 68 33 41 73
Childcare 83 73 39 49 77
Childminders 63 45 - - 51
TOTAL 81 79 62 58 54
Table 15 Partner organisations worked most closely with as part of current job
CATEGORY Job type
Connexi-ons Police YOT Other None
LOCAL GOVERNMENT 74 57 67 15 *
Youth Workers 78 69 61 11 1
Child & Adolescent Mental Health staff
76 38 68 7 -
Connexions Personal Advisers 73 44 83 12 -
Children’s Social Workers 78 87 80 7 -
Educational Welfare Officers 86 89 86 5 -
Educational Psychologists 76 28 57 8 -
Foster Carers 34 43 21 80 1
HEALTH PROFESSIONALS 41 48 24 4 1
Paediatricians 28 46 15 4 -
Nurses 17 45 13 4 2
School Nurses 77 57 51 6 -
Midwives 31 38 13 4 1
Health Visitors 47 56 25 3 *
SCHOOLS 34 45 23 9 2
Primary School Teachers 13 48 11 8 2
Secondary School Teachers 52 47 23 13 5
Teaching Assistants 5 30 8 4 3
Learning Support Assistants 30 38 16 6 2
Learning Mentors 54 56 44 12 1
YOUTH JUSTICE 76 80 83 11 -
YOT (Youth Offending Team) Workers
86 89 81 10 -
Police 51 87 69 9 -
Probation Officers 75 96 85 13 -
Drug & Alcohol Misuse Workers 91 59 94 9 -
Secure Estate i.e. YOI , secure training centres
72 67 88 15 -
VOLUNTARY SECTOR AND RESIDENTIAL
69 60 57 9 *
Residential Care Staff 75 76 71 6 1
Social/ community/ play workers or social carer
63 45 42 12 -
CHILDCARE 22 17 8 6 3
Childcare 26 21 10 6 1
Childminders - - - 6 12
TOTAL 52 50 43 9 1
All figures shown are percentages Base: All respondents (4,148)
providing a wide range of services (e.g. Local Authorities) tend to be cited by most as a partner organisation (75% or more in other categories).
6.3
Ways work with partner organisations
Table 16 Ways work with partner organisations
CATEGORY Job type
Sharing info.
Consulting each other As’mnt of
young people Joint planning
LOCAL GOVERNMENT 97 97 86 90
Youth Workers 92 94 67 83
Child & Adolescent Mental Health staff 100 99 91 95
Connexions Personal Advisers 99 99 89 88
Children’s Social Workers 99 99 96 96
Educational Welfare Officers 100 98 85 93
Educational Psychologists 99 99 99 92
Foster Carers 92 92 77 90
HEALTH PROFESSIONALS 98 96 85 85
Paediatricians 98 95 95 81
Nurses 97 96 77 73
School Nurses 99 99 94 95
Midwives 97 94 71 84
Health Visitors 98 98 95 91
SCHOOLS 89 89 82 62
Primary School Teachers 96 93 89 64
Secondary School Teachers 85 85 76 60
Teaching Assistants 81 80 76 56
Learning Support Assistants 83 86 81 53
Learning Mentors 95 96 84 72
YOUTH JUSTICE 97 98 87 91
YOT (Youth Offending Team) Workers 99 98 94 94
Police 97 100 78 90
Probation Officers 100 99 86 90
Drug & Alcohol Misuse Workers 95 99 85 92
Secure Estate i.e. YOI , secure training centres 96 94 94 87
VOLUNTARY SECTOR AND RESIDENTIAL 97 97 87 90
Residential Care Staff 96 97 92 93
Social/ community/ play workers or social carer 98 97 81 88
CHILDCARE 93 90 72 49
Childcare 95 91 85 58
Childminders 80 63 - -
TOTAL 95 95 83 79
Table 17 Ways work with partner organisations
CATEGORY Job type
Deliv. joint services Sharing building, premises Advertising services
LOCAL GOVERNMENT 82 68 48
Youth Workers 88 86 69
Child & Adolescent Mental Health staff 94 67 50
Connexions Personal Advisers 93 91 73
Children’s Social Workers 90 70 39
Educational Welfare Officers 93 68 44
Educational Psychologists 82 58 33
Foster Carers - - -
HEALTH PROFESSIONALS 87 61 42
Paediatricians 81 54 22
Nurses 81 52 28
School Nurses 94 78 55
Midwives 84 56 35
Health Visitors 94 63 60
SCHOOLS 61 66 30
Primary School Teachers 69 59 22
Secondary School Teachers 47 64 27
Teaching Assistants 49 66 21
Learning Support Assistants 50 63 27
Learning Mentors 79 74 41
YOUTH JUSTICE 90 76 47
YOT (Youth Offending Team) Workers 95 89 44
Police 94 64 35
Probation Officers 83 71 34
Drug & Alcohol Misuse Workers 95 88 74
Secure Estate i.e. YOI , secure training centres 81 60 45
VOLUNTARY SECTOR AND RESIDENTIAL 89 63 47
Residential Care Staff 91 47 34
Social/ community/ play workers or social carer 87 80 60
CHILDCARE 62 55 61
Childcare 73 65 63
Childminders - - 49
TOTAL 78 65 45
7
Awareness and recognition
This chapter looks at the awareness of Every Child Matters and elements of the agenda specifically. Firstly we will look at awareness of Every Child Matters and the term to which it is known by workers in Children’s services, before looking at what respondents thought the main issues of Every Child Matters were. This chapter then covers awareness and knowledge of specific elements of Every Child Matters including the common occupational standards, the common assessment framework and the national services framework. Next, the chapter looks at whether workers felt they knew enough about Every Child Matters, what in particular they wanted more information about and their preferred method for receiving information and topics of interest.
7.1
Awareness of Every Child Matters
Table 18 Whether aware of Every Child Matters / Change for Children
CATEGORY Job type
Aware Not aware Don’t
know
LOCAL GOVERNMENT 90 10 *
Youth Workers 82 17 *
Child & Adolescent Mental Health staff 94 6 -
Connexions Personal Advisers 97 3 -
Children’s Social Workers 95 4 1
Educational Welfare Officers 100 - -
Educational Psychologists 98 1 1
Foster Carers 54 46 -
HEALTH PROFESSIONALS 80 19 1
Paediatricians 83 15 2
Nurses 64 35 2
School Nurses 94 7 -
Midwives 64 35 1
Health Visitors 96 3 1
SCHOOLS 70 29 1
Primary School Teachers 80 20 -
Secondary School Teachers 61 39 -
Teaching Assistants 54 44 2
Learning Support Assistants 58 41 2
Learning Mentors 90 10 1
YOUTH JUSTICE 79 20 1
YOT (Youth Offending Team) Workers 96 4 -
Police 65 33 2
Probation Officers 62 37 1
Drug & Alcohol Misuse Workers 98 2 -
Secure Estate i.e. YOI , secure training centres 70 28 1
VOLUNTARY SECTOR AND RESIDENTIAL 80 19 1
Residential Care Staff 70 30 -
Social/ community/ play workers or social carer 91 9 1
CHILDCARE 69 30 1
Childcare 73 26 1
Childminders 46 50 4
TOTAL 79 20 1
All figures shown are percentages Base: All respondents (4,148)
Educational Psychologists, Connexions Personal Advisers, YOT workers and Health Visitors, Social Workers, School Nurses, CAMHs, Voluntary Sector workers and Learning Mentors. Schools had relatively low awareness, particularly among Teaching Assistants (59%) and Learning Support Assistants (58%).
7.2
Whether known as Every Child Matters or Change for Children
Table 19 Whether known as Every Child Matters or Change for Children
CATEGORY Job type
Every Child Matters
Change for Children
Both
LOCAL GOVERNMENT 86 2 12
Youth Workers 89 2 8
Child & Adolescent Mental Health staff 80 3 17
Connexions Personal Advisers 95 1 4
Children’s Social Workers 86 1 13
Educational Welfare Officers 87 1 12
Educational Psychologists 80 1 20
Foster Carers 83 7 9
HEALTH PROFESSIONALS 86 6 8
Paediatricians 82 4 14
Nurses 83 9 7
School Nurses 89 2 9
Midwives 80 16 4
Health Visitors 90 2 9
SCHOOLS 95 3 3
Primary School Teachers 99 - 1
Secondary School Teachers 92 5 3
Teaching Assistants 89 9 2
Learning Support Assistants 95 3 2
Learning Mentors 95 1 4
YOUTH JUSTICE 86 3 11
YOT (Youth Offending Team) Workers 91 1 8
Police 83 3 14
Probation Officers 89 8 3
Drug & Alcohol Misuse Workers 82 3 14
Secure Estate i.e. YOI , secure training centres 81 2 17
VOLUNTARY SECTOR AND RESIDENTIAL 90 2 7
Residential Care Staff 89 4 7
Social/ community/ play workers or social carer 91 2 7
CHILDCARE 89 2 9
Childcare 89 1 9
Childminders 85 7 9
TOTAL 88 3 9
All figures shown are percentages Base: All respondents aware of Every Child Matters/ Change for Children (3,285)
7.3
Main issues covered by Every Child Matters programme
All respondents who were aware of Every Child Matters were asked what they thought were the main issues of the programme. The issues most commonly mentioned spontaneously are shown in table 20.
Table 20 Main issues covered by Every Child Matters/ Change for Children
Issue %
Protecting/ safeguarding children 28 Services sharing information and working together 28 Learning and achievement 18 Being healthy 15
Well being 10
Equal opportunities 8 Care of the child/ children’s needs 7 5 outcomes/ aims (not mentioned by any name) 6 Access to/ improving services 6 Achieving economic wellbeing 6 Positive contribution to societ