BIS RESEARCH PAPER NUMBER 45
The Returns to Higher Education
Qualifications
About London Economics
London Economics is one of Europe's leading specialist economics and policy
consultancies and has its head office in London. We also have offices in Brussels, Dublin, Cardiff and Budapest, and associated offices in Paris and Valletta.
We advise clients in both the public and private sectors on economic and financial analysis, policy development and evaluation, business strategy, and regulatory and competition policy. Our consultants are highly-qualified economists with experience in applying a wide variety of analytical techniques to assist our work, including cost-benefit analysis, multi-criteria analysis, policy simulation, scenario building, statistical analysis and mathematical modelling. We are also experienced in using a wide range of data collection techniques including literature reviews, survey questionnaires, interviews and focus
groups.
Authors: Dr Gavan Conlon and Pietro Patrignani
Head Office: 11-15 Betterton Street, London, WC2H 9BP, United Kingdom. w: www.londecon.co.uk
t: +44 (0)20 7866 8185 f: +44 (0)20 7866 8186
The views expressed in this report are that of the authors and not necessarily those of the Department for Business, Innovation and Skills or any other Government Department.
Department for Business, Innovation and Skills 1 Victoria Street
London, SW1H 0ET
www.BIS.gov.uk
Contents
Contents ... 3
Glossary... 8
Terminology abbreviations and definitions... 8
Executive Summary... 11
Key findings... 12
Exchequer benefits and rates of return ... 16
1 Introduction ... 19
2 Summary Methodology ... 20
2.1 Estimating earnings returns to higher education qualifications ... 20
2.2 Estimating the employment outcomes associated with qualification attainment ... 21
2.3 Further modelling information... 21
2.3.1 Marginal versus average returns... 21
2.3.2 Data... 22
2.3.3 Qualifications considered and counterfactual... 22
2.3.4 Coefficients... 23
2.3.5 Further disaggregation ... 24
2.4 Assessing individual rates of return and the net graduate premium ... 25
2.4.1 Estimating the net lifetime earnings benefits/gross graduate premium associated with qualification attainment ... 26
2.4.2 Estimating the individual costs associated with higher education qualification attainment ... 27
2.5 Assessing Exchequer net benefits and rates of return... 27
2.5.1 Estimating Exchequer benefits associated with higher education qualifications ... 27
3 Earnings returns ... 29
3.1 Undergraduate degrees – marginal returns ... 29
3.1.1 Single subject versus combined degrees ... 32
3.1.2 Grade of degrees ... 33
3.1.3 Age of acquisition ... 34
3.2 Postgraduate qualifications – marginal returns ... 35
3.3 Other higher education qualifications – marginal returns ... 36
3.4 Average earnings returns ... 37
4 Employment effects ... 43
4.1 Undergraduate degrees ... 43
4.1.1 Single subject versus combined degrees ... 45
4.1.2 Grade of degree ... 46
4.1.3 Age of acquisition ... 47
4.2 Postgraduate Qualifications ... 47
4.3 Other higher education qualifications ... 48
4.4 Average employment returns ... 50
5 Lifetime benefits and individual rates of return ... 55
5.1 Undergraduate degree level qualifications by subject... 55
5.1.1 Individual rates of return by degree level subject ... 58
5.2 Undergraduate degree level qualifications by grade ... 59
5.3 Postgraduate qualifications ... 62
5.4 Other higher education qualifications ... 64
6 Net Exchequer benefits and rates of return ... 66
6.1 Undergraduate degree level qualifications by subject... 66
6.2 Undergraduate degree level qualifications by grade ... 69
6.3 Postgraduate qualifications ... 71
6.4 Other higher education qualifications ... 73
Annex 1 Aggregate returns to higher education qualifications... 76
A1.1 Benefits and rates of return – additional analysis... 76
Annex 2 Detailed Methodology ... 79
A2.1 Estimating the earnings premiums associated with qualification attainment... 79
A2.2 Estimating the employment outcomes associated with qualification attainment ... 80
A2.3 Further modelling information... 80
A2.3.1 Marginal versus average returns... 80
A2.3.2 Data... 82
A2.3.3 Qualifications considered and counterfactual... 82
A2.3.4 Coefficients... 83
A2.3.5 Further disaggregation ... 84
A2.4 Combining costs and benefits to the individual and the Exchequer ... 85
A2.4.1 Net present values and rates of return ... 86
A2.5 Estimating the benefits associated with higher education qualification attainment ... 87
A2.5.1 Estimating the individual benefits of qualification attainment: net lifetime earnings benefits/gross graduate premium... 88
A2.5.2 Estimating the Exchequer’s benefit from qualification provision... 89
A2.6 Estimating the costs associated with higher education qualification attainment ... 89
A2.6.1 Direct Costs... 90
A2.6.2 Indirect Costs ... 91
A2.7 Summary of Exchequer HEFCE funding costs ... 92
A2.7.2 Undergraduate degrees by subject of study... 93
A2.7.3 Postgraduate taught (Master’s) degrees ... 95
A2.7.4 Postgraduate research (Doctorate) degrees ... 95
Annex 3 Tuition fee and student support ... 97
A3.1 A summary of 2010/11 tuition fees and student support arrangements... 97
A3.1.1 Bursaries ... 100
A3.2 RAB Charge ... 100
A3.2.1 Completion rates for assessing RAB charge... 101
A3.3 Combining different elements of student support... 101
A3.4 Direct costs to the individual and Exchequer by qualification... 104
Annex 4 Amendments to tuition fees and student support ... 105
A4.1 Tuition fee charges... 105
A4.2 Maintenance grants... 105
A4.3 Fee and maintenance loans ... 105
A4.4 Changes to loan repayment terms ... 106
A4.4.1 Scholarships... 106
A4.4.2 Changes to the RAB Charge... 106
A4.5 Aggregate impact of system amendments ... 107
Annex 5 Changes to HEFCE teaching funding and overall implications for individual and Exchequer direct costs ... 109
Annex 6 History of the graduate premium... 111
A6.1.1 Standard theory... 111
A6.1.2 Gross versus net earnings ... 112
A6.1.3 The gross versus net graduate premium and rates of return ... 112
A6.1.5 Refined calculations (2002-03)... 113
A6.1.6 Royal Society of Chemistry (2005) and Universities UK (2007) ... 114
A6.1.7 Other estimates ... 115
Glossary
Terminology abbreviations and definitions
The present value is defined as the discounted value of a stream of payments made or received in the future, taking into consideration a specific interest or discount rate (see below). The present value represents a series of future cash flows expressed in today's money terms.
Present Value (PV)
The net present value is defined as the present value of the benefits minus the present value of the costs associated with particular activity.
Net Present Value (NPV)
The internal rate of return is defined as the discount rate (or rate of interest) such that the present value of a future stream of benefits equals the present value of a future stream of costs.
Internal Rate of Return (IRR)
Higher Education Funding Council for England HEFCE
The size of the Exchequer maintenance and fee loan subsidy is measured by the Resource Accounting and Budgeting charge (RAB), which calculates the proportion of the nominal loan value that would not be expected to be repaid (in present value terms). Under the current student support regime, non-repayment occurs as a result of the zero real rate of interest subsidy and debt forgiveness after 25 years or in the case of permanent disability or death. Based on graduate earnings profiles (from the Labour Force Surveys) and the administrative information relating to the criteria for repayment of loans, we estimate the RAB Charge to be approximately 26.5%, which implies that for every £1,000 in loans that are provided by the government, approximately £735 would be expected to be repaid (in present value terms) with the remaining £265 being ‘lost’ to the Exchequer as a result of write-offs and interest rate subsidies.
Resource and Accounting Budget charge (RAB charge)
The gross lifetime benefit associated with degree level qualification attainment represents the present value of the pre-tax earnings benefits associated with an undergraduate degree relative to an individual in possession of 2 or more GCE ‘A’ Levels. An equivalent figure can also be calculated for other qualifications.
The gross graduate premium represents the present value of the after tax (and National Insurance/VAT) earnings benefits associated with an undergraduate degree relative to an individual in possession of 2 or more GCE ‘A’ Levels. An equivalent figure can also be calculated for other
qualifications. Gross graduate premium/
net lifetime benefit
The net graduate premium represents the present value of the benefits associated with an undergraduate degree relative to an individual in possession of 2 or more GCE ‘A’ Levels (gross graduate premium) minus the present value of the costs associated with acquiring a degree. These costs include the direct costs (such as tuition fees minus student support) and indirect costs (such as foregone earnings). An equivalent figure can also be calculated for other
qualifications. Net graduate premium
Marginal earnings estimates provide an indication of the returns associated with different qualifications when these qualifications are the highest qualification the individual is in possession of.
Marginal return
The average return associated with higher education qualifications assesses the return associated with the qualification for anyone in possession of that qualification (irrespective of whether it is their highest qualification or otherwise).
Average Return
The gross Exchequer benefit represents the present value of the benefits to the Exchequer associated with the
provision of an undergraduate degree relative to an individual in possession of 2 or more GCE ‘A’ Levels. The present value of the Exchequer benefits associated with a degree corresponds to the enhanced tax, National
Insurance and VAT paid by an individual over their lifetime relative to possession of 2 or more GCE ‘A’ Levels. An equivalent figure can also be calculated for other qualifications.
The net Exchequer benefit represents the present value of the Exchequer benefits associated with the provision of an undergraduate degree relative to an individual in possession of 2 or more GCE ‘A’ Levels (gross Exchequer benefit) minus the present value of the Exchequer costs associated with funding a degree. These costs include the direct costs (such as HEFCE funding and student support) and indirect costs (foregone taxation receipts during qualification
attainment). An equivalent figure can also be calculated for other qualifications.
Net Exchequer benefit
The discount rate measures the time value of money. According to the HM Treasury Green Book, due to the fact that individuals prefer to receive goods in the present rather than in the future, an adjustment for time preferences needs to be incorporated into any analysis where flows of
resources are occurring at different points in time. According to HM Treasury, “the discount rate is used to convert all costs and benefits to ‘present values’, so that they can be compared. To reflect time preferences, the recommended discount rate is 3.5% (in real terms). Calculating the present value of the differences between the streams of costs and benefits provides the net present value (NPV) of an option. The NPV is one of the primary criterion for deciding whether government action can be justified”
Discount rate
Executive Summary
London Economics were commissioned by the Department for Business, Innovation and Skills to undertake a comprehensive analysis of the economic benefits associated with higher education qualifications. Following a recent piece of analysis assessing the returns to intermediate and low level vocational qualifications1, this research makes use of
detailed individual level data from the Labour Force Surveys between 1996 and 2009 to establish the impact of higher education qualifications on earnings and employment outcomes (for men and women separately). In addition to the assessment of these earnings and employment effects at an aggregate level, the analysis also considers the returns associated with undergraduate degrees by grade of degree, subject of study and single subject versus combined degrees. The analysis also considers the returns
associated with postgraduate degree level qualifications and other sub-degree level qualifications.
In addition to looking at the benefits associated with qualification attainment, the analysis also considers the costs incurred by the individual associated with undertaking these qualifications (such as tuition fees minus student support and foregone earnings) and compares these costs against the enhanced earnings and employment benefits resulting from qualification attainment. We also assessed the costs and benefits to the Exchequer associated with the provision of undergraduate degrees. These Exchequer costs include HEFCE teaching funding, student support and foregone taxation revenue during the period of qualification attainment, while the benefits include the enhanced income tax, National Insurance and VAT receipts following graduation. In comparing the various costs and benefits associated with qualification attainment, as well as the timing of the costs and benefits, we estimate both the net graduate premium and individual rate of return
associated with qualification attainment, as well as the net Exchequer benefit and rate of return associated with higher education level qualification provision.
There are a number of other benefits associated with higher education qualification attainment; such as improved health outcomes and the reduced likelihood of requiring public sector assistance in relation to healthcare or the negative relationship between qualification attainment and criminal activity. There is also some economic literature on the existence of education-related spillovers, whereby the labour market outcomes of those with lower levels of qualification attainment is augmented by the presence of a greater proportion of more highly qualified workers. In this report, we only estimate the financial benefits associated with higher education qualification attainment and do not assess these other effects that might be associated with higher education qualification attainment.
1 ‘The economic returns to intermediate and low level vocational qualifications’, a report for the Department
Key findings
Undergraduate degrees - earnings
The marginal earnings return associated with an undergraduate degree stands at approximately 27.4% overall compared to possession of 2 or more GCE ‘A’ Levels. Women post a marginally higher return compared to men (29.7% and 23.5%
respectively).
There is significant variation in the returns to undergraduate degrees by subject (compared with the possession of 2 or more A-levels in any subject). The highest marginal returns are associated with medicine and dentistry degrees, where men post a marginal earnings return of 70.1% compared to 91.7% for women.
There are a number of other degree level subjects offering very significant returns to holders. For men, undergraduate degrees in mathematical and computer sciences and law provide a return of 36.9% and 38.8% respectively; while
engineering, architecture, business and administrative studies, social studies, and subjects allied to medicine also offer above average returns.
Undergraduate degrees in linguistics and European languages offer relatively low earnings returns to men (6.2% and 11.5% respectively).
The returns to undergraduate degrees for women are in almost all circumstances higher than the earnings returns achieved by men. The ranking of the earnings premiums appear to be broadly similar to men, with undergraduate degrees in mathematical and computer sciences, veterinary science, education, law, subjects allied to medicine and engineering offering above average returns.
The lowest marginal returns for women are associated with degrees in mass
communication and documentation, while creative arts, historical and philosophical studies, linguistics and non-European languages all offer below average returns to their holders.
There is a small premium when undergraduate degrees are obtained in a single subject area compared to combined degrees in one subject area. Combined undergraduate degrees in a single subject area command a premium over combined degrees covering more than one subject area (approximately 2 percentage points on average in each case).
In aggregate, the earnings premium associated with undergraduate degrees
Undergraduate degrees - employment
For men and women combined, compared to possession of 2 or more GCE ‘A’ Levels, an undergraduate degree increases the probability of being employed by approximately 3.3 percentage points. Women achieve a boost of 4.2 percentage points in their employment outcomes, while men achieve a 2.1 percentage point boost.
For women, the most influential degree level subjects on employment outcomes are medicine and dentistry (10 percentage points), subjects allied to medicine (9.7 percentage points), veterinary science (9.1 percentage points) and education (8.5 percentage points). There are a number of degree level subjects offering relatively low employment returns including social studies (4.0 percentage points), biological sciences (2.1 percentage points), as well as European languages, non-European languages and historical and philosophical studies (no statistically significant effects).
The average employment boost for men stands at 2.1 percentage points; however, men in possession of architecture, medicine and dentistry, subjects allied to
medicine, or veterinary science degrees all see an increase in the probability of being employed of more than 4 percentage points. Degrees in linguistics,
languages and historical and philosophical studies offer relatively low employment returns to men.
Individuals in possession of single subject degrees are approximately 3.4 percentage points more likely to be in employment compared to those in
possession of 2 or more GCE ‘A’ Levels. This compares to 2.5 percentage points for those in possession of combined degrees in a single subject area and 1.1 percentage points for those in possession of combined degrees in more than one subject area.
Although positive, there is an uneven relationship between the grade of degree honours and the enhanced probability of being employed. Compared to an
individual in possession of 2 or more GCE ‘A’ Levels, individuals in possession of lower or upper second class honours degrees are 3.2 or 4.4 percentage points more likely to be employed respectively, while a first class honours degree offers an employment boost of approximately 2.8 percentage points.
Postgraduate degrees
The analysis indicates that there are substantial earnings returns to Master’s degrees, with men and women posting an 8.9% and 10.3% premium respectively compared to possession of an undergraduate degree. The premium achieved by those in possession of Doctorate degrees is substantial and stands at
As with undergraduate degrees, the employment return to women from possession of any form of postgraduate degree exceeds the returns posted by men. Women in possession of a Master’s qualification are approximately 2.5 percentage points more likely to be employed compared to women in possession of undergraduate degrees (compared to 1.2 percentage points for men), while women in possession of Doctorate qualifications are 4.5 percentage points more likely to be employed (compared to 2.7 percentage points for men).
Other higher education qualifications
In aggregate, the analysis indicates that there is only a small difference in the marginal earnings returns associated with Foundation degrees, higher education Diplomas or ‘other’ forms of higher education qualification. The returns to these qualifications stand at 13.8%, 17.1% and 7.1% (respectively) compared to 2 or more GCE ‘A’ Levels.
Men in possession of these other forms of higher education qualification achieve much lower earnings premiums compared to women. For example, for women, the mean return associated with these three sub-degree higher education qualifications lag the earnings premium associated with undergraduate degree level qualifications by 12 percentage points, which is approximately one-third less than the gap
estimated for men (18 percentage points).
Overall, there is a positive marginal employment return associated with all higher education qualifications below undergraduate level, with the employment boost standing at 2.5 percentage points for higher education Diplomas and at around one percentage point for Foundation degrees and ‘other’ higher education qualifications (but not statistically significant).
There are some significant variations depending on gender, especially for Foundation degrees. Men in possession of Foundation degrees suffer a 3.6 percentage point employment penalty compared to possession of 2 or more GCE ‘A’ Levels. Women post a 4.4 percentage point increase in the probability of being employed compared to possession of 2 or more GCE ‘A’ Levels (although neither of these figures is statistically significant).
Graduate premiums and rates of return
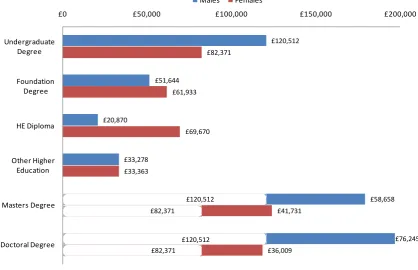
Although not explicitly modelled, the mean gross graduate premium (i.e. net of tax and National Insurance but before the costs associated with qualification
attainment) stands at approximately £125,000 in present value terms.
The mean net graduate premium (i.e. net of costs) associated with an
undergraduate degree across the entire sample was estimated to be approximately £108,000 (with a corresponding rate of return of 14.9%). There was some variation by gender, with men achieving a mean net graduate premium of approximately £121,000, while the mean net graduate premium for women stands at
At undergraduate level, medicine and dentistry provide men with a net graduate premium of more than £403,000 (rate of return equivalent to 19.0%). The other undergraduate degree level subjects that offer significantly higher than average net graduate premiums to men include law (£215,000 – 19.2%), architecture (£170,000 – 19.7%), veterinary sciences (£165,000 - 15.7%), engineering (£157,000 – 17.9%) and mathematical and computer sciences (£152,000 – 20.9%).
The other degree level subjects offering strong net graduate premiums and rates of return for women include subjects allied to medicine (£153,000 – 21.3%), education (£142,000 – 21.9%) and veterinary sciences (£128,000 – 17.4%).
There are increasing returns associated with the grade of degree honours and the relationship is more pronounced for men compared to women. The net graduate premium achieved by men in possession of a first class honours degree stands at approximately £144,000 compared to approximately £80,000 for those in
possession of a lower second class honours. The equivalent estimates for women are approximately £79,000 and £70,000 respectively. From a lower second class honours degree, achieving an upper second class honours degree adds £48,000 to the net graduate premium for men (£18,000 for women), while the move to a first class degree increases the male net graduate premium by another £16,000 (compared to an £8,000 reduction in the net graduate premium for women).
The mean net post-graduate premiums for men associated with possession of Doctorate and Master’s degrees (relative to possession of an undergraduate degree) stand at approximately £76,000 and £59,000 respectively, while the
equivalent net post-graduate premiums estimated for women stand at £36,000 and £42,000 respectively. The rates of return associated with Doctorate and Master’s qualification stand at 8.7% and 14.9% for men respectively and 6.8% and 11.3% for women respectively.
Women in possession of Foundation degrees and HE Diplomas post relatively strong net benefits compared to possession of 2 or more GCE ‘A’ Levels as a highest qualification, which reflects the strong earnings and employment outcomes associated with these qualifications. Given the relatively short duration associated with a number of these qualifications, they also appear to offer women sizeable rates of return.
Specifically, a Foundation degree provides a net benefit (i.e. net of costs and equivalent to the net graduate premium) of approximately £62,000 for women (14.3% rate of return), which compares to a net benefit of approximately £70,000 (15.0%) for higher education Diplomas and £33,000 (27.6%) for ‘other’ higher education qualifications.
Figure 1 - Lifetime benefits associated with higher education qualification attainment
£36,009 £41,731
£76,245 £58,658
£82,371 £82,371 £33,363
£69,670 £61,933
£82,371
£120,512 £120,512 £33,278
£20,870
£51,644
£120,512
£0 £50,000 £100,000 £150,000 £200,000
Doctoral Degree Masters Degree Other Higher
Education HE Diploma Foundation
Degree Undergraduate
Degree
Males Females
Note: All monetary values expressed in present value terms (discount rate =3.5%)
Source: London Economics' analysis of the Labour Force Survey, HEFCE and HESA data
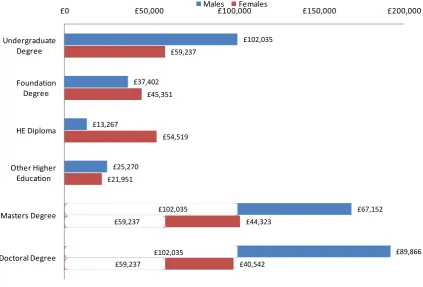
Exchequer benefits and rates of return
The mean gross Exchequer benefit (i.e. enhanced income tax and National Insurance receipts before the costs of provision) associated with undergraduate degree level provision stands at approximately £110,000 in present value terms.
The net Exchequer benefit (i.e. net of costs) associated with undergraduate degree level provision stands at £89,000 overall, with a net Exchequer benefit of £102,000 for men and £59,000 for women. The associated rate of return achieved by the Exchequer resulting from the funding of these qualifications stands at 10.8% overall (11.4% for men and 9.6% for women).
Within undergraduate degrees for men, the subjects that provide the Exchequer with the most significant net benefits include medicine and dentistry (£399,000 – 13.5%), law (£205,000 – 16.8%), architecture (£146,000 – 14.3%), mathematical and computer sciences (£137,000 – 16.0%), and business and administrative studies (£120,000 – 14.8%), while degrees in social studies (£115,000 – 13.7%) and subjects allied to medicine (£116,000 – 12.6%) offer returns that are marginally above average.
to medicine (£114,000 – 12.8%), education (£111,000 – 14.4%), mathematical and computer sciences (£99,000 – 14.3%) and law (£91,000 – 14.8%), which all provide a return of between 50% and 100% more than the average Exchequer benefit.
There are low Exchequer returns associated with a number of degree level subject areas. Degrees undertaken by women in mass communication and documentation, European languages, non-European languages, historical and philosophical
studies, and creative arts and design all provide an Exchequer benefit of between £15,000 and £45,000 (with associated Exchequer rates of return of less than 10%).
For men, there are net costs to the Exchequer associated with the provision of degrees in mass communication and documentation, history and philosophical studies and creative arts and design, while male acquisition of degrees in linguistics and languages provide the Exchequer with a net benefit that is approximately one-quarter to one-half of that posted by the average male graduate.
Given the relatively short duration of Master’s qualifications (12 months) and the limited funding through HEFCE, these qualifications offer very high returns to the Exchequer. The net Exchequer benefit stands at approximately £67,000 for men and £44,000 for women, translating into rates of return of almost 32% for men and 22.5% for women.
The net Exchequer benefit associated with Doctorate qualifications stands at £90,000 for men and £41,000 for women, equivalent to a rate of return of 10.7% and 8.4% respectively.
Figure 2 - Exchequer benefits associated with higher education qualification attainment
£40,542 £44,323
£89,866 £67,152
£59,237 £59,237 £21,951
£54,519 £45,351
£59,237
£102,035 £102,035 £25,270
£13,267
£37,402
£102,035
£0 £50,000 £100,000 £150,000 £200,000
Doctoral Degree Masters Degree Other Higher Education HE Diploma Foundation
Degree Undergraduate
Degree
Males Females
Note: All monetary values expressed in present value terms (discount rate =3.5%)
Source: London Economics' analysis of the Labour Force Survey, HEFCE and HESA data
Women generate a relatively healthy return from sub-degree qualification provision for the Exchequer. Although the net Exchequer benefit associated with these sub-degree qualifications are lower than undergraduate sub-degrees, the fact that the
qualifications are relatively short implies that the rate of return to the Exchequer is in line with the returns generated from undergraduate degree level provision.
Possession of a Foundation degree provides the Exchequer with a net benefit of approximately £45,000 (rate of return of 9.6%); while a higher education Diploma and ‘other’ higher education qualifications contribute approximately £55,000 (10.8%) and £22,000 (12.6%) to the Exchequer respectively.
1 Introduction
London Economics were commissioned by the Department for Business, Innovation and Skills to undertake an assessment of the economic returns to higher education
qualifications. There have been a large number of studies in the area that have focused on a range of different aspects of higher education qualifications, including the determinants of undertaking higher education qualifications, the earnings and employment outcomes associated with higher education qualifications (both at an aggregated or disaggregated level), and the rates of return associated with different types and levels of higher education qualification attainment. To undertake this research and achieve a robust analysis,
significant volumes of data and alternative model specifications have been considered. This is a significant improvement on previous analyses.
In this report, we assess the economic outcomes associated with higher education qualification attainment in the United Kingdom and the report is set out below. Following a number of other authors in the field and the analysis undertaken for the Department for Business, Innovation and Skills relating to the returns to intermediate and low level vocational qualifications2, our methodology adopts a number of standard
economic and econometric approaches to assess the economic benefits associated with higher education qualification attainment, which we describe in our summary methodology (section 2).
In section 3, we present detailed findings of the marginal earnings returns associated with different levels and types of higher education qualification attainment, where the marginal earnings estimates provide an indication of the returns associated with different
qualifications when these qualifications are the highest qualification the individual holds. This analysis is presented at both an aggregate level and disaggregated by type of higher education qualification, gender and, for undergraduate degrees, by subject of study, grade degree and whether the degree is a single subject degree or combined subject degree (in one or more subject areas). For completeness, we also provide estimates of the average return associated with higher education qualifications. This approach measures the return associated with the qualification for anyone in possession of that qualification (irrespective of whether it is their highest qualification or otherwise).
In section 4, we replicate the analysis undertaken in section 3 and estimate the
employment effects associated with higher education qualification attainment. Combining information on the costs and benefits associated with higher education qualification
attainment, we provide an assessment of the net graduate premium and individual rates of return associated with higher education qualification attainment in Section 5, while in Section 6, we assess the net Exchequer benefits and rates of return associated with qualification provision.
2 ‘Returns to intermediate and low level vocational qualifications’, a report undertaken for the Department for
2 Summary Methodology
2.1 Estimating earnings returns to higher education qualifications
To undertake this element of the analysis, we estimated a standard Ordinary Least
Squares linear regression model, where the dependent variable is the natural logarithm of hourly earnings and the independent variables include the full range of qualifications held alongside a range of personal, regional and job related characteristics that might be expected to influence earnings. We included individuals who were employed on either a full time or a part time basis. This approach has been used widely in the academic
literature. The basic specification of model was as follows (in aggregate and for men and women separately):
i i
i X
) '
ln( for i = 1 to n
where ln(i ) represents the natural logarithm of hourly earnings, provides the independent variables included in the analysis as follows:
i
X
Gender
Age
Age squared
Ethnic origin
Region of usual residence
Qualifications
Marital Status
Number of dependent children under the age of 16
Full time/ Part time employment
Temporary or permanent contract
Public or private sector employment
Workplace size
Interaction terms, and
2.2 Estimating the employment outcomes associated with
qualification attainment
We adopted a probit model to estimate the likelihood of different qualification holders being in employment or otherwise. The basic specification defines an individual’s labour market outcome to be either in employment (working for payment or profit for more than 1 hour in the reference week (using the standard ILO definition) or not in employment (being either unemployed or economically inactive)).
The specification of the probit model was as follows (for men and women separately):
i i
i Z
EMPNOT
probit( ) '
The dependent variable adopted has the binary variable EMPNOT that is coded 1 if the individual is in employment and 0 otherwise.
We specified the model to contain a constant term as well as a number of standard independent variables including the qualifications held by an individual (represented by Zi
in the above equation) as follows:
Gender
Age
Age squared
Ethnic origin
Region of usual residence
Qualifications
Marital Status
Number of dependent children under the age of 16, and
Yearly Dummies
2.3 Further modelling information
2.3.1 Marginal versus average returns
highest qualification or otherwise). The analysis of average returns considers both annual and pooled effects and is discussed in greater detail in Annex 2.
2.3.2 Data
To estimate the impact of higher education qualifications on labour market outcomes, we used information from the Labour Force Surveys between 1996 and 2009. The selection of information over this period is the longest time for which information on education and earnings is available on a relatively consistent basis and thus provides the most robust analysis possible using the Labour Force Survey, as well as allowing significant analysis to be undertaken at a disaggregated level.
It is important to note that in some years particular variables are not available. Therefore, particular analyses (and Tables/Figures based on that analysis) may cover slightly
different time periods, and these are detailed on a case by case basis. The analysis covers higher education qualification attainment across the United Kingdom and all information over the fourteen year period has been adjusted to reflect inflation and is presented in constant prices.
2.3.3 Qualifications considered and counterfactual
In total, six different higher education qualifications were considered within the National Qualifications Framework: two at postgraduate level (Doctorate and Master’s degrees) and four at undergraduate level or sub-degree level (undergraduate degrees, Foundation degrees, higher education Diplomas3 and ‘other’ higher education qualifications4). Table 1 presents the different postgraduate and undergraduate level qualifications considered in the analysis, along with the counterfactual group used for the marginal returns analysis in each case. We compare the earnings of the group of individuals in possession of the qualification to a counterfactual group to ensure that we assess the economic benefit associated with the qualification itself rather than the economic returns generated by the person in possession of the qualification. This is a standard approach in the literature and allows us to ‘strip away’ the other personal, regional or socioeconomic characteristics that influence both the determinants of qualification attainment as well as earnings.
For the analysis of marginal returns, postgraduate degree holders are compared to
undergraduate degree holders, while for individuals holding undergraduate or sub-degree level higher education qualifications, the counterfactual group consists of individuals holding 2 or more GCE ‘A’ Levels as their highest qualification. For the purposes of this
3 Labour Force Survey variable QUALS6 value label 2 (Diploma in higher education). Diplomas in higher
education are similar to HNDs though more academic in orientation as they generally relate to accredited professional qualifications. HE Diplomas usually take two years to complete and it is normally possible to convert a higher education diploma to a degree with an extra year of study.
4 Labour Force Survey variable QUALS6 value label 9 ('Other higher education qualification below degree
analysis, the highest level of professional or vocational qualification that an individual may be in possession of is level 3 (for both those in possession of higher education
qualifications (the treatment group) and those individuals not-in-possession of higher education qualifications (the control group))5.
Table 1 - Treatment and comparison groups – marginal returns
Treatment – highest
academic qualification academic qualification Comparison - highest Treatment and comparison groups – highest possible vocational/professional
qualification
Doctorate Undergraduate degree Level 3 vocational
Master’s degree Undergraduate degree Level 3 vocational Undergraduate degree 2 or more GCE ‘A’ Levels Level 3 vocational Foundation degree 2 or more GCE ‘A’ Levels Level 3 vocational
HE Diploma 2 or more GCE ‘A’ Levels Level 3 vocational
Other higher education 2 or more GCE ‘A’ Levels Level 3 vocational Source: London Economics
2.3.4 Coefficients
The coefficients in the model provide information on the extent to which a particular independent variable (e.g. qualification attainment) influences the dependent variable (earnings or employment outcomes).
In the earnings regressions, the coefficients relating to the higher education qualifications indicate the additional effect on (the log of) hourly earnings associated with holding the extra qualification in excess of those in the reference category (e.g. holding an
undergraduate degree level qualification compared to those in possession of 2 or more GCE ‘A’ Levels). For instance, the coefficient assessing the earnings premium to an undergraduate degree level qualification relative to 2 or more GCE ‘A’ Levels should be interpreted as the return achieved by an individual in possession of both an undergraduate degree and 2 or more GCE ‘A’ Levels compared to possession of 2 or more GCE ‘A’ Levels alone. In the employment regressions, the relevant coefficient provides a similar estimate of the impact of the qualification on the probability of being in employment. The final term represents the error term component.
iFor the earnings returns, the actual coefficients from the regression are presented in the various tables in the report, while the precise percentage effect of the independent variable on the earnings outcomes is presented in the text (by transforming the coefficient using the transformation eβ -1). In general terms, for small coefficients (less than 0.10), the
coefficient in the regression model will give a reasonable approximation of the actual
percentage change; however, for coefficients greater than this, the correction is necessary. This transformation is required only when considering earning returns as we are estimating the impact of qualification attainment on the logarithm of hourly earnings. No exponential
5 Note that when considering the average returns associated with different types of higher education
transformation is necessary when considering the employment outcomes of learners, as in the employment regressions, the relevant coefficient provides an automatic estimate of the impact of the qualification on the probability of being in employment.
2.3.5 Further disaggregation
For undergraduate degrees, further disaggregation was possible and we replicated the analysis detailed above by class of undergraduate degree (First, Upper Second and Lower Second), subject of study and whether the degree was obtained in a single subject area or as a combined degree (in either one subject area (for instance mathematics and statistics) or more than one subject area (for instance mathematics and economics)).
We coded those in possession of single degree subjects according to 1 or 2 digit JACS code below:
medicine and dentistry
subject allied to medicine
biological sciences
veterinary sciences
agriculture
physical/environmental Sciences
mathematical and computer sciences
engineering
technologies
architecture, building and planning
social studies
law
business and administrative studies
mass communication and documentation
linguistics, classics and related subjects
European languages and literature
historical and philosophical studies
creative arts and design
education
2.4 Assessing individual rates of return and the net graduate premium
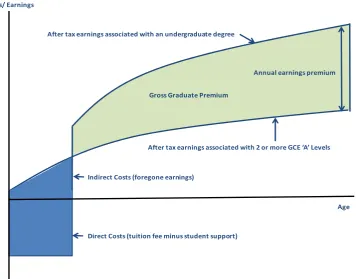
To consider the rate of return and the net graduate premium associated with a particular level or type of qualification (see glossary and Annex 2 for more details on these), it is necessary to estimate the direct and indirect costs associated with acquiring the qualification (tuition fees minus student support and foregone earnings), as well as the benefits of the qualification (the gross graduate premium or equivalent). These costs and benefits will occur at different points in the individual’s lifetime (as shown in Figure 3) and so it is necessary to use the concepts of the net present value and internal rate of return (see glossary) to compare them.
The net graduate premium (or equivalent for sub-degree qualifications) is calculated by subtracting the present value of the costs of qualification attainment from the gross graduate premium (or equivalent). The rate of return is obtained by calculating the
[image:25.595.130.487.458.737.2]discount rate required for the gross graduate premium to be equal to the present value of the costs of qualification attainment (see Annex 2 for more details).
Figure 3 - Representation of costs and benefits associated with qualification attainment
Gross Graduate Premium
After tax earnings associated with 2 or more GCE ‘A’ Levels
Age
Direct Costs (tuition fee minus student support) Indirect Costs (foregone earnings)
After tax earnings associated with an undergraduate degree
Annual earnings premium Costs/ Earnings
2.4.1 Estimating the net lifetime earnings benefits/gross graduate premium associated with qualification attainment
The net lifetime benefits associated with qualification attainment are taken to be the present value of the enhanced post-tax (Income, National Insurance and VAT) earnings relative to an individual in possession of the counterfactual qualification. This is also known as the gross graduate premium in the case of undergraduate degrees.
To estimate the value of net lifetime benefits or gross graduate premium, we extended the econometric analysis presented in section 2.1 and 2.2. Using pooled Quarterly Labour Force Surveys (between 1996 to 2009), we undertook the following elements of analysis:
1. We estimated the earnings premium associated with different higher education qualifications in 5 year age bands across the working age population (see section 2.1).
2. We estimated the probability of employment associated with higher education qualifications in 5 year age bands across the working age population (see section 2.2).
3. We estimated the employment adjusted annual earnings achieved by individuals in the counterfactual group (either 2 or more GCE ‘A’ Levels or an
undergraduate degree (Table 1)).
4. We inflated these baseline or counterfactual earnings using the earnings premiums from (1) and the employment probabilities from (2) to produce age-earnings profiles associated with the possession of the particular qualification. 5. We adjusted earnings to account for the fact that earnings would be expected to
increase in real terms over time (assumed to be 2% per annum generally). 6. Based on the earnings profiles generated by qualification holders, and current
income tax and National Insurance rates and allowances, we computed the future stream of net (i.e. post tax) earnings.
7. We calculated the discounted stream of additional (employment-adjusted) future earnings compared to the relevant counterfactual group (using a standard
discount rate of 3.5% as presented in HM Treasury Green Book to generate a present value figure i.e. the gross graduate premium (or equivalent for other qualifications)).
This was undertaken for men and women separately and replicated by subject of study. We coded those in possession of single degree subjects according to 1 or 2 digit JACS code described in section 2.3.5, as well as those students undertaking combined degree subjects predominantly in one subject area or in more than one subject area.
lifetime benefit or gross graduate premium), as well as the enhanced taxation revenue/National Insurance/VAT generated by these graduates over their lifetime
assuming the current income tax regime remains in place. If all of the steps except for step 6 above are followed, an estimate of the gross enhanced earnings achieved by graduates over their lifetime is generated instead (the gross lifetime benefit).
Full details are presented in Annex 2.
2.4.2 Estimating the individual costs associated with higher education qualification attainment
The direct costs associated with qualification attainment include any tuition fees minus any student support the individual may be eligible for (i.e. grants and subsidies on fee and maintenance loans6). The assessed indirect costs to the individual include the foregone earnings during the period of qualification attainment. We did not consider any other indirect costs associated with qualification attainment. Subtracting the present value of these costs of attainment from the gross graduate premium provides an estimate of the net graduate premium.
This element of the analysis is exceptionally detailed and full details are presented in Annex 2 and Annex 3.
2.5 Assessing Exchequer net benefits and rates of return
A similar comparison between the costs and benefits of qualification provision to the Exchequer can be carried out to obtain the Exchequer rate of return and Exchequer net benefit. Again these costs and benefits will occur at different points in time and will need to be compared using the concepts of the net present value and rate of return. A full
explanation of the derivation of these Exchequer costs and benefits are presented in Annex 2 and Annex 3.
2.5.1 Estimating Exchequer benefits associated with higher education qualifications
The economic benefits accrued by the Exchequer include the enhanced income taxation and National Insurance contributions made by graduates, as well as the additional VAT receipts generated through increased consumption (in absolute terms) associated with higher earnings. Based on the expected earnings profiles generated by those in
possession of higher education qualifications, the estimates of enhanced taxation receipts are calculated in the same way as the graduate premium described in previous sections.
6 By considering the actual earnings of graduates post graduation and the characteristics of the current
2.5.2 Estimating Exchequer costs associated with higher education qualification provision
The assessed costs to the Exchequer include the HEFCE teaching funding (depending on subject banding), student maintenance grants, the subsidy associated with maintenance and fee loans (accruing from the interest rate subsidies on the loans and write off criteria), and foregone income-tax, National Insurance and VAT receipts during the period of
qualification attainment.
3 Earnings returns
3.1 Undergraduate degrees – marginal returns
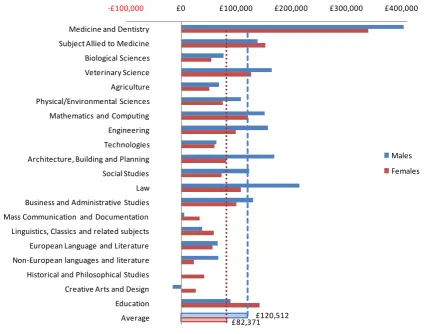
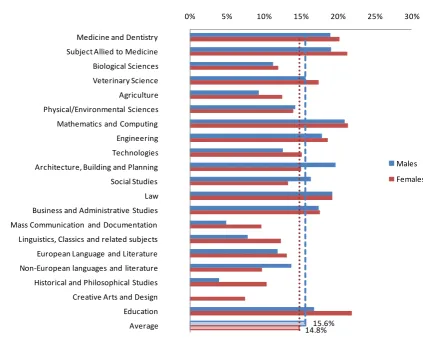
[image:29.595.75.518.374.770.2]The marginal earnings return associated with an undergraduate degree stands at approximately 27.4% (β=0.242) overall compared to possession of 2 or more GCE ‘A’ Levels. Women post a higher return compared to men, standing at 29.7% and 23.5% respectively (β=0.260 and β=0.211). This information is presented in Table 2 and Figure 4. Clearly, there is significant variation in the returns to undergraduate degrees depending on a number of factors (such as subject studied and degree class). In Table 2, we illustrate the earnings returns depending on undergraduate subject of study. The highest marginal returns are (unsurprisingly) associated with medicine and dentistry degrees, where men post a marginal earnings return of 70.1% (β=0.531) compared to a marginal return of 91.7% for women (β=0.651).
Table 2 - Earnings returns by subject of undergraduate degree – all, males and females
All Males Females
Comparison 2 or more A‐levels and vocational level 3 or below
Medicine and dentistry 0.603*** (0.026) 0.531*** (0.035) 0.651*** (0.037)
Subject allied to medicine 0.322*** (0.012) 0.232*** (0.030) 0.345*** (0.013)
Biological sciences 0.160*** (0.011) 0.117*** (0.018) 0.185*** (0.014)
Veterinary sciences 0.334*** (0.045) 0.280*** (0.074) 0.372*** (0.059)
Agriculture 0.141*** (0.030) 0.106*** (0.039) 0.153*** (0.045)
Physical/environmental sciences 0.239*** (0.011) 0.200*** (0.013) 0.263*** (0.020)
Mathematical and computer
sciences 0.344*** (0.011) 0.314*** (0.013) 0.394*** (0.022)
Engineering 0.323*** (0.010) 0.278*** (0.011) 0.338*** (0.038)
Technologies 0.188*** (0.027) 0.142*** (0.031) 0.239*** (0.052)
Architecture, building and planning 0.272*** (0.015) 0.245*** (0.017) 0.278*** (0.032)
Social studies 0.231*** (0.010) 0.226*** (0.015) 0.225*** (0.013)
All Males Females
Business and administrative studies 0.282*** (0.009) 0.253*** (0.013) 0.301*** (0.013)
Mass comm. and documentation 0.081*** (0.018) 0.044 (0.028) 0.107*** (0.023)
Linguistics, classics and rel.
subjects 0.162*** (0.015) 0.061** (0.026) 0.219*** (0.018)
European languages and literature 0.189*** (0.023) 0.109*** (0.038) 0.237*** (0.027)
Non-European languages and
literature 0.144** (0.057) 0.180** (0.074) 0.153** (0.075)
Historical and philosophical studies 0.099*** (0.013) 0.023 (0.018) 0.176*** (0.019)
Creative arts and design 0.061*** (0.012) ‐0.012 (0.018) 0.111*** (0.016)
Education 0.315*** (0.011) 0.180*** (0.022) 0.368***(0.013)
0.242*** (0.004) 0.211*** (0.006) 0.260*** (0.006) Average
Note: Information on subject of degree in unavailable in the 1996 Labour Force Survey. Therefore, estimated earnings returns to single subject undergraduate degree qualifications by subject use pooled Labour Force Survey data between 1997 and 2009. Robust standard errors in parentheses. * 10% level of statistical significance; ** 5% level of statistical significance; *** 1% level of statistical significance.
Source: London Economics
There are a number of other subjects offering very significant returns to holders. For men, undergraduate degrees in mathematical and computer sciences and law provide a
marginal return of 36.9% and 38.8% respectively (β=0.314 and β=0.328), while the next group of subjects offering above average returns include engineering (32.0% premium with β=0.278), architecture (27.8% premium with β=0.245), business and administrative studies (28.8% premium with β=0.253), social studies (25.4% premium with β=0.226), and
Figure 4 - Earnings returns by subject of undergraduate degree – all, males and females 91.7% 41.2% 20.3% 45.1% 16.5% 30.1% 48.3% 40.2% 27.0% 32.0% 25.2% 42.6% 35.1% 11.3% 24.5% 26.7% 16.5% 19.2% 11.7% 44.5% 29.7% 70.1% 26.1% 12.4% 32.3% 11.2% 22.1% 36.9% 32.0% 15.3% 27.8% 25.4% 38.8% 28.8% 4.5% 6.3% 11.5% 19.7% 2.3% ‐1.0% 19.7% 23.5% 82.8% 38.0% 17.4% 39.7% 15.1% 27.0% 41.1% 38.1% 20.7% 31.3% 26.0% 41.2% 32.6% 8.4% 17.6% 20.8% 15.5% 10.4% 6.3% 37.0% 27.4%
‐5% 15% 35% 55% 75% 95%
Medicine and Dentistry
Subject allied to Medicine
Biological Sciences
Veterinary Sciences
Agriculture
Physical/environmental Sciences
Mathematical and Computer Sciences
Engineering
Technologies
Architecture, Building and Planning
Social Studies
Law
Business and Administrative Studies
Mass Comm. and Documentation
Linguistics, Classics and rel. subjects
European Languages and Literature
Non‐European Languages and Lit.
Historical and Philosophical Studies
Creative Arts and Design
Education
Average
Females Males All
Note: Information on subject of degree in unavailable in the 1996 Labour Force Survey. Therefore, estimated earnings returns to single subject undergraduate degree qualifications by subject use pooled Labour Force Survey data between 1997 and 2009. Earnings returns calculated as (eβ-1).
Source: London Economics
The degree subjects offering men approximately average earnings returns include physical sciences (22.1% premium with β=0.200) and education (19.7% premium with β=0.180). At the lower end of the range, undergraduate degrees in linguistics and European languages offer relatively low earnings returns to men (6.3% (β=0.061) and 11.5% (β=0.109)
respectively).
marginal earnings premiums appears to be similar to those presented for men, with undergraduate degrees in mathematical and computer sciences offering an earnings return of 48.3% (β=0.394); veterinary science 45.1% (β=0.372); education 44.5% (β=0.368); law 42.6% (β=0.355); subjects allied to medicine 41.2% (β=0.345); and
engineering 40.2% (β=0.338). Around the average, degrees in technologies, physical and environmental sciences and architecture offer marginal earnings returns of between 27.0% and 32.0% (β=0.239 and β=0.278).
The lowest returns are associated with degrees in mass communication (standing at 11.3% with β=0.107), while creative arts (11.7% and β=0.111), history/philosophy (19.2% and β=0.176), and non-European languages (16.5% and β=0.153) all offer below average returns to their holders.
Caveats with interpreting the results
It is important to note that the estimate of the marginal return to specific undergraduate degree level subjects is relative to the representative individual in possession of 2 or more GCE ‘A’ Levels. The Labour Force Survey does not provide information on the specific GCE ‘A’ Level subjects undertaken. Therefore, it is not possible to undertake a more precise analysis of the marginal return to a subject specific undergraduate degree in comparison to an individual in possession of those GCE ‘A’ levels that may have led to the acquisition of a specific degree level subject. In addition, there is no information on the grades of GCE ‘A’ Level attained. Undertaking a true estimate of the marginal return to degree level subjects controlling for appropriate GCE ‘A’ Level subject of study and grades attained would reduce the estimated variation in returns that are illustrated in Table 2 and throughout the remaining sections of the report.
3.1.1 Single subject versus combined degrees
Table 3 - Earnings returns to single or combined subject degrees– all, males and females
All Males Females
2 or more A-levels and vocational level 3 or below
Comparison
Single subject degree 0.245*** (0.005) 0.215*** (0.007) 0.261*** (0.007) Combined degree in one area 0.229*** (0.008) 0.199*** (0.012) 0.250*** (0.011) Combined degree in more than one
area 0.207*** (0.009) 0.191*** (0.014) 0.211*** (0.012)
Note: Information on single or combined degrees unavailable in the 1996 Labour Force Survey. Estimated earnings returns to single or combined subject at undergraduate degree level use pooled Labour Force Survey data between 1997 and 2009.
Robust standard errors in parentheses * 10% level of statistical significance; ** 5% level of statistical significance; *** 1% level of statistical significance.
Source: London Economics
The results indicate that there is a small premium when undergraduate degrees are obtained in a single subject area compared to combined degrees, with combined undergraduate degrees in a single subject area commanding a premium over degrees covering more than one subject area. Specifically, for individuals in aggregate, the marginal return to a single subject undergraduate degree stands at 27.8% (β=0.245) compared to a premium of 25.7% (β=0.229) for combined undergraduate degrees in a single subject area and a premium of 23.0% (β=0.207) for students completing combined degrees in more than one subject area.
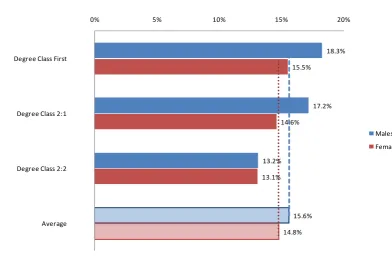
3.1.2 Grade of degrees
In Table 4, we present information on the impact of the grade of undergraduate degree7 attained on marginal earnings compared to those in possession of 2 or more GCE ‘A’ Levels. As would be expected, the earnings premium associated with undergraduate degrees increases as the grade of honours increases, although the change in premium by grade of degree is much steeper for men compared to women. In aggregate, and relative to possession of 2 or more GCE ‘A’ levels at any grade, individuals with a first class honours degree achieve a 32.7% earnings premium (β=0.283) compared a premium of 28.0% (β=0.247) for an upper second class honours degree and 21.3% for a lower second class honours degree (β=0.193).
Men moving from a lower to an upper second class honours degree achieve a 9.5 percentage point increase in hourly earnings (compared to 4.4 percentage points for women), while men moving from an upper second class honours degree to a first class honours degree achieve a 4.2 percentage point premium (compared to 3.9 percentage points for women).
7 Note that it was not possible to estimate the returns to third class honours or pass degrees as the sample
Table 4 - Earnings returns by class of undergraduate degree– all, males and females
All Males Females
Comparison 2 or more A-levels and vocational level 3 or below
First 0.283*** (0.014) 0.266*** (0.020) 0.285*** (0.020)
Upper Second 0.247*** (0.009) 0.233*** (0.014) 0.255*** (0.012)
Lower Second 0.193*** (0.010) 0.155*** (0.015) 0.220*** (0.014)
Note: Estimated earnings returns to undergraduate degree qualifications – pooled Labour Force Survey data between 2004 and 2009 was used in this analysis as information on grade of degree was only asked for the first time in 2004. Robust standard errors in parentheses. * 10% level of statistical significance; ** 5% level of statistical significance; *** 1% level of statistical significance.
Source: London Economics
3.1.3 Age of acquisition
We have also assessed the extent to which the age of acquisition is important in
determining the returns associated with undergraduate degree level qualifications. The analysis presented in Table 5 indicates that there is a strong negative relationship between the variables, with individuals acquiring the qualification earlier in their lifetime posting a much higher earnings premium compared to those attaining undergraduate degrees later in life.
In addition, the extent of this fall is much more apparent for men compared to women. Both men and women post an earnings premium of approximately 30% (β=0.253 and 0.258 respectively) when the qualification is acquired below the age of 21, while acquisition between the ages of 21 and 25 reduces the premium by approximately 3-4 percentage points for men (with no significant reduction for women). However, if the undergraduate degree is acquired between the ages of 26 and 30, the earnings premium posted by men falls to approximately 6%, and (although statistically insignificant) turns negative beyond the age of 30. Meanwhile for women, the earnings premium associated with acquisition above the age of 30 is approximately half the premium posted below the age of 25.
Table 5 - Earnings returns by acquisition age, undergraduate degree– all, males and females
All Males Females
2 or more A-levels and vocational level 3 or below
Comparison
20 or below 0.259***(0.014) 0.253***(0.021) 0.258***(0.019)
21-25 0.252***(0.006) 0.226***(0.009) 0.266***(0.008)
26-30 0.128***(0.014) 0.057***(0.020) 0.191***(0.020)
30 or above 0.064***(0.013) -0.018(0.021) 0.133***(0.017)
Note: Estimated earnings returns to Undergraduate degree qualifications – pooled Labour Force Survey data 2002-2009 (information on age of acquisition unavailable prior to 2002). Robust standard errors in
* 10% level of statistical significance; ** 5% level of statistical significance; *** 1% level of statistical significance.
Source: London Economics
3.2 Postgraduate qualifications – marginal returns
In Table 6 and Figure 5, we provide information in the marginal earnings premiums associated with postgraduate qualifications compared to possession of undergraduate degrees. The estimates indicate that there are substantial returns to postgraduate Master’s degrees, with men and women posting an 8.9% and 10.3% premium respectively (β=0.085 and 0.098). The premium achieved by those in possession of Doctorate degrees is also substantial and stands at approximately 16-17% (β=0.150 and 0.158); however, it is important to remember that these estimates probably overstate the actual earnings premiums associated with Doctorate degrees, as these individuals may also be in possession of Master’s qualifications in addition to their Doctorate qualifications. Table 6 - Earnings returns to postgraduate degrees– all, males and females
All Males Females
Undergraduate degrees and vocational level 3 or below
Comparison
Doctorate 0.150*** (0.009) 0.150*** (0.011) 0.158*** (0.015) Master’s 0.090*** (0.006) 0.085*** (0.008) 0.098*** (0.008) Note: Estimated earnings returns to HE qualifications – pooled Labour Force Survey data 1996-2009. Robust standard errors in parentheses. * 10% level of statistical significance; ** 5% level of statistical significance; *** 1% level of statistical significance.
Source: London Economics
Figure 5 - Earnings returns to postgraduate degrees – all, males and females
17.1%
10.3%
16.2%
8.9%
16.2%
9.4%
0% 2% 4% 6% 8% 10% 12% 14% 16% 18%
Doctorate
Masters
Females Males All
3.3 Other higher education qualifications – marginal returns
Finally in this section, we provide estimates of the earnings premiums associated with other higher education qualifications at sub-degree level alongside the previously reported returns associated with undergraduate degrees (for comparison purposes). In all cases, the returns are relative to those in possession of 2 or more GCE ‘A’ levels. The estimates are presented in Table 7 and Figure 6. In aggregate, the analysis indicates that there is little difference in the marginal earnings return associated with Foundation degrees, higher education Diplomas or ‘other’ forms of undergraduate higher education qualification. In particular, the returns to these qualifications stand at 13.8%, 17.1% and 7.1% respectively (β=0.129, 0.158 and 0.069) in aggregate, which represents a 14 percentage point gap (across the combined three qualification levels) compared to those in possession of undergraduate degree level qualifications (27.3% with β=0.242).
Table 7 - Earnings returns to other Higher Education qualifications – all, males and females
All Males Females
Comparison 2 or more A-levels and vocational level 3 or below
Undergraduate
degree 0.242*** (0.004) 0.211*** (0.006) 0.260*** (0.006)
Foundation Degree 0.129*** (0.032) 0.098** (0.046) 0.142*** (0.045) HE Diploma 0.158*** (0.014) 0.035 (0.024) 0.238*** (0.017)
Other HE 0.069***(0.019) 0.019(0.027) 0.114***(0.025)
Note: Estimated earnings returns to HE qualifications – pooled Labour Force Survey data 1996-2009 with the exception of Foundation Degrees (pooled 2004-2009). Robust standard errors in parentheses. * 10% level of statistical significance; ** 5% level of statistical significance; *** 1% level of statistical significance. Source: London Economics
There are some differences between men and women in possession of sub-degree higher education qualifications. In a similar way to the grade of degree, where men suffer to a greater extent in terms of earnings when achieving lower grades of honours compared to women, men in possession of other forms of sub-degree higher education qualification achieve much lower earnings premiums compared to women. Men in possession of higher education Diplomas post a (statistically insignificant) earnings premium of 3.6% (β=0.035), while men in possession of Foundation degrees post a 10.3% (β=0.098) premium. The analysis indicates that the mean marginal earnings premium associated with these three sub degree qualifications (combined) lags the returns associated with undergraduate degree level qualifications by approximately 18 percentage points.
In contrast, women perform reasonably well following acquisition of sub-degree level qualifications. Women in possession of higher education Diplomas post an earnings premium of 26.9% (β=0.238), while women in possession of Foundation degrees and ‘other’ higher education qualifications post a premium of 15.3% (β=0.142) and 12.1% (β=0.114) respectively. The mean marginal return associated with these three
Figure 6 - Earnings returns to other Higher Education qualifications – all, males and females
29.7%
15.3%
26.9%
12.1%
23.4%
10.3%
3.6%
1.9%
27.4%
13.8%
17.1%
7.1%
0% 10% 20% 30%
Undergraduate Degree
Foundation Degree
HE Diploma
Other Higher Education
Females Males Combined
Note: Earnings returns calculated as (eβ-1) – pooled Labour Force Survey data 1996-2009 (2004-09 for Foundation Degrees)
Source: London Economics
3.4 Average earnings returns
In addition to the analysis considering marginal earnings returns, we have also estimated the average earnings returns associated with different types of higher education
qualifications. The sample is restricted to all individuals having at least 2 or more GCE ‘A’ Levels and the estimates control for all qualifications held by an individual, whether it is their highest or not. The estimates relating to the entire sample are presented in Table 8, while disaggregated estimates for men and women are presented in Table 9 and Table 10 respectively.
13.9% between 1996 and 1999 (β=0.048 and 0.130), the average earnings premium associated with Doctorate level qualifications has increased by approximately 10
percentage points to between 14.1% and 23.6% between 2006 and 2009 (β=0.132 and 0.212). A similar (though less extreme) phenomenon is illustrated for Master’s degrees. Some of this information is presented in Figure 7.
The average return associated with an undergraduate degree stands at 22.1% (β=0.200) across the entire sample, with men posting a return of 20.6% (β=0.187) compared to the average return posted by women of 22.3% (β=0.201). The estimates of average returns to undergraduate degrees are slightly lower than the estimate of the marginal return (by between 3 and 6 percentage points) though this simply reflects the different model specification (see annex 2.3.1). Unlike postgraduate degrees, the average return to an undergraduate degree has dipped marginally in recent years for both men and women (although effectively unchanged across the entire period between 1996/1997 and 2009). Compared to an average return of between 25.2% and 26.7% (β=0.225 and 0.237) in 2002-2003, the average return to an undergraduate degree has fallen by between 4 and 5 percentage points to between 20.3% and 21.8% (β=0.185 and 0.197) in 2008-2009, with men displaying a slightly greater erosion of the graduate premium (5.4 percentage points) compared to women (3.3 percentage points).
In terms of other sub-degree higher education qualifications, the analysis indicates that the average return to a Foundation degree (pooled between 2004 and 2009) stands at