National Comparators for Further Education
and Work-Based Learning: 2009/10
The latest figures on learner outcomes in the Further Education (FE) and Work-based Learning (WBL) sectors in Wales show:
• Improvements, at a sector level, in FE attainment, FE success and WBL framework success between 2008/09 and 2009/10. FE completion remained static at 90 per cent.
• The overall learning activity success rate for FE in 2009/10 was 81 per cent, i.e. around four fifths of activities were successfully completed and attained.
• WBL framework success rates were 80 per cent and 81 per cent in Modern Apprenticeship (MA) and Foundation Modern Apprenticeship (FMA) programmes respectively.
Note that improvements to data quality continue to be made and may contribute to the year-on-year changes in learner outcome measures.
Chart 1: Trends in learner outcomes
0% 10% 20% 30% 40% 50% 60% 70% 80% 90% 100%
FE Completion FE Attainment FE Success WBL Framework Success
2007/08 2008/09 2009/10
This Statistical First Release presents information on learner outcomes for 2009/10, covering FE and WBL delivered by learning providers in Wales. The statistics are presented as national comparators broken down by level of study, type of learning aim, learner age and sector/subject area, and are derived from the Lifelong Learning Wales Record (LLWR).
Statistician: Scott Clifford Tel: 029 2092 6025 E-mail: [email protected]
Next update: May 2012 (provisional)
Twitter:www.twitter.com/statisticswales | www.twitter.com/ystadegaucymru
Outcomes in further education
Chart 1 shows that across all further education programmes in 2009/10, 90 per cent of learning activities were completed and of those activities with an assessable outcome, 89 per cent were attained. Overall, 81 per cent of learning activities were successfully completed and attained, an increase from 76 per cent in 2008/09.
Analysis of FE success rates by sector/subject area (Chart 2) shows that:
• Success rates were highest in the areas of Hospitality and Catering, Independent Living Skills, Education and Training; Agriculture, Horticulture and Animal Care; and Health, Public Services and Care.
• Success rates were lowest in the areas of Science and Mathematics; English for Speakers of Other Languages; Social Sciences; Adult Basic Education; Business, Administration and Law; and History, Philosophy and Theology.
Chart 2: FE learning activity success rates by sector/subject area, 2009/10
0% 10% 20% 30% 40% 50% 60% 70% 80% 90% 100% Hos pital
ity a nd C
ater ing
Indep enden
t Livi ng S
kills
Educ atio
n and T raini
ng
Agr icultu
re, H orticu
lture and
Ani mal C
are
Heal th, P
ublic S ervi ces and Car e Leis ure, Tra vel an
d T our
ism Perfo
rming A rts Art a
nd De sign
Con stru
ction , Pla
nning and the B
uilt En viro
nm ent
Foun datio
n for Wor k Ret ailing and Cus tom er S
ervi ce
Eng ineer
ing a nd Man ufac turin g T echno logi es Info rmat
ion and Com muni catio n Te chno logy Lan guag
es, L iterat ure and Cult ure Hair and Bea uty Hist ory, Phi loso phy and T
heo logy
Bus ines
s, A dm
inist ratio
n and Law
Adu lt B
asic Educ
atio n
Soc ial S
cienc es
Eng lish
for S peake
rs of O ther La ngu ages Sci enc
e an d Ma
them atics
2009/10 National Comparator
Analysis of FE success rates by learner age group shows that:
• despite some variations for different programmes of study, there was little difference in overall success rates for learners aged 18 and under and those aged 19 and over;
Outcomes in work-based learning
Learners on Apprenticeship programmes have to achieve a range of qualifications including an NVQ, key skills and technical certificate in order to gain the full Apprenticeship ‘framework’. In 2009/10, 80 per cent of learners across all Modern Apprenticeship (MA) and Foundation Modern Apprenticeship (FMA) programmes achieved this, compared to 75 per cent in 2008/09 and 66 per cent in 2007/08.
At a sector level, the success rate for FMAs was slightly higher than for MAs. This was reflected across most areas, with only Hair and Beauty having a higher MA success rate. All subject areas exceeded the Welsh Assembly Government contractual requirement of 50 per cent framework success and this is reflected in an overall NVQ success rate of 82 per cent on both FMA and MA programmes.
Overall, the best performing areas were Business, Administration and Law; Education and Training; Retailing and Customer Service; Engineering and Manufacturing Technologies; and Leisure, Travel and Tourism. Chart 3 shows the pattern of framework success rates on Apprenticeship programmes.
Chart 3: WBL framework success rates by sector/subject area, 2009/10
0% 10% 20% 30% 40% 50% 60% 70% 80% 90% 100% Busi ness, Adm inis trat ion an d Law Ed ucat
ion an d Tr
aini ng
Reta iling and
Cust ome r Se rvic e Engine ering and Ma nufa ctur
ing T echno logi es Leis ure, Trav el an
d T our
ism
Healt h, P
ubl ic S
ervic es a
nd Car e
Hos pita
lity a nd C
ate ring
Info rmati
on a nd C
om muni cat ion Tec hnol ogy Cons truc tion , Pla
nnin g a
nd th e Bu
ilt En viro
nm ent
Hair and Beaut y Agricu lture , H ortic ultu re an
d A nima
l Care
FMA MA
Analysis of WBL activity success rates by learner age group shows that:
• On FMA, MA and Skill Build learning activities, learners aged 19 and over generally have higher success rates than younger learners.
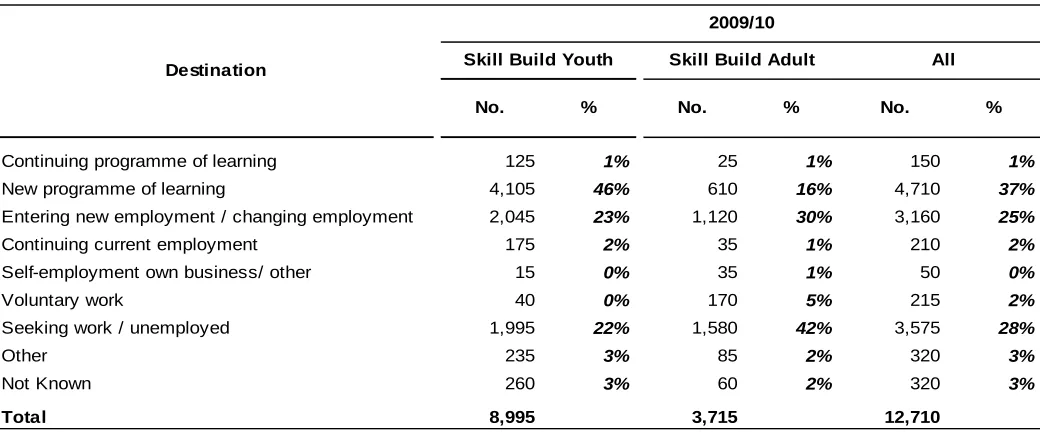
Analysis of learner destination, during the six month period following the end of a Skill Build learning programme, shows that:
• 46 per cent of leavers from Skill Build Youth programmes progressed into further learning compared with 16 per cent of leavers from Skill Build Adult programmes;
• 23 per cent from Skill Build Youth programmes entered employment compared with 30 per cent of leavers from Skill Build Adult programmes; and
Tables
Tables 1a – 1c Completion, attainment and success rates for FE provision by notional level, broad type of learning aim, learning aim length and age group
Tables 2a – 2c Completion, attainment and success rates for FE provision by sector/subject area and learning aim length
Table 3 Success rates for WBL provision by programme, broad type of learning aim and age group
Table 4 Success rates for WBL NVQ provision by sector/subject area and type of programme
Table 5 Framework success rates for WBL provision by sector/subject area type of programme and programme type
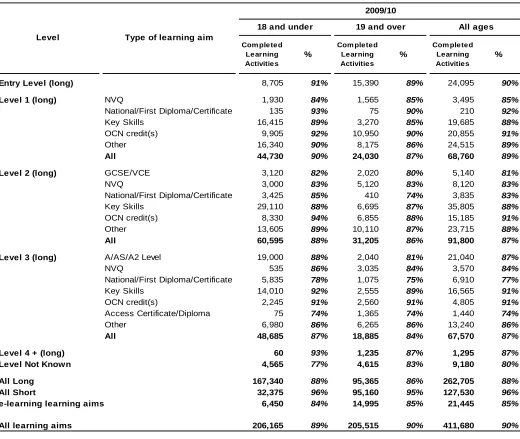
Table 1a - Completion rates for FE provision by notional level, broad type of learning aim, learning aim length and age group
Com pleted Learning Activities
%
Com pleted Learning Activities
%
Com pleted Learning Activities
%
Entry Level (long) 8,705 91% 15,390 89% 24,095 90%
Level 1 (long) NVQ 1,930 84% 1,565 85% 3,495 85%
National/First Diploma/Certificate 135 93% 75 90% 210 92%
Key Skills 16,415 89% 3,270 85% 19,685 88%
OCN credit(s) 9,905 92% 10,950 90% 20,855 91%
Other 16,340 90% 8,175 86% 24,515 89%
All 44,730 90% 24,030 87% 68,760 89%
Level 2 (long) GCSE/VCE 3,120 82% 2,020 80% 5,140 81%
NVQ 3,000 83% 5,120 83% 8,120 83%
National/First Diploma/Certificate 3,425 85% 410 74% 3,835 83%
Key Skills 29,110 88% 6,695 87% 35,805 88%
OCN credit(s) 8,330 94% 6,855 88% 15,185 91%
Other 13,605 89% 10,110 87% 23,715 88%
All 60,595 88% 31,205 86% 91,800 87%
Level 3 (long) A/AS/A2 Level 19,000 88% 2,040 81% 21,040 87%
NVQ 535 86% 3,035 84% 3,570 84%
National/First Diploma/Certificate 5,835 78% 1,075 75% 6,910 77%
Key Skills 14,010 92% 2,555 89% 16,565 91%
OCN credit(s) 2,245 91% 2,560 91% 4,805 91%
Access Certificate/Diploma 75 74% 1,365 74% 1,440 74%
Other 6,980 86% 6,265 86% 13,240 86%
All 48,685 87% 18,885 84% 67,570 87%
Level 4 + (long) 60 93% 1,235 87% 1,295 87%
Level Not Known 4,565 77% 4,615 83% 9,180 80%
All Long 167,340 88% 95,365 86% 262,705 88%
All Short 32,375 96% 95,160 95% 127,530 96%
6,450 84% 14,995 85% 21,445 85%
All learning aims 206,165 89% 205,515 90% 411,680 90%
Source: Lifelong Learning Wales Record (LLWR) e-learning learning aims
Type of learning aim Level
2009/10
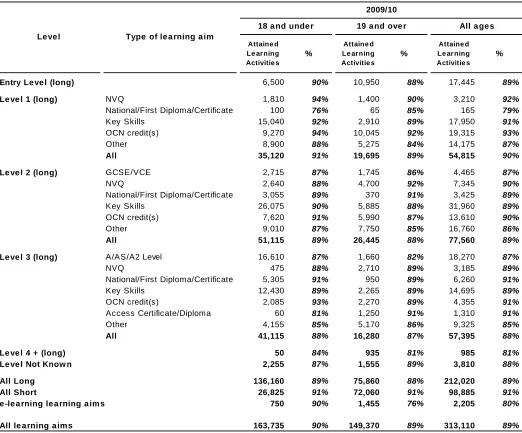
Ta ble 1b - Atta inm e nt ra te s for FE provision by notiona l le ve l, broa d type of le a rning a im , le a rning a im le ngth a nd a ge group
Attaine d Le ar ning Activitie s
%
Attaine d Le ar ning Activitie s
%
Attaine d Le ar ning Activitie s
%
Entry Le ve l (long) 6,500 90% 10,950 88% 17,445 89%
Le ve l 1 (long) NVQ 1,810 94% 1,400 90% 3,210 92%
National/First Diploma/Certificate 100 76% 65 85% 165 79%
Key Skills 15,040 92% 2,910 89% 17,950 91%
OCN credit(s) 9,270 94% 10,045 92% 19,315 93%
Other 8,900 88% 5,275 84% 14,175 87%
All 35,120 91% 19,695 89% 54,815 90%
Le ve l 2 (long) GCSE/VCE 2,715 87% 1,745 86% 4,465 87%
NVQ 2,640 88% 4,700 92% 7,345 90%
National/First Diploma/Certificate 3,055 89% 370 91% 3,425 89%
Key Skills 26,075 90% 5,885 88% 31,960 89%
OCN credit(s) 7,620 91% 5,990 87% 13,610 90%
Other 9,010 87% 7,750 85% 16,760 86%
All 51,115 89% 26,445 88% 77,560 89%
Le ve l 3 (long) A/AS/A2 Level 16,610 87% 1,660 82% 18,270 87%
NVQ 475 88% 2,710 89% 3,185 89%
National/First Diploma/Certificate 5,305 91% 950 89% 6,260 91%
Key Skills 12,430 89% 2,265 89% 14,695 89%
OCN credit(s) 2,085 93% 2,270 89% 4,355 91%
Access Certificate/Diploma 60 81% 1,250 91% 1,310 91%
Other 4,155 85% 5,170 86% 9,325 85%
All 41,115 88% 16,280 87% 57,395 88%
Le ve l 4 + (long) 50 84% 935 81% 985 81%
Le ve l Not Know n 2,255 87% 1,555 89% 3,810 88%
All Long 136,160 89% 75,860 88% 212,020 89%
All Short 26,825 91% 72,060 91% 98,885 91%
750 90% 1,455 76% 2,205 80%
All le a rning a im s 163,735 90% 149,370 89% 313,110 89%
e -le a rning le a rning a im s
Type of le a rning a im Le ve l
2009/10
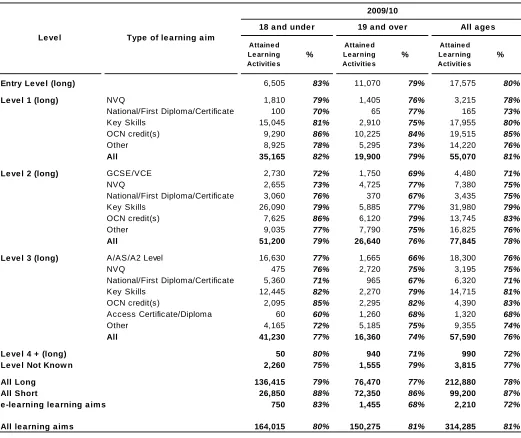
[image:6.595.45.567.80.513.2]Ta ble 1c - Succe ss ra te s for FE provision by notiona l le ve l, broa d type of le a rning a im , le a rning a im le ngth a nd a ge group
Attaine d Le ar ning Activitie s
%
Attaine d Le ar ning Activitie s
%
Attaine d Le ar ning Activitie s
%
Entry Le ve l (long) 6,505 83% 11,070 79% 17,575 80%
Le ve l 1 (long) NVQ 1,810 79% 1,405 76% 3,215 78%
National/First Diploma/Certificate 100 70% 65 77% 165 73%
Key Skills 15,045 81% 2,910 75% 17,955 80%
OCN credit(s) 9,290 86% 10,225 84% 19,515 85%
Other 8,925 78% 5,295 73% 14,220 76%
All 35,165 82% 19,900 79% 55,070 81%
Le ve l 2 (long) GCSE/VCE 2,730 72% 1,750 69% 4,480 71%
NVQ 2,655 73% 4,725 77% 7,380 75%
National/First Diploma/Certificate 3,060 76% 370 67% 3,435 75%
Key Skills 26,090 79% 5,885 77% 31,980 79%
OCN credit(s) 7,625 86% 6,120 79% 13,745 83%
Other 9,035 77% 7,790 75% 16,825 76%
All 51,200 79% 26,640 76% 77,845 78%
Le ve l 3 (long) A/AS/A2 Level 16,630 77% 1,665 66% 18,300 76%
NVQ 475 76% 2,720 75% 3,195 75%
National/First Diploma/Certificate 5,360 71% 965 67% 6,320 71%
Key Skills 12,445 82% 2,270 79% 14,715 81%
OCN credit(s) 2,095 85% 2,295 82% 4,390 83%
Access Certificate/Diploma 60 60% 1,260 68% 1,320 68%
Other 4,165 72% 5,185 75% 9,355 74%
All 41,230 77% 16,360 74% 57,590 76%
Le ve l 4 + (long) 50 80% 940 71% 990 72%
Le ve l Not Know n 2,260 75% 1,555 79% 3,815 77%
All Long 136,415 79% 76,470 77% 212,880 78%
All Short 26,850 88% 72,350 86% 99,200 87%
750 83% 1,455 68% 2,210 72%
All le a rning a im s 164,015 80% 150,275 81% 314,285 81%
Source: Lifelong Learning W ales Record (LLW R) e -le a rning le a rning a im s
Type of le a rning a im Le ve l
2009/10
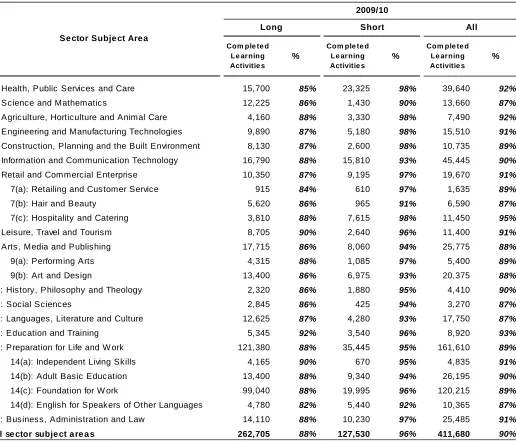
[image:7.595.44.565.79.517.2]Ta ble 2a - Com ple tion ra te s for FE provision by se ctor subje ct a re a a nd le a rning a im le ngth
Com ple te d Le ar ning Activitie s
%
Com ple te d Le ar ning Activitie s
%
Com ple te d Le ar ning Activitie s
%
1: Health, Public Services and Care 15,700 85% 23,325 98% 39,640 92%
2: Science and Mathematics 12,225 86% 1,430 90% 13,660 87%
3: Agriculture, Horticulture and Animal Care 4,160 88% 3,330 98% 7,490 92%
4: Engineering and Manufacturing Technologies 9,890 87% 5,180 98% 15,510 91%
5: Construction, Planning and the Built Environment 8,130 87% 2,600 98% 10,735 89% 6: Information and Communication Technology 16,790 88% 15,810 93% 45,445 90%
7: Retail and Commercial Enterprise 10,350 87% 9,195 97% 19,670 91% 7(a): Retailing and Customer Service 915 84% 610 97% 1,635 89%
7(b): Hair and Beauty 5,620 86% 965 91% 6,590 87%
7(c): Hospitality and Catering 3,810 88% 7,615 98% 11,450 95%
8: Leisure, Travel and Tourism 8,705 90% 2,640 96% 11,400 91%
9: Arts, Media and Publishing 17,715 86% 8,060 94% 25,775 88%
9(a): Performing Arts 4,315 88% 1,085 97% 5,400 89%
9(b): Art and Design 13,400 86% 6,975 93% 20,375 88%
10: History, Philosophy and Theology 2,320 86% 1,880 95% 4,410 90%
11: Social Sciences 2,845 86% 425 94% 3,270 87%
12: Languages, Literature and Culture 12,625 87% 4,280 93% 17,750 87%
13: Education and Training 5,345 92% 3,540 96% 8,920 93%
14: Preparation for Life and W ork 121,380 88% 35,445 95% 161,610 89% 14(a): Independent Living Skills 4,165 90% 670 95% 4,835 91%
14(b): Adult Basic Education 13,400 88% 9,340 94% 26,195 90% 14(c): Foundation for W ork 99,040 88% 19,995 96% 120,215 89%
14(d): English for Speakers of Other Languages 4,780 82% 5,440 92% 10,365 87%
15: Business, Administration and Law 14,110 88% 10,230 97% 25,485 91%
All se ctor subje ct a re a s 262,705 88% 127,530 96% 411,680 90%
Source: Lifelong Learning W ales Record (LLW R) Se ctor Subje ct Are a
2009/10
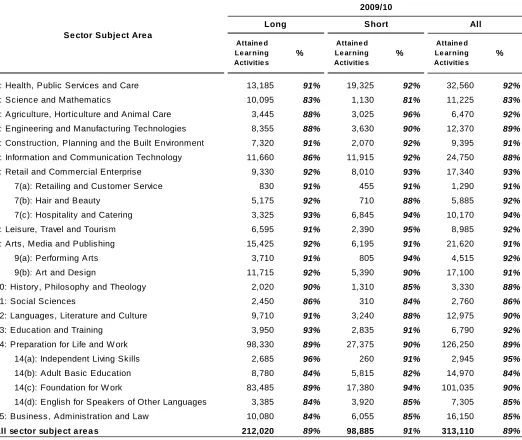
[image:8.595.54.570.81.522.2]Ta ble 2b - Atta inm e nt ra te s for FE provision by se ctor subje ct a re a a nd le a rning a im le ngth
Attaine d Le ar ning Activitie s
%
Attaine d Le ar ning Activitie s
%
Attaine d Le ar ning Activitie s
%
1: Health, Public Services and Care 13,185 91% 19,325 92% 32,560 92%
2: Science and Mathematics 10,095 83% 1,130 81% 11,225 83%
3: Agriculture, Horticulture and Animal Care 3,445 88% 3,025 96% 6,470 92%
4: Engineering and Manufacturing Technologies 8,355 88% 3,630 90% 12,370 89%
5: Construction, Planning and the Built Environment 7,320 91% 2,070 92% 9,395 91% 6: Information and Communication Technology 11,660 86% 11,915 92% 24,750 88%
7: Retail and Commercial Enterprise 9,330 92% 8,010 93% 17,340 93% 7(a): Retailing and Customer Service 830 91% 455 91% 1,290 91%
7(b): Hair and Beauty 5,175 92% 710 88% 5,885 92%
7(c): Hospitality and Catering 3,325 93% 6,845 94% 10,170 94%
8: Leisure, Travel and Tourism 6,595 91% 2,390 95% 8,985 92%
9: Arts, Media and Publishing 15,425 92% 6,195 91% 21,620 91%
9(a): Performing Arts 3,710 91% 805 94% 4,515 92%
9(b): Art and Design 11,715 92% 5,390 90% 17,100 91%
10: History, Philosophy and Theology 2,020 90% 1,310 85% 3,330 88%
11: Social Sciences 2,450 86% 310 84% 2,760 86%
12: Languages, Literature and Culture 9,710 91% 3,240 88% 12,975 90%
13: Education and Training 3,950 93% 2,835 91% 6,790 92%
14: Preparation for Life and W ork 98,330 89% 27,375 90% 126,250 89% 14(a): Independent Living Skills 2,685 96% 260 91% 2,945 95%
14(b): Adult Basic Education 8,780 84% 5,815 82% 14,970 84% 14(c): Foundation for W ork 83,485 89% 17,380 94% 101,035 90%
14(d): English for Speakers of Other Languages 3,385 84% 3,920 85% 7,305 85%
15: Business, Administration and Law 10,080 84% 6,055 85% 16,150 85%
All se ctor subje ct a re a s 212,020 89% 98,885 91% 313,110 89%
Source: Lifelong Learning W ales Record (LLW R) Se ctor Subje ct Are a
2009/10
[image:9.595.50.572.84.524.2]Ta ble 2c - Succe ss ra te s for FE provision by se ctor subje ct a re a a nd le a rning a im le ngth
Attaine d Le ar ning Activitie s
%
Attaine d Le ar ning Activitie s
%
Attaine d Le ar ning Activitie s
%
1: Health, Public Services and Care 13,260 77% 19,345 91% 32,650 85%
2: Science and Mathematics 10,125 73% 1,135 74% 11,265 73%
3: Agriculture, Horticulture and Animal Care 3,460 79% 3,030 94% 6,490 85%
4: Engineering and Manufacturing Technologies 8,405 76% 3,635 88% 12,425 80%
5: Construction, Planning and the Built Environment 7,375 80% 2,075 91% 9,450 82% 6: Information and Communication Technology 11,765 76% 11,985 86% 24,925 80%
7: Retail and Commercial Enterprise 9,370 81% 8,015 91% 17,390 85% 7(a): Retailing and Customer Service 835 77% 455 88% 1,290 80%
7(b): Hair and Beauty 5,185 80% 710 79% 5,890 80%
7(c): Hospitality and Catering 3,355 83% 6,850 92% 10,205 89%
8: Leisure, Travel and Tourism 6,605 80% 2,390 91% 9,000 83%
9: Arts, Media and Publishing 15,580 81% 6,235 85% 21,815 82%
9(a): Performing Arts 3,740 80% 805 90% 4,545 82%
9(b): Art and Design 11,845 81% 5,430 84% 17,270 82%
10: History, Philosophy and Theology 2,025 78% 1,310 82% 3,335 79%
11: Social Sciences 2,455 75% 310 78% 2,765 75%
12: Languages, Literature and Culture 9,835 79% 3,270 83% 13,130 80%
13: Education and Training 3,960 86% 2,845 87% 6,805 86%
14: Preparation for Life and W ork 98,485 79% 27,485 86% 126,515 80% 14(a): Independent Living Skills 2,685 89% 260 87% 2,945 88%
14(b): Adult Basic Education 8,825 76% 5,835 77% 15,030 77% 14(c): Foundation for W ork 83,550 79% 17,415 90% 101,140 81%
14(d): English for Speakers of Other Languages 3,430 70% 3,975 79% 7,405 75%
15: Business, Administration and Law 10,115 74% 6,075 83% 16,200 77%
All se ctor subje ct a re a s 212,880 78% 99,200 87% 314,285 81%
Source: Lifelong Learning W ales Record (LLW R) Se ctor Subje ct Are a
2009/10
[image:10.595.50.572.83.525.2]Ta ble 3 - Le a rning a ctivity success rate s for W BL provision by programme , type of lea rning aim a nd a ge group
Attaine d Le ar ning Activitie s
%
Attaine d Le arning Activitie s
%
Attaine d Le arning Activitie s
%
Foundation Modern NVQ 2,265 79% 6,180 84% 8,450 82%
Apprentice ship Key Skills 3,500 82% 12,610 88% 16,110 86%
Other 1,880 81% 4,915 87% 6,795 85%
All 7,645 81% 23,710 86% 31,355 85%
NVQ 965 79% 4,615 82% 5,580 81%
Key Skills 1,100 83% 8,105 86% 9,205 86%
Other 805 82% 4,005 84% 4,810 84%
All 2,870 81% 16,725 84% 19,595 84%
NVQ * * 745 82% 750 82%
Key Skills 0 n/a 370 81% 370 81%
Other 0 n/a 235 76% 235 76%
All * * 1,355 81% 1,360 81%
NVQ * * 30 * 30 *
Key Skills 25 * 10 * 35 *
Other 15 * 85 83% 105 79%
All 40 76% 130 83% 170 81%
Skill Build Youth NVQ 1,360 68% 10 * 1,370 69%
Key Skills 10,835 81% 20 * 10,855 81%
Certificate in Adult Literacy 1,540 72% 10 * 1,545 72% Certificate in Adult Numeracy 1,890 75% 15 * 1,905 75% Gaining Opportunities & Living Skills 335 95% * * 335 95%
Pacific Institute 435 90% * * 440 89%
The ASDAN Foundation Training Award 35 * * * 35 *
Other 5,385 74% 25 * 5,415 74%
All 21,815 78% 85 70% 21,900 78%
Skill Build Adult NVQ 35 69% 675 74% 710 74%
Key Skills 385 74% 4,560 79% 4,945 79%
Certificate in Adult Literacy 25 * 305 77% 330 76%
Certificate in Adult Numeracy 25 * 350 77% 375 75%
Gaining Opportunities & Living Skills 30 * 545 95% 575 95%
Pacific Institute 5 * 125 95% 135 96%
Other 200 69% 3,395 79% 3,590 79%
All 705 72% 9,955 80% 10,660 79%
Fle xible Lea rning NVQ 10 * 540 79% 550 79%
Key Skills 0 n/a 130 86% 130 86%
Other * * 15 * 15 *
All 10 * 685 79% 695 80%
Source: Lifelong Learning W ales Record (LLW R) 2009/10
18 a nd unde r 19 a nd ove r All age s
Type of Progra mme Type of le a rning a im
Mode rn Skills Diploma
Pre Appre ntice ship Le a rning
[image:11.595.51.573.78.655.2]Ta ble 4 - Le a rning a ctivity succe ss ra te s for a ppre ntice ship NVQ provision by se ctor subje ct a re a a nd type of progra m m e
Attaine d Le ar ning Activitie s
%
Attaine d Le ar ning Activitie s
%
Attaine d Le ar ning Activitie s
%
1: Health, Public Services and Care 1,835 82% 1,320 79% 3,155 81%
3: Agriculture, Horticulture and Animal Care 50 91% 25 * 75 89%
4: Engineering and Manufacturing Technologies 1,180 85% 770 83% 1,950 84% 5: Construction, Planning and the Built Environment 1,105 79% 885 76% 1,990 78%
6: Information and Communication Technology 570 83% 265 76% 835 80%
7: Retail and Commercial Enterprise 2,510 80% 650 82% 3,160 81%
7(a): Retailing and Customer Service 1,435 83% 375 81% 1,810 82%
7(b): Hair and Beauty 490 79% 140 87% 625 81%
7(c): Hospitality and Catering 585 76% 135 79% 720 77%
8: Leisure, Travel and Tourism 115 85% 110 81% 225 83%
13: Education and Training 60 94% 315 88% 375 89%
15: Business, Administration and Law 1,025 86% 1,240 86% 2,270 86%
All se ctor subje ct a re a s 8,450 82% 5,580 81% 14,025 82%
Source: Lifelong Learning W ales Record (LLW R) Se ctor Subje ct Are a
2009/10
Founda tion Mode rn Appre ntice ships
Mode rn
Appre ntice ships All Appre ntice ships
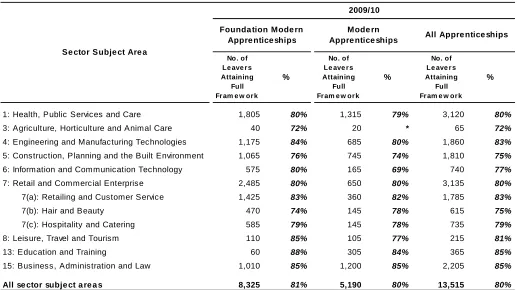
Ta ble 5 - Fra m e w ork succe ss ra te s for W BL provision by se ctor subje ct a re a a nd progra m m e type
No. of Le ave r s Attaining
Full Fr am e w or k
%
No. of Le ave r s Attaining
Full Fr am e w or k
%
No. of Le ave r s Attaining
Full Fr am e w or k
%
1: Health, Public Services and Care 1,805 80% 1,315 79% 3,120 80%
3: Agriculture, Horticulture and Animal Care 40 72% 20 * 65 72%
4: Engineering and Manufacturing Technologies 1,175 84% 685 80% 1,860 83% 5: Construction, Planning and the Built Environment 1,065 76% 745 74% 1,810 75% 6: Information and Communication Technology 575 80% 165 69% 740 77%
7: Retail and Commercial Enterprise 2,485 80% 650 80% 3,135 80%
7(a): Retailing and Customer Service 1,425 83% 360 82% 1,785 83%
7(b): Hair and Beauty 470 74% 145 78% 615 75%
7(c): Hospitality and Catering 585 79% 145 78% 735 79%
8: Leisure, Travel and Tourism 110 85% 105 77% 215 81%
13: Education and Training 60 88% 305 84% 365 85%
15: Business, Administration and Law 1,010 85% 1,200 85% 2,205 85%
All se ctor subje ct a re a s 8,325 81% 5,190 80% 13,515 80%
Se ctor Subje ct Are a
2009/10
Founda tion Mode rn Appre ntice ships
Mode rn
[image:12.595.45.552.82.366.2] [image:12.595.42.559.417.707.2]Table 6 - Destinations of Skill Build leavers in six month period following end of programme
No. % No. % No. %
Continuing programme of learning 125 1% 25 1% 150 1%
New programme of learning 4,105 46% 610 16% 4,710 37%
Entering new employment / changing employment 2,045 23% 1,120 30% 3,160 25%
Continuing current employment 175 2% 35 1% 210 2%
Self-employment own business/ other 15 0% 35 1% 50 0%
Voluntary work 40 0% 170 5% 215 2%
Seeking work / unemployed 1,995 22% 1,580 42% 3,575 28%
Other 235 3% 85 2% 320 3%
Not Known 260 3% 60 2% 320 3%
Total 8,995 3,715 12,710
Source: Lifelong Learning Wales Record (LLWR) Destination
2009/10
Notes
1. Data Sources
This Statistical First Release (SFR) summarises data on learner outcomes for 2009/10. It covers further education (FE) and work based learning (WBL) provision delivered by learning providers funded by DCELLS (Department for Children, Education, Lifelong Learning and Skills). However, the figures are not restricted to fundable provision at those providers.
Data on learners accessing FE and WBL provision across Wales is submitted electronically to DCELLS by learning providers via the Lifelong Learning Wales Record (LLWR). This data is used for funding, monitoring performance and outcomes and to inform strategy development. Furthermore, the data provides the official source of statistics on Post 16 (non-higher education) learners in Wales.
Further information on LLWR including user support manuals can be found at:
Welsh Assembly Government - Lifelong Learning Wales Record
Our statement of administrative sources, which also refers to this data source, can be found at:
Statement of Administrative Sources
2. Definitions
2.1 Terminology
• The term ‘academic year’ is used throughout this release to refer to the period 1 August to 31 July.
• The term ‘learning activity’ refers to a specific qualification or course pursued by a learner, for example, an NVQ or Key Skill. The term ‘learning programme’ refers to a group of related learning activities.
2.2 Cohorts
• The base cohorts underpinning tables 1a – 1c and 2a – 2c comprise all learning activities that were either expected to complete during the respective academic year or actually ended during the academic year but were expected to complete prior to it.
• The base cohorts underpinning tables 5 and 6 comprise all work based learning programmes recorded as ending in the respective academic year.
• The base cohorts underpinning tables 3 and 4 comprise all learning activities associated with work based learning programmes recorded as ending in the respective academic year.
2.3 Provision type
• For the purposes of this statistical release, WBL provision is defined as that submitted to the LLWR by a WBL provider or provision at FE institutions comprising a WBL designated learning
• Foundation Modern Apprenticeships (FMAs) and Modern Apprenticeships (MAs) are employment-based learning programmes for employed learners aged 16 and above, to NVQ Level 2 or 3
respectively.
• The Skill Build programme offers those not in employment (unemployed, or inactive) work-related skills including pre-NVQ learning, vocationally focused qualifications at Levels 1, 2 and 3, help with Basic Skills, and key employability skills.
• Further education (FE) provision is defined as that submitted to the LLWR by an FE institution excluding provision categorised as WBL. Specifically, it excludes provision delivered by Merthyr Tydfil College which merged with the University of Glamorgan on 1 April 2006.
• Provision submitted to the LLWR by an FE institution but delivered by a Local Education Authority (LEA) as part of a subcontracting arrangement is categorised as FE provision.
• Higher Education (HE) level provision delivered by FE institutions has been excluded from this release.
• Welsh for Adults (WfA) provision submitted to the LLWR by Coleg Gwent has been excluded from this release.
• Pathways to Apprenticeships provision is excluded from this release as is data relating to the following WBL pilot programmes: Six Month Offer, Pre-Employment Training (formerly Local Employment Partnership Pre-Employment Training (LEP-PET)), Young Persons Guarantee – Routes into Work and Shared Apprenticeships.
2.4 Completion, Attainment and Success
• The completion rates shown in tables 1a and 2a are calculated as the number of learning activities completed divided by the number of learning activities terminated (completed or withdrawn).
• The attainment rates shown in tables 1b and 2b are calculated as the number of learning activities attained divided by the number of learning activities completed.
• The success rates shown in tables 1c, 2c, 3 and 4 are calculated as the number of learning activities attained divided by the number of learning activities terminated.
• Learning activities that are deemed to be non-assessable (i.e. do not lead to an associated award) are excluded from the denominators of the attainment and success rate calculations.
• Learning activities recorded as either transferred or continuing are excluded from all calculations.
2.5 Framework Success
• Learning programmes recorded as either transferred or continuing at another WBL provider are excluded from the calculation. Learning programmes that ended within 6 weeks of commencing without completion are also excluded.
2.6 Long / Short learning activities
• Tables 1a – 1c and 2a – 2c show results for both long and short learning activities. Short learning activities are those with an expected length of fewer than 24 weeks.
2.7 Learner Age Group
• A learner’s age group is calculated from their age at 31 August in the academic year they started their learning activity. Learners of unknown age are included in the age group 19 and over.
2.8 Sector/Subject Areas
• The sector/subject areas detailed in Tables 2a – 2c, 4 and 5 are based on the 15 first-tier areas of learning in the Qualifications and Curriculum Development Agency’s (QCDA) sector/subject framework and reflect the sub-areas used by Estyn for inspection purposes.
• The total lines include learning activities with unknown sector/subject areas.
• Apprenticeship programmes have been mapped to sector/subject areas in table 5 on the basis of the occupational sector code. The NVQs detailed in table 4 have been mapped to the same sector/subject area as the overarching programme.
2.9 Early Drop-out
• For FE provision, long learning activities that ended before 1 November of the academic year in which they commenced without completing have been classified as early drop-outs and excluded from calculations.
• In the case of WBL provision, long learning activities that ended within 6 weeks of their start date without completing have been classified as early drop-outs and excluded from calculations.
2.10 Destinations
• The destinations of Skill Build learners detailed in Table 6 are a combination of the destination immediately following the learning programme and, where additional information was available, the destination six months after leaving. This methodology differs from that used prior to 2008/09.
3. Rounding and Suppression
• All figures in this Statistical Release are rounded to the nearest 5 and therefore there may be apparent slight differences between the sum of the constituent rows/columns and the totals. A ‘*’ represents numbers greater than 0 but less than 5.
• In addition, percentage calculations where the denominator is less than 50 have been suppressed and the percentage replaced with a ‘*‘.
4. Key Quality Information
This section provides a summary of information on this output against five dimensions of quality: Relevance, Accuracy, Timeliness and Punctuality, Accessibility and Clarity, and Comparability.
4.1 Relevance
The measures set out in this publication are primarily used:
• by the Welsh Assembly Government - DCELLS, to monitor providers’ performance and as baseline information to set targets for improvements as part of the Quality and Effectiveness Framework for post-16 learning;
• by Estyn, to inform inspection judgements on Key Question 1 ‘How well do learners achieve?’, and;
• by providers themselves, as a management tool to measure their own performance and benchmark themselves against sector averages, as part of their annual self-assessment cycles.
The Assembly Government and Estyn have a commitment to share data in order to minimise
bureaucracy for providers and ensure consistent definitions of performance wherever possible and have worked together closely to develop these measures and a standard format for presenting data.
The measures are also used both within and outside the WAG to monitor educational trends and as a baseline for further analysis of the underlying data. Some of the key users are:
• Ministers and the Members Research Service in the National Assembly for Wales; • Officials in the Assembly Government;
• Other government departments; • Students, researchers, and academics;
• Individual citizens, private companies, and the media.
These statistics are used in a variety of ways. Some examples of these are:
• general background and research; • inclusion in reports and briefings; • advice to Ministers;
4.2 Accuracy
Statisticians within the Assembly Government undertake a process of data-reconciliation ahead of publishing this release. Monthly reconciliation reports detailing provisional learner outcomes figures are issued to FE institutions and WBL providers. Data quality issues are then followed up and resolved in liaison with DCELLS officials.
The following table summarises the improvements to FE institutions’ data quality over the last three years:
2007/08 2008/09 2009/10
% of completed, assessable learning activities not
linking to an award 13 7 3
% of completed, assessable learning activities linking
to an award where the result is unknown 6 2 2
Source: Lifelong Learning Wales Record (LLWR)
4.3 Timeliness and Punctuality
Data for a given academic year are published as soon as possible. The current annual timescale for the production of final learner outcomes data has been agreed in consultation with learning providers and balances timeliness against the need for accurate data-quality in order to underpin robust sector benchmarks. Statistics on a given academic year are drawn from a database based on the LLWR as at March following the end of the academic year. This first release is then produced and published as soon as possible during May.
4.4 Accessibility and Clarity
This statistical release is pre-announced and then published on the Statistics section of the Welsh Assembly website.
4.5 Comparability
Figures in this statistical release are comparable with previous years. Links to the previous two years’ releases are provided below:
National Comparators for Further Education and Work-Based Learning, 2007/08
National Comparators for Further Education and Work-Based Learning, 2008/09
Equivalent data on post-16 learner outcomes in England, Scotland and Northern Ireland can be found on the websites of the Data Service, Scottish Funding Council (SFC) and Department for Employment and Learning – Northern Ireland (DELNI) respectively:
The Data Service - Current Statistical First Release
Department for Employment & Learning Northern Ireland - Further Education Performance Statistics
However, due to differences in methodology and data collection, caution should be exercised in making direct comparisons with the figures contained within this release.
5. Additional Information
5.1 Further dissemination of performance measures
More detailed tables including trends over time will be made available soon on StatsWales, a free to use service that allows visitors to view, manipulate, create and download data. Data for individual learning providers can be made available to users on request.
Learner Outcomes Reports (LORs) for individual providers will be published by DCELLS in May and June 2011:
Learner Outcomes Reports for Further Education
Learner Outcomes Reports for Work Based Learning Providers
Data underpinning the 2009/10 performance measures will also be included in WAG - DCELLS’ online benchmarking tool for use by FE institutions and WBL providers. This will enable providers to make detailed comparisons of their learner outcomes down to individual learning activity level. Estyn inspectors will also have access to the benchmarking tool in order to inform their judgements on how well learners achieve.
5.2 Learner outcomes for Adult Community Learning
Analysis has also been recently undertaken in liaison with DCELLS and NIACE Dysgu Cymru in order to develop learner outcomes data for the Adult Community Learning (ACL) sector in Wales.
A statistical article summarising the results of this analysis will be published later this year.
5.3 Consistent Measures for Post-16 Learning
Throughout 2010 work was undertaken on a project to investigate the development of a set of consistent performance measures for learners aged 16 to 18 at school sixth forms and FE institutions. A statistical article summarising the progress of this work can be found at:
Update on the Development of Consistent Performance Measures for Learners aged 16 to 18
5.4 Other outputs sourced from LLWR data
• Further Education, Work-based Learning and Community Learning in Wales, 2009/10 and 2010/11 (early figures) – headline national trends in volumes of learning, published 27 April 2011.
• Further Education, Work-based Learning and Community Learning in Wales Statistics, 2009/10 – Reference volume, due autumn 2011.