Childcare and early
years survey of parents
2010
Patten Smith, Nicholas Gilby, Sarah Dobie, Sylvie
Hobden, Louise Sullivan and Matthew Williams with
Mandy Littlewood, John D’Souza and Giulio Flore
Ipsos MORI
This research report was commissioned before the new UK Government took office on 11 May 2010. As a result the content may not reflect current
Government policy and may make reference to the Department for Children, Schools and Families (DCSF) which has now been replaced by the Department for Education (DFE).
Legal notice
© 2012 Ipsos MORI – all rights reserved.
The contents of this report constitute the sole and exclusive property of Ipsos MORI.
Ipsos MORI retains all right, title and interest, including without limitation copyright, in or to any Ipsos MORI trademarks, technologies, methodologies, products, analyses, software and know-how included or arising out of this report or used in connection with the preparation of this report. No license under any copyright is hereby granted or implied.
Contents
Executive Summary ... 8
1. Introduction... 21
1.1 Aims of the study... 21
1.2 Policy background ... 21
1.3 Times series of the Childcare and Early Years Survey of Parents ... 24
1.4 Overview of the study design ... 24
1.5 The report... 27
1.6 Acknowledgements ... 28
2. Use of childcare and early years provision ... 30
2.1 Introduction... 30
2.2 Use of childcare: trends over time... 30
2.3 National estimates of the use of childcare ... 33
2.4 Use of childcare, by children’s age, ethnicity and SEN ... 35
2.5 Use of childcare by families’ circumstances ... 38
2.6 Use of childcare by area characteristics ... 42
2.7 Key characteristics associated with the use of childcare ... 43
2.8 Hours of childcare used ... 45
2.9 Take-up of the entitlement to free early years provision... 49
2.10 Summary ... 55
3. Packages of childcare for pre-school children ... 57
3.1 Introduction... 57
3.2 Use of childcare packages by age of pre-school child... 58
3.3 Number of providers used for pre-school children ... 59
3.4 Patterns of childcare use for pre-school children... 61
3.5 Use of childcare packages for pre-school children at the family level ... 67
3.6 Reasons for using childcare providers for pre-school children ... 68
3.7 Summary ... 71
4. Packages of childcare for school-age children... 73
4.1 Introduction... 73
4.2 Use of childcare by age of school-age children ... 73
4.3 Number of providers used for school-age children ... 75
4.4 Patterns of childcare use for school-age children ... 77
4.5 Use of childcare packages for school-age children at family-level ... 79
4.6 Reasons for using childcare providers for school-age children ... 80
4.7 Summary ... 83
5. Paying for Childcare... 85
5.1 Introduction... 85
5.2 Family payments for childcare ... 86
5.3 Financial help with childcare costs... 96
5.4 How many families reported receiving tax credits?... 98
5.5 How much tax credit were families receiving? ... 98
5.6 Difficulties with childcare costs... 99
5.7 Summary ... 100
6. Factors affecting decisions about childcare ... 102
6.1 Introduction... 102
6.2 Access to information about childcare ... 103
6.3 Perceptions of provision in the local area ... 108
6.4 Demand for childcare outside of school hours... 113
6.5 Reasons for not using any childcare in the last year ... 115
6.7 Parents of disabled children... 119
6.8 Perceptions of flexibility... 121
6.9 Summary ... 129
7. Parents’ views of their childcare and early years provision... 132
7.1 Introduction... 132
7.2 Reasons for choosing formal providers ... 132
7.3 Parents’ views on the skills encouraged by their main formal provider ... 138
7.4 Parents’ views on the feedback their provider offers ... 146
7.5 Home learning activities for children aged two to five... 150
7.6 Early Years Foundation Stage (EYFS) ... 156
7.7 Other services available at childcare providers ... 159
7.8 Summary ... 163
8. Use of childcare during school holidays ... 165
8.1 Introduction... 165
8.2 Families’ use of childcare during school holidays ... 166
8.3 Type of childcare during school holidays ... 168
8.4 Reasons for using holiday childcare ... 174
8.5 Paying for holiday childcare ... 178
8.6 Availability of holiday childcare ... 180
8.7 Parents’ views of childcare used during school holidays ... 183
8.8 Families who did not use holiday childcare... 185
8.9 Summary ... 186
9. Mothers, childcare and work ... 188
9.1 Introduction... 188
9.2 Overview of work patterns... 189
9.3 Transition into work ... 195
9.4 Transition from part-time to full-time work... 196
9.5 Influences on mothers’ decisions to go out to work ... 197
9.6 Ideal working arrangements... 205
9.7 Mothers and self-employment... 207
9.8 Mothers who study ... 208
9.9 Mothers who were not in paid employment ... 209
9.10 Summary ... 211
References ... 212
Appendix A Socio-demographic profile ... 213
Respondent characteristics... 213
Family characteristics... 215
Selected child characteristics... 217
Appendix B Technical Appendix ... 220
B.1 Background and history... 220
B.2 Questionnaire development... 220
B.3 Cognitive testing and piloting... 222
B.4 Sampling... 223
B.5 Contacting respondents... 225
B.6 Briefings... 225
B.7 The interview ... 225
B.8 Fieldwork response rates ... 225
B.9 Coding and editing of data... 228
B.10 Analysis and significance testing... 228
B.11 Provider checks ... 228
B.12 Weighting... 229
Tables
Table 2.1 Use of childcare providers, 2009-2010 ... 32
Table 2.2 National estimates of use of childcare ... 33
Table 2.3 Numbers of childcare providers and early years providers in maintained schools in 2010 ... 34
Table 2.4 Use of childcare providers, by age of child ... 36
Table 2.5 Use of childcare, by child characteristics ... 38
Table 2.6 Use of childcare, by family annual income... 41
Table 2.7 Use of childcare, by Government Office Region... 42
Table 2.8 Use of childcare, by rurality ... 43
Table 2.9 Hours of childcare used per week, by age of child ... 46
Table 2.10 Hours of childcare used per week, by provider type ... 47
Table 2.11 Receipt of the entitlement to free early years provision, by age of child ... 50
Table 2.12 Receipt of the entitlement to free early years provision, by family type and work status ... 51
Table 2.13 Reasons for receiving less than 15 free hours, by age of child... 53
Table 2.14 Number of days per week over which three- to four-year-olds received their entitlement to free early years provision, by age of child ... 54
Table 2.15 Use of childcare providers for three- to four-year-olds receiving their entitlement to free early years provision, by age of child ... 55
Table 3.1 Use of childcare packages for pre-school children, by age of child ... 58
Table 3.2 Number of providers, by age of child ... 59
Table 3.3 Number of providers, by package of childcare... 60
Table 3.4 Patterns of childcare use, by age of child ... 61
Table 3.5 Patterns of childcare use, by package of childcare... 62
Table 3.6 Patterns of childcare use by family type and work status ... 63
Table 3.7 Patterns of childcare use of nought- to two-year-olds and three- to four-year-olds by family type and work status ... 64
Table 3.8 Patterns of childcare use by family annual income and number of children ... 65
Table 3.9 Reasons for using childcare providers, by package of childcare ... 70
Table 3.10 Patterns of childcare use, by reasons for using childcare providers ... 71
Table 4.1 Use of childcare packages for school-age children, by age of child ... 74
Table 4.2 Number of providers, by age of child ... 75
Table 4.3 Number of providers, by package of childcare... 76
Table 4.4 Patterns of childcare use, by age of child ... 77
Table 4.5 Patterns of childcare use, by package of childcare... 78
Table 4.6 Reasons for using childcare providers, by package of childcare ... 82
Table 4.7 Patterns of childcare use, by reasons for using childcare providers ... 82
Table 5.1 Family payment for childcare, by provider type ... 87
Table 5.2 Services paid for, by type of provider paid... 89
Table 5.3 Weekly payment for childcare, by provider type ... 91
Table 5.4 Amount family paid per hour, by provider type ... 93
Table 5.5 Employer assistance with childcare costs... 97
Table 5.6 Receipt of Child Tax Credit and Working Tax Credit, 2004-2010 ... 98
Table 5.7 Working families’ receipt of Working Tax Credit ... 98
Table 6.1 Sources of information about childcare used in last year, by childcare use...104
Table 6.2 Helpfulness of main childcare information sources...105
Table 6.3 Level of information about childcare in local area, 2004-2010...107
Table 6.4 Parents’ reasons for not using before/ after-school clubs ...114
Table 6.5 Reasons for not using childcare in the last year ...115
Table 6.6 Availability of informal childcare...116
Table 6.7 Changes that would facilitate formal childcare use ...117
Table 6.8 Reasons for not using nursery education for children aged nought to two, by family type and work status ...118
Table 6.9 Reasons for not using nursery education for children aged nought to two, by childcare use...119
Table 6.10 Views on available provision for children with an illness/ disability ...120
Table 6.11 Parents’ views on training for childcare for children with illness/ disability...121
Table 6.12 The extent to which parents’ perceive their childcare arrangements as flexible ...122
Table 6.13 Times where parents would like childcare provision improving in order to meet their needs...124
Table 6.14 Changes to childcare provision that would make it better suited to parents’ needs...126
Table 6.15 Types of formal childcare provision that parents wanted to use/ use more of ...128
Table 7.1 Reasons for choosing main formal provider for pre-school children, by age of child ...133
Table 7.2 Reasons for choosing main formal provider for pre-school children, by provider type...134
Table 7.3 Reasons for choosing main formal provider for pre-school children, by family type and work status ...135
Table 7.4 Reasons for choosing formal provider for school-age children, by age of child ...136
Table 7.6 Reasons for choosing main formal provider for school-age children, by family type and work status ..138
Table 7.7 Academic skills encouraged at main provider for pre-school children, by provider type ...140
Table 7.8 How often children brought home books from provider to look at/ read with their parent ...141
Table 7.9 How often children brought home books from provider to look at/ read with their parent, by provider type ...142
Table 7.10 Social skills that parents believed were encouraged at their main formal provider, by age of child ....143
Table 7.11 Social skills encouraged at main provider for pre-school children, by provider type ...144
Table 7.12 Social skills encouraged at main provider for school-age children, by provider type ...145
Table 7.13 Method by which parents received feedback from their formal providers, by age of child ...146
Table 7.14 Method by which parents received feedback from their formal providers for pre-school children, by provider type...147
Table 7.15 Method by which parents received feedback from their formal providers for school-age children, by provider type...148
Table 7.16 How often parents spoke to provider staff about how their child was getting on, by age of child...149
Table 7.17 Frequency with which parents engage in home learning activities with their children...151
Table 7.18 Parents’ perspectives on the amount of learning and play activities they do with their child, by family type and work status ...152
Table 7.19 Factors which would increase time spent on learning and play activities, by family type and work status ...153
Table 7.20 Sources of information/ideas used about learning and play activities, by family type and work status ...154
Table 7.21 People/organisations contacted about child’s learning and development...155
Table 7.22 Level of knowledge about the Early Years Foundation Stage ...156
Table 7.23 Whether formal childcare provider has spoken to parent or provided them with information about the Early Years Foundation Stage...156
Table 7.24 To what extent attending a formal childcare provider helped the child with the following skills, by provider type...158
Table 7.25 Volume of information received from formal provider about child’s learning and development ...159
Table 7.26 Additional services available to parents at their main formal provider, by provider type ...160
Table 7.27 Additional services used by parents at their main formal provider, by provider type ...161
Table 7.28 Additional services parents would like to use at their main formal provider (if not currently available), by provider type...162
Table 8.1: Use of childcare during school holidays, 2008-2010 ...166
Table 8.2 Use of childcare during school holidays, by respondent work status ...167
Table 8.3 Use of childcare during school holidays compared with use of childcare during term-time ...168
Table 8.4 Use of childcare in term-time and school holidays...169
Table 8.5 Use of holiday childcare providers, by age of child ...170
Table 8.6 Use of holiday childcare, by child characteristics...171
Table 8.7 Use of childcare during school holidays in 2010 by family characteristics ...172
Table 8.8 Use of childcare during school holidays, by area characteristics ...173
Table 8.9 Parents’ reasons for using formal providers of holiday childcare, by provider type ...176
Table 8.10 Parents’ reasons for using informal providers of holiday childcare, by provider type...177
Table 8.11 Whether payment made for holiday childcare, by provider type ...178
Table 8.12 Relative use and payment of holiday childcare, by provider type ...178
Table 8.13 Amount paid for holiday childcare per day, by provider type ...179
Table 8.14 Hours of holiday childcare used per day, by provider type ...179
Table 8.15 Reasons for difficulties with arranging holiday childcare...181
Table 8.16 Reasons for difficulties with arranging holiday childcare, by rurality ...181
Table 8.17 Formal provider available for enough time during school holiday, by provider type...182
Table 8.18 Views of parents about childcare during school holidays, by use of holiday childcare...184
Table 8.19 Views of working parents on holiday childcare hours, by use of holiday childcare ...185
Table 8.20 Reasons for not using holiday childcare ...186
Table 9.1 Maternal employment, by family type ...190
Table 9.2 Atypical working hours, by family type ...190
Table 9.3 Atypical working hours, by mothers’ work status ...191
Table 9.4 Family employment, by family type...193
Table 9.5 Atypical working hours, by family type ...194
Table 9.6 Reasons for entering paid work, by family type ...195
Table 9.7 Reasons for moving from part-time to full-time work, by family type...196
Table 9.8 Childcare arrangements that helped mother to go out to work, by family type ...198
Table 9.9 Influences on mothers’ decisions to go out to work, by family type ...199
Table 9.10 Influences on mothers’ decisions to go out to work, by mothers’ highest qualification ...201
Table 9.11 Influences on mothers’ decisions to go out to work, by mothers’ socio-economic classification...203
Table 9.12 Views on ideal working arrangements, by family type ...206
Table 9.13 Childcare arrangements that help mothers to study, by family type ...208
Table 9.14 Reasons for not working, by family type ...210
Table A.2 Marital status ...214
Table A.3 Qualifications, by family type...214
Table A.4 Number of children in the household, by family type ...215
Table A.5 Number of pre-school and school-age children in the family, by family type ...215
Table A.6 Family annual income, by family type...216
Table A.7 Family work status...216
Table A.8 Tenure status, by family type ...217
Table A.9 Age of selected child, by family type ...217
Table A.10 Ethnicity of selected child, by family type ...218
Table A.11 Special educational needs or disabilities of selected child, by family type ...218
Table A.12 Government Office Region ...219
Table A.13 Area deprivation according to the Index of Multiple Deprivation...219
Table A.14 Rurality ...219
Table B.1 Impact of additional checks on changes in estimates of use of childcare providers...221
Table B.2 Survey response figures...227
Table B.3 Fieldwork response figures ...227
Table B.4 Classification of providers before and after provider checks ...229
Table B.5 Comparison of recipient-level population figures to weighted sample ...231
Table B.6 Comparison of child-level population figures to weighted sample ...232
Table B.7 Weighted distribution of variables used in household-level calibration...233
Table B.8 Weighted distribution of variables used in child-level calibration...234
Table B.9 Effective sample size and weighting efficiency...235
Table B.10 Confidence intervals for key estimates...235
Table C2.1 Use of childcare, by family characteristics ...236
Table C2.2 Use of childcare, by disability of selected child ...236
Table C2.3 Use of childcare, by family socio-economic classification and detailed family work status ...237
Table C2.4 Use of childcare providers, by family type and work status...238
Table C2.5 Use of childcare, by area deprivation ...238
Table C2.6 Logistic regression models for use of formal childcare...239
Table C2.7 Logistic regression models for use of informal childcare...240
Table C2.8 Hours of childcare used per week, by provider type and age...241
Table C2.9 Hours of any childcare used per week, by detailed family work status...241
Table C2.10 Hours of formal childcare used per week, by detailed family working status...242
Table C2.11 Hours of informal childcare used per week, by detailed family working status ...242
Table C2.12 Receipt of the entitlement to early years provision, by family annual income, ethnicity of child (grouped), Government Office Region and rurality...243
Table C2.13 Number of free hours per week, by age of child...244
Table C2.14 Logistic regression models for hours of formal childcare used...245
Table C2.15 Logistic regression models for hours of informal childcare used ...246
Table C2.16 Whether parents satisfied with the number of free hours, by age of child ...247
Table C3.1 Number of providers, by specific centre-based provider types...248
Table C3.2 Number of providers, by informal provider types...248
Table C3.3 Patterns of childcare use, by age of child and package of care ...249
Table C3.4 Hours of centre-based childcare received, by specific centre-based provider ...249
Table C3.5 Hours of informal childcare received, by informal provider types ...249
Table C3.6 Whether pre-school child attended more than one provider on the same day, by age of child ...250
Table C3.7 Childcare packages for families with pre-school children only, by number of children ...250
Table C3.8 Reason combinations given for using childcare providers, by age of child ...250
Table C3.9 Reasons for using childcare providers, by age of child ...251
Table C3.10 Reasons for using centre-based providers, by specific centre-based provider types...251
Table C4.1 Number of providers, by specific informal provider types...251
Table C4.2 Use of childcare providers, by age of child and package of care ...252
Table C4.3 Hours of informal childcare received, by specific informal provider types ...253
Table C4.4 Reason combinations given for using childcare providers, by age of child ...253
Table C4.5 Household childcare packages for families with school-age children only, by number of children...253
Table C4.6 Household childcare packages for families with pre-school and school-age children, by number of children...254
Table C4.7 Reasons for using childcare providers, by age of child ...254
Table C4.8 Reasons for using informal providers, by specific informal provider type...254
Table C5.1 Weekly payment for childcare, by service paid for ...255
Table C5.2 Weekly payment for childcare, by family characteristics ...256
Table C5.3 Weekly payment for childcare, by area characteristics ...257
Table C5.4 Difficulty paying for childcare, by family characteristics...258
Table C5.5 Difficulty paying for childcare, by weekly family payment (quintiles) ...259
Table C6.1 Main information sources, by family characteristics ...260
Table C6.2 Main information sources by family characteristics ...261
Table C6.4 Level of information about childcare, by family characteristics...262
Table C6.5 Perceptions of local childcare availability, 2004-2010 ...263
Table C6.6 Perceptions of local childcare availability, by family characteristics ...264
Table C6.7 Perceptions of local childcare availability, by area characteristics ...265
Table C6.8 Perceptions of local childcare quality, 2004-2010 ...265
Table C6.9 Perceptions of local childcare quality, by family characteristics ...266
Table C6.10 Perceptions of local childcare quality, by area characteristics ...267
Table C6.11 Perceptions of local childcare affordability, 2004-2010 ...267
Table C6.12 Perceptions of local childcare affordability, by family characteristics ...268
Table C6.13 Perceptions of local childcare affordability, by area characteristics...269
Table C6.14 Extent to which parents have problems finding childcare that is flexible enough to meet their needs, by family annual income ...270
Table C6.15 Extent to which parents have problems finding childcare that is flexible enough to meet their needs, by Government Office Region and rurality...271
Table C6.16 Extent to which parents are able to find term time childcare that fits in with their or their partner’s working hours, by family annual income...272
Table C6.17 Extent to which parents are able to find term time childcare that fits in with their or their partner’s working hours, by Government Office Region and rurality ...273
Table C6.18 Times where parents would like childcare provision improving in order to meet their needs, by area characteristics ...274
Table C6.19 Changes to childcare provision that would make it better suited to parents’ needs, by Government Office Region...275
Table C6.20 Changes to childcare provision that would make it better suited to parents’ needs, by rurality...276
Table C6.21 Types of formal childcare provision that parents would like to use/ use more of, by Government Office Region...277
Table C6.22 Types of formal childcare provision that parents would like to use/ use more of, by rurality ...278
Table C7.1 How often providers give parents information about the activities their children have taken part in, by age of child ...279
Table C7.2 Factors which parents believe would increase time spent on learning and play activities, by area deprivation...279
Table C7.3 Sources of information/ideas used about learning and play activities, by area deprivation...280
Table C7.4 People/organisations contacted about child’s learning and development, by area deprivation...280
Table C8.1 Parents’ reasons for using holiday childcare, by type of holiday childcare used ...281
Table C8.2 Ease/difficulty of arranging holiday childcare, by age of child ...281
Table C8.3 Ease/difficulty of arranging holiday childcare, by work status and income ...282
Table C8.4 Reasons for difficulties with arranging holiday childcare, by family type ...283
Table C8.5 Views of parents about childcare during school holiday, by work status ...284
Table C9.1 Changes in maternal employment, 1999-2010 ...285
Table C9.2 Whether usually working atypical hours caused problems with childcare, by family type ...285
Table C9.3 Childcare arrangements that helped mothers to go out to work, by mothers’ highest qualification ....286
Table C9.4 Childcare arrangements that helped mothers to go out to work, by mothers’ socio-economic classification ...287
Table C9.5 Views on ideal working arrangements, by mothers’ highest qualification...288
Table C9.6 Views on ideal working arrangements, by mothers’ socio-economic classification ...289
Executive Summary
This report provides the main findings of the 2010 survey in the Childcare and Early Years Survey of Parents series. The survey was funded by the Department for Education (DfE), and carried out by Ipsos MORI. The study has two key objectives. The first is to provide salient, up-to-date information on parents’ use of childcare and early years provision, and their views and experiences. The second is to continue the time series – which has now been running for over ten years – on issues covered throughout the survey series. With respect to both of these aims, the study aims to provide information to help monitor the progress of policies in the area of childcare and early years education.
Since the Coalition Government was formed in 2010 there have been a number of other policy initiatives, which are described in the policy document Supporting Families in the Foundation Years (DfE 2011). Addressing the recommendations of three independent policy reviews for Government1, the document outlines plans to reform the Early Years Foundation Stage; retain a national network of Sure Start Children’s Centres and consult on a new core purpose; extend free early education to 40 per cent of two-year-olds; revise statutory guidance to increase the flexibility of free early education for three- and four-year-olds; and promote quality and diversity across the early education and childcare sector.
The report describes in detail what childcare is used by different types of families, changes in take-up over the years, parents’ reasons for using or not using childcare and for choosing particular providers, and parents’ views on the providers they used and on childcare provision in their local area in general.
Key Findings
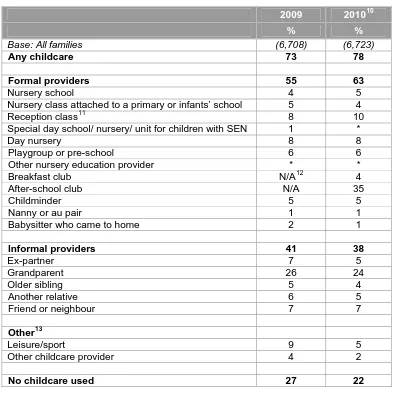
• In 2010 nearly four-fifths (78%) of all families in England with children aged under 15 had used some form of childcare; this equated to 4,154,000 families or 5,725,000 children. Sixty-three per cent had used formalchildcare and/or early years provision and 38 per cent had used informal childcare.
• An increase in the use of formal childcare was recorded between 2009 and 2010 (55% to 63%), however, this was largely attributed to alterations to the 2010 questionnaire that were made to capture use of breakfast and after-school clubs/activities separately; in 2009 they were conflated. No change in the level of formal childcare use is shown between 2009 and 2010 when excluding the use of breakfast and after-school clubs/activities from analyses.
• There was a small but significant decrease in use of informal childcare (41% to 38%). No significant change in level of use occurred for any other informal or formal
provider type.
• Significant differences in levels of formal childcare use were found when looking at certain characteristics (and remained significant when analysed alongside a range of other factors in regression analysis):
1
HM Government (2010) Preventing poor children becoming poor adults. The report of the Independent Review on Poverty and Life Chances by Frank Field. Cabinet Office: London.
HM Government (2011) Early Intervention: The Next Steps and Early Intervention: Smart Investment, Massive Savings. Two Independent Reports by Graham Allen MP. Cabinet Office: London.
o Age: receipt of formal childcare was most common among three- and four-year-olds (84%) and receipt of informal care was most common among those aged two years or under (33%)
o Family circumstances: children in couple families, working families and higher income families were all more likely to receive formal childcare than lone parents, workless families or low-income families.
• Take-up of formal childcare also differed significantly by other characteristics (ethnicity, region, deprivation, and rurality) but these were not significant when analysed alongside other factors in regression analysis.
• Children with special educational needs and disabilities were as likely to receive formal and informal childcare as those without.
• Reported take-up of free early education for three- and four-year-olds (85%) did not significantly change between 2009 and 2010. Statistics from DfE censuses of providers show that receipt of ‘some free early education’ as higher (95% for both 2009 and 2010).
• The vast majority (93%) of parents using the entitlement were fairly or very satisfied with the number of free hours they received.
• Median amounts paid for formal childcare varied by provider type (£20 per week overall). Parents paid the most in London (£31 per week) and the least in the North East and South West (both £15 per week). Overall parents living in the most deprived areas paid significantly less.
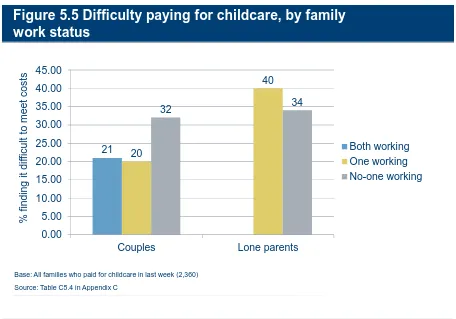
• A considerable minority (25%) said it was difficult or very difficult to pay for childcare (mainly lone mothers and workless families) but just over half thought it was easy or very easy to pay (51%).
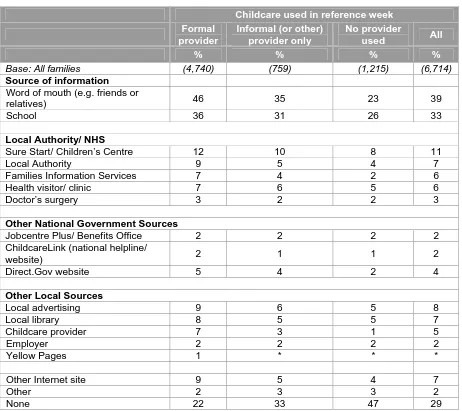
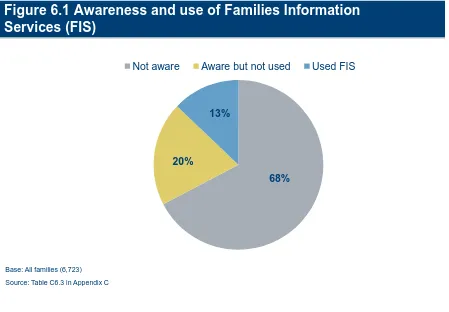
• Information about formal childcare was mostly accessed via friends and relatives (46%) followed by school (36%). Relatively few parents accessed government, local government or other local sources of information (for example 7% accessed
information from Families Information Services).
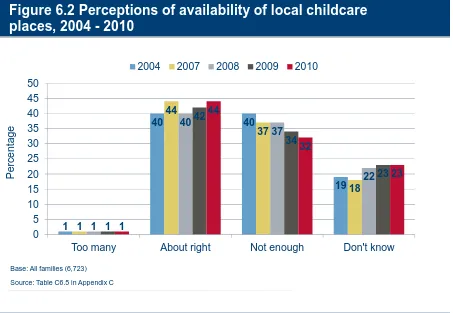
• Parents’ perceptions of childcare availability were mixed with 44 per cent saying that there were the right amount of places and 32 per cent saying there were not enough (no change from 2009).
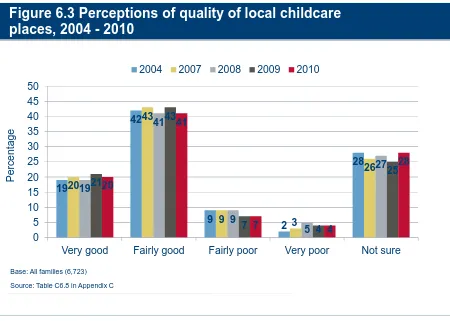
• Perceptions of childcare quality were positive (61% saying ‘fairly good’ or ‘very good’) (no change from 2009).
• Less than half (40%) of parents with disabled children thought that local childcare providers could cater for their child’s illness or disability.
• Three-quarters (75%) of parents with children aged two to five years old had heard of the Early Years Foundation Stage (EYFS) and over half of parents knew something about it (56%); one-quarter of parents were not aware of it.
• Eighty-six per cent of parents with children aged two to five years looked at books or read stories with their children ‘every day or most days’.
to 30%). Overall, around one in five (21%) found it difficult or very difficult to arrange childcare during school holidays.
• Just over half of non-working mothers said that they would prefer to work if they could arrange reliable, convenient, affordable, and good quality childcare.
Methodology
Just over 6,700 parents in England with children under 15 were interviewed for the study between September 2010 and April 2011. The sample of parents was ultimately derived using Child Benefit records which given its almost universal take-up, provide a
comprehensive sampling frame for families with dependent children.
To maintain comparability with earlier surveys in the series, we limited the children’s age range to under 15. In order to have sufficient numbers of children attending early years provision to enable separate analysis of this group, the proportion of two- to four-year-olds was boosted by increasing their probability of selection.
Interviews were conducted face-to-face in parents’ homes and lasted around three-quarters of an hour, as in 2009. Following the model of previous surveys in the series, the study used a very inclusive definition of childcare and early years provision. Parents were asked to include any time that their child was not with resident parents, or their current partner, or at school. Hence this covered informal childcare, such as grandparents, as well as formal childcare and early years education. For school-age children, the definition of childcare covered time they spent attending before- and after-school activities.
Among all those selected and eligible for interview (in other words excluding families who did not have a child aged under 15) 57 per cent of parents were interviewed, an increase in the response rate from 52 per cent in 2009. For further details on response see Appendix B.
Use of childcare and early years provision
Changes to the way questions about the use of childcare providers were asked in 2010 mean that comparisons with previous years’ estimates of childcare use will not, strictly speaking, be valid, as the additional prompts introduced would be expected to result in higher proportions of families reporting that they used childcare. Bearing these changes in mind, the 2010 results suggest that the use of informal childcare by families in England has fallen slightly since 2009. Families’ use of formal childcare appears to have increased, but analysis suggests this was driven by a questionnaire change. When the effect of this change (affecting measures relating to breakfast and after-school clubs) was excluded from analysis, there was no significant change in families’ use of formal childcare between 2009 and 2010. The patterns of childcare use by types of provider appear similar, with after-school clubs being the most common type of formal childcare provision overall, and grandparents the most common informal provision.
Children from South Asian backgrounds were less likely than those from a White British background to be in formal childcare, and these differences held even after controlling for other individual characteristics, such as the age of the child, and family characteristics (e.g. working status and family income). Children from working families, and from higher income families, were more likely to be in receipt of formal childcare than those from non-working, and lower income families. These relationships held when controlling for other factors.
Turning to informal childcare, after controlling for other factors, family work status, number of children, age and ethnicity of child were independently associated with families’ use of formal childcare.
Children who received childcare spent an average of 8.3 hours there (median figure). This is significantly lower than the 2009 figure of 10.8 hours. The median amount of free entitlement hours received by three- and four-year-olds was 15 hours.
Pre-school children spent much longer in childcare than school-age children, reflecting the fact that school-age children spent most of their day at school whereas early years education is counted here as formal childcare provision. Looking at the time children spent at different providers, children in reception class spent on average 31.3 hours per week there, while children attending after-school clubs did so for an average of 2.2 hours per week. Turning to informal provision, children looked after by their non-resident parent spent 15.0 hours with them, those looked after by their grandparent(s) spent 5.7 hours with them, while children spent on average 3.0 hours being looked after by an older sibling, or by a friend or
neighbour.
Family type and work status, and age of child were the main factors independently
associated with above average use of formal childcare, although family annual income was also a factor. Family type and work status and age of child were the main factors
independently associated with above average use of informal childcare.
Reported receipt of free early education for three- and four-year-olds (85%) did not
significantly change between 2009 and 2010. (This is in keeping with the trend demonstrated by the DfE Early Years Census and Schools Census statistics which show that receipt of ‘some free early education’ was stable at 95% during 2009 and 2010.) There was no significant variation by family annual income or family work status. Awareness of the free entitlement to early education was relatively low among parents who were not using it (52%, similar to 2009).
Packages of childcare for pre-school children
This chapter looked at parents’ use of different types or packages of childcare for their pre-school children during term-time. Three types or packages of childcare were most commonly used for pre-school children: formal centre-based childcare only (30%) (e.g. nursery classes, day nurseries); a combination of formal centre-based and informal childcare (18%); or
informal childcare only (e.g. ex-partners or grandparents) (13%). Twenty-four per cent of pre-school children were not in childcare at all.
Use of centre-based provision was much more common among three- to four-year-olds than among those aged under two, reflecting the high take-up of their entitlement to free early years provision, and, possibly, parents’ inclination to look after young toddlers themselves. Accordingly, younger pre-school children were more likely than their older counterparts to be receiving informal childcare only (21% and 3% respectively).
Children receiving a combination of formal centre-based childcare and informal childcare (18% of all pre-school children) were clearly the heaviest users of childcare. While the great majority of pre-school children receiving only one type of childcare attended just one
provider, almost one quarter (24%) of those receiving a combination of childcare attended three or more (the equivalent figure for all children aged 0 to 14 was 1%). On average, these children received the most hours of childcare per week and per day, and attended on a greater number of days per week. They were also the most likely to have both parents in work (or their lone parent), and to attend childcare for economic reasons, illustrating that this heavy childcare use was commonly designed to cover parents’ working hours.
Families with one pre-school child only were more likely not to use childcare (17%) than families with two pre-school children only (11%) and families with three or more pre-school children only (13%). Families with three or more pre-school children were significantly more likely to use one of the three main mixed packages (56% used either formal centre-based or informal childcare, formal based only or parental childcare only, or formal centre-based/informal childcare or informal childcare only).
Fifty-nine per cent of pre-school children who attended childcare were doing so for economic reasons (e.g. to enable parents to work, look for work, or study); 60 per cent for child-related reasons (e.g. educational or social development, or because the child liked going there); and 23 per cent for reasons relating to parental time (e.g. so that parents could engage in
domestic activities, socialise, or look after children). While those aged under two were more likely to attend a provider for economic reasons (68% compared to 52% of three- to four-year-olds) and parental reasons (26% compared to 21%), three- to four-year-olds were more likely to attend for child-related reasons (75% compared to 42%). Across all pre-school children, child-related reasons were associated with formal centre-based childcare, and parental time reasons with informal childcare.
Packages of childcare for school-age children
This chapter looked at parents’ use of different types and packages of childcare for their age children, during term-time, outside school hours. Thirty-five per cent of school-age children were not in childcare. Twenty-four per cent were in formal out-of-school childcare only and 14 per cent in informal childcare only. Thirteen per cent were in both formal out-of-school and informal childcare. No other particular type or package of childcare (e.g. centre-based or a leisure-based activity such as a football club) was received by more than two per cent of school-age children.
The likelihood that school-age children were receiving informal childcare only varied across each of the three age groups. Children aged 8 to 11 were significantly more likely than both older and younger school-age children to attend formal out-of-schoolchildcare, either on its own or in combination with informal childcare. Five- to seven-year-olds received a wider range of childcare packages than older school-age children (attributable at least in part to their greater use of reception classes and childminders).
Childcare was received from a single provider for almost two in three (65%) school-age children attending formal out-of-schoolchildcare only; this was also the case for four in five (80%) school-age children receiving informal childcare only. In contrast, three or more providers were attended by 44 per cent of those receiving a combination of formal out-of-school and informal childcare.
those in a combination of formal out-of-school and informal childcare (2.5 hours on average, compared to 6.0 and 7.0 hours respectively). Those receiving a combination of formal out-of-school and informal childcare tended to attend some childcare on a greater number of days of the week.
Looking at packages of childcare at the family level among families with school-age children only, 28 per cent used no childcare at all, 35 per cent used one of the two most common packages of childcare for every child (informal childcare or formal out-of-school childcare only), and 37 per cent used other arrangements. Turning to packages of childcare among families with both pre-school and school-age children, there was much more variation in arrangements. Only 12 per cent did not use childcare at all, and only six per cent used the one of the two most common packages for all their children. Eighty-two per cent used some other arrangement.
Forty-three per cent of school-age children who were in childcare attended for economic reasons (e.g. to enable parents to work, look for work, or study); 59 per cent for child-related reasons (e.g. for educational or social development, or because the child liked going there); and 15 per cent for reasons relating to parental time (e.g. so that parents could engage in domestic activities, socialise, or look after other children). Children in formal out-of-school childcare only were less likely than the other groups to be attending a provider for economic reasons, reflecting the fact that these children received only a small amount of childcare each week, and were most commonly there for child-related reasons. Children in a combination of formal out-of-school and informal childcare were the most likely to be attending a provider for economic reasons, indicating that, even once they start full-time school, a package of childcare can still be required to cover parents’ working hours. For school-age children, receipt of formal out-of-school childcare was mostly associated with child-related reasons and informal childcare was most likely to be associated with reasons relating to parental time.
Paying for childcare
A major finding from earlier years of the Childcare and Early Years Survey series was that whilst most, if not all, parents appear to be able to talk confidently about money they paid out ‘of their own pocket’, they were often less clear about the details of the financial help they received from others or through tax credits2.
Overall, 57 per cent of families who used childcare in the reference week reported that they had paid for some or all of that childcare. More families paid formal providers (63%) than informal providers, although a small proportion of families who used relatives and friends did pay them (6%). There were significant decreases in the proportions of parents paying for nursery schools between 2009 and 2010 (from 68% to 56%) and playgroups (from 68% to 60%).
There were wide variations in the overall median weekly amount paid by families depending on their circumstances and which providers they used. The median weekly amount paid to providers was £20. While there were some differences in the costs paid by different types of families and families living in different areas of the country, most differences appear to be accounted for by the ages of the children and different patterns of childcare use. Families paid the most for day nurseries that offered childcare for a full day3.
Between 2008 and 2010 there were significant increases in the mean weekly payment for nursery schools (£43 to £70), playgroups (£14 to £28), childminders (£59 to £79), and
2
For a full description of these issues see section 5.2 in Department for Children, Schools and Families (2009) Childcare and Early Years Survey of Parents 2008 by Speight et al.
3
babysitters (£21 to £39). Data from The Childcare and Early Years Provider Survey 2010 show that most providers (88%) said in 2010 that they had increased their fees in the previous two years.
Sixty-nine percent of families received Child Tax Credit, 41 percent on its own and 28 per cent with Working Tax Credit (WTC)4. Families receiving WTC and Child Tax Credit received a median of £117 per week, whereas families receiving Child Tax Credit only received a median of £41 per week.
Lone parents and low income families were most likely to say they struggled with their childcare costs. There has been a significant increase in the mean weekly payment made by families with annual incomes of under £10,000 between 2008 (£15) and 2010 (£26).
However, there were no other significant changes in the mean weekly payment by income group between 2008 and 2010, and no significant changes between 2009 and 2010.
Overall, 25 per cent of families paying for childcare found it difficult or very difficult to meet their childcare costs (no significant change from 2009). However, half said it was easy or very easy to pay for their childcare.
Factors affecting decisions about childcare
Seventy-one per cent of parents have used one or more sources of information about childcare in the last year (a significant increase from 63% in 2009). Over one-quarter (29%) accessed no information at all.
The most popular sources were those which parents were likely to encounter regularly such as friends or relatives (word of mouth) and school (39% and 33% respectively). A significant minority of parents used a variety of other information sources including Sure Start/Children’s Centres (11%), local advertising (8%), local authorities (7%), local libraries (7%) and health visitors (6%). Families Information Services (FIS) were familiar to 32 per cent of parents, and 13 per cent had previously used them.
The utilisation of particular information sources was significantly influenced by the type of childcare provider parents used. Parents with a formal childcare provider were much more likely to have accessed information than those using no childcare (78% compared to 53%). Consequently, groups with lower rates of formal childcare usage were less likely to access information about childcare. Low income families were less likely than higher income families to get information from word of mouth and schools but were more likely to access information from Sure Start/Children’s Centres and the Jobcentre Plus. Thirty-eight per cent of parents stated that they have too little information about childcare, though this was also affected by family characteristics. After controlling for childcare use and other factors, families less likely to say they had the right amount of information about childcare were those using informal childcare only or no childcare, those with an annual income of under £20,000, those with school-age children only, and those living in urban areas.
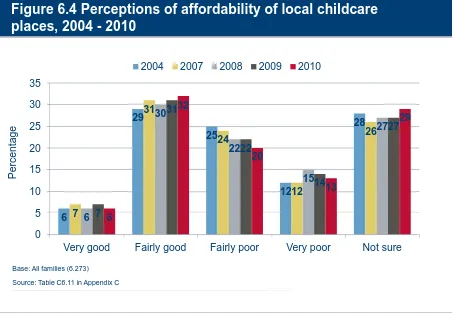
As might be expected, groups with lower formal childcare usage were also more likely to report that they were unsure about the availability, quality and affordability of childcare in the local area. Just under one third of parents believed that there were not enough childcare places in their local area (32%) and a similar proportion believed that childcare affordability was fairly or very poor (33%). Parents were more positive about the quality of local childcare with just 11 per cent reporting it as very or fairly poor (61% perceived it to be good).
4
Since 2004, there has been a significant increase in the proportion of parents saying the number of childcare places is about right (44% compared to 40% in 2004), with a decline in the proportion of parents reporting there are not enough childcare places (32% compared with 40% in 2004). There has been a significant increase in the proportion of parents who were unsure (23% compared to 19% in 2004). The proportion of families assessing the affordability of childcare as good has significantly increased since 2004 (from 35% to 38%) with a significant decrease in those rating it as poor (from 37% to 33%). Ratings of the quality of childcare have not significantly changed since 2004.
There has been no significant change in opinion about the availability, quality and affordability of childcare since 2009. There was no significant variation in perceptions of availability or affordability between families with one or more parents working atypical hours, other working families and other workless families. Multivariate regressions showed that whether a selected child had SEN was most strongly associated with parents feeling that there was not the right amount of childcare available in their local area, or that it was not good quality.
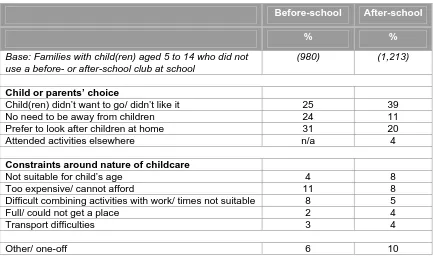
We also explored why parents did not use particular types of childcare. The majority of parents of 5- to 14-year-olds who did not use a breakfast or after-school club in the reference week had this service available to them but chose not to use it. The most common reasons provided for not using both before-school and after-school clubs were that parents preferred to look after their children at home (31%), their children did not wish to attend (25%), and because parents had no need to be away from their child (24%). Eleven per cent of parents suggested that they did not use before-school clubs specifically because it was too
expensive. Therefore, for the majority of parents, not using such clubs seems to be due to choice rather than any particular constraint.
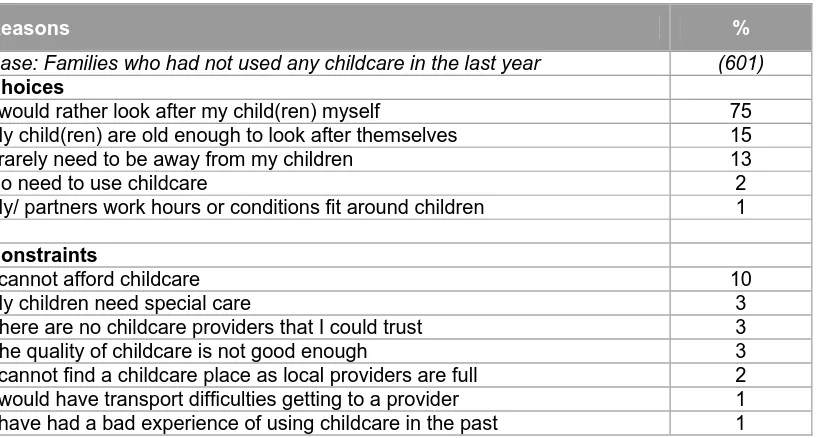
Just under one quarter (22%) of parents of children aged 0 to 14 reported that they had not used any childcare or nursery education in the last year. For the majority of parents, the main reason for this was because they preferred to look after their children themselves (75%). Having children old enough to look after themselves and rarely being away from their children were also reasons suggested by a significant minority of parents (15% and 13% respectively). A further ten per cent stated that they had been unable to afford childcare in the last year. Again, this suggests not using childcare was predominantly down to choice rather than a particular constraint.
Looking at informal childcare, 73 per cent of parents were able to use it as a one-off, and 47 per cent on a regular basis, with grandparents and other relatives the providers of informal childcare most likely to be available for parents to turn to. This suggests that the majority of parents who did not normally use childcare could find alternative forms of childcare
elsewhere, at least on an infrequent basis. When parents who had not used formal childcare in the last year were asked if any factors would encourage them to start using it, 11 per cent reported that affordability was a factor. However, for the majority there were no relevant factors with 81 per cent reporting that they did not need to use childcare.
More than half of parents with children aged under two had not used nursery education in the reference week (53%), and for the majority this was again down to personal choice. The most common reasons for not using nursery education were that parents felt their child was too young (57%) and because of personal preference (30%). The most frequently cited constraints preventing nursery education from being used were affordability (17%) and availability of places (9%).
daily life. Whilst these children were as likely as other children to use childcare in the
reference week, a significant proportion of parents felt that childcare in their local area did not meet their needs. Under half (40%) of parents believed there were local childcare providers that could cater for their child’s illness or disability (no significant change from 2009), and 34 per cent felt that providers were available at times to fit around their other daily commitments. In addition, 40 per cent of parents reported that they found it difficult to find out about suitable childcare providers in their local area. However, 52 per cent found it easy to travel to the nearest childcare provider that could accommodate their child.
For the first time in the Childcare and Early Years Survey of Parents series, respondents were asked about their perspectives on the flexibility of childcare. Only a minority (22%) reported they had problems finding childcare that was flexible enough to fit their needs. A multivariate regression showed that families with pre-school children or both pre-school and school-age children, and families where the selected child had a SEN, were most strongly associated with problems finding flexible childcare.
A majority felt that they could fit childcare around their working hours (51%). Parents living in London were significantly less likely than parents from other regions to agree childcare was flexible enough to meet their needs.
The most commonly cited periods where parents feel childcare provision could be improved were the summer holidays (64%), half-term holidays (33%), Easter holidays and weekdays during term time (31%). Furthermore, family annual income, the region where parents reside, and rurality, had a significant influence on the times when parents required improved
childcare.
Forty per cent of parents did not require any changes to their childcare provision to make it more suited to their needs. However, the most frequently cited changes were more
affordable childcare (32%), childcare available during school holidays (18%) and more information about what childcare is available (17%). Parents in low income families (annual income under £10,000) were more likely to be concerned with the cost and accessibility of childcare than those in high income families (£45,000 or more) for whom the times that childcare was available and flexibility were more significant concerns. In addition, parents in urban areas were more likely than those in rural areas to mention several changes and parents from London and the South East were more likely than those from other regions to cite several ways in which childcare could be better suited to their needs.
The majority of parents were happy with their current childcare arrangements and did not wish to use, or increase their use of, a particular provider (59%), though after-school clubs and holiday clubs or schemes were the most frequently cited providers that parents would like to use more of (19% and 15% respectively). Again, parents’ views were influenced by their household income and those in rural areas were significantly more likely to report that they were happy with their childcare arrangements than those in urban areas (64%
compared to 58%).
Parents’ views of their childcare and early years provision
Parents using formal childcare were likely to choose a childcare provider because of the provider’s reputation and convenience. This was the case for parents of both pre-school and school-age children. However, parents were also significantly more likely to select a
that they selected a provider in accordance with their child’s preference, the highest proportion selecting this reason across all age groups.
Some reasons for choosing a provider were more relevant to particular types of childcare providers than others. Regardless of the age of the child, parents who used a childminder as their main formal provider were likely to say this was because of concerns with the nature of care given and trust. Parents using nurseries, day nurseries and playgroups primarily
considered the reputation of the provider. Finally, breakfast clubs were chosen by parents of school-age children because they were convenient (62%), whilst it appeared to be the social aspect of after-school clubs that made them attractive (37%).
The vast majority of parents agreed that their provider helped their child to develop academic skills, for example enjoying books and recognising letters, words, numbers or shapes. Whilst all formal group providers ranked highly in this regard, as with the 2009 survey, parents felt that reception classes were the most likely to develop all of the skills listed, and childminders the least. More than half of parents of children aged three to four (57%) reported that their child brought home books to read at least once a week. There was significant variation by provider type, parents who chose reception classes as their main provider were least likely to say their child never brought books home. Over three-quarters of parents reported that their main formal provider encouraged playing with other children (84%), good behaviour (80%), and listening to others and adults (77%). Around sixty percent of parents said their provider encouraged expressing thoughts and feelings (62%) and tackling everyday tasks (59%).
The most common method by which parents received feedback from their formal providers was talking to staff (85%) and seeing pictures, drawings and other things their child brought home (51%). Over half of parents of school-age children received verbal feedback (79%) but less than half received any other form of feedback. Parents of pre-school children were more likely to receive feedback in a variety of ways, with over half reporting that they received feedback in each of five different ways. Most parents received feedback about how their child was getting on at least weekly, with 38 per cent receiving feedback each day or most days.
Parents engaged in a number of home learning activities with their child. The most frequently undertaken were looking at books and reciting nursery rhymes, which 86 per cent and 73 per cent of parents did each day or most days. Painting and drawing and using a computer happened less often, as did visiting the library with 40 per cent of parents saying they had never done this. More than two-thirds of parents (65%) believed they spent the right amount of time on learning and play activities though one-third (35%) would also like to do more. The main sources of information about activities used by parents were friends and relatives (61%) and other parents (44%), though media sources also rated highly with 38 per cent of parents taking ideas from children’s TV programmes and 32 per cent using the internet. Around one in five (21%) used Sure Start/Children’s Centres, and one in eight (12%) used
Children’s/Family Information Services as sources of information.
Three-quarters of parents of two- to five-year-olds had heard of the Early Years Foundation Stage (EYFS), over half claimed to know something about it, but only one in five claimed to know a lot. Most of those aware of EYFS had spoken to their provider about EYFS or received information about EYFS from their provider.
Use of childcare during school holidays
Less than half of families with school-age children used childcare in the school holidays (45%, compared to 77% in term-time) and they were more likely to use informal providers than formal providers (30% and 22% respectively). This pattern is consistent with the findings from 2008 and 2009, although usage of holiday childcare has decreased since 2009 when 51 per cent of parents used it.
There was a significant decrease in the use of informal holiday childcare in 2010 compared with 2009, but no significant change in the use of formal holiday childcare. Significant decreases in the use of grandparents and older siblings explain the overall decrease in the use of informal holiday childcare.
There were some notable differences between families’ use of childcare in term-time and the school holidays. Just under half (49%) of families using childcare during term-time used no childcare during the school holidays; and where families used no childcare during term-time 23 per cent used some holiday childcare. Holiday clubs and schemes were the most
common form of formal childcare in the holidays (8%). In terms of informal carers,
grandparents played an equally important role in providing childcare during school holidays (16% of children received childcare from grandparents in the holidays) as they did during term-time (15%). This pattern is consistent with the 2009 results.
Use of formal childcare during school holidays varied by children’s characteristics and their families’ circumstances. Those less likely to receive formal holiday childcare included: older school-age children (in other words those aged 12 to 14), children from Asian and Black African backgrounds, children from non-working families, children in lower income families and children living in deprived areas. These differences are consistent with those reported in the 2009.
Sixty-three per cent of parents used holiday childcare for economic reasons (such as working longer hours), 59 per cent of parents for reasons relating to child development or enjoyment, and 14 per cent of parents for reasons relating to how the holiday provision gave them time to do other things (e.g. shop, attend appointments). Parents’ reasons for using holiday childcare varied depending on the types of providers used. For example, child development and enjoyment tended to be more important when using holiday schemes and after-school clubs, while economic reasons played a more important role where parents used
childminders. All types of informal provider (except ex-partner) were primarily used for economic reasons. In families where ex-partners provided childcare this was mainly for children’s enjoyment and/or development.
Most parents were paying formal providers for holiday childcare (between 57% and 86% when looking at different provider types), while few were paying for informal holiday childcare (between 4% and 8%). This is consistent with the findings on paying for childcare during term-time. During holidays parents spent the most money on childminders (a median of £25 per day) andleastfor after-school clubs (a median of £10.47 per day). Holiday clubs cost on average £15.00 per day.
Just under two-thirds of parents of school-age children who worked in school holidays thought that childcare was easy or very easy to arrange. However 21 per cent thought that it was difficult or very difficult. Lone parents were more likely to report difficulties than couple parents. Not having family or friends available to help with childcare was the biggest
Parents views on the quality, flexibility and affordability of holiday childcare were mixed – over half (56%) of parents said that they were happy with the quality of holiday childcare available. However, 29 per cent reported difficulties finding childcare that they could afford during the school holidays, 21 per cent reported having problems finding holiday childcare that was flexible enough to meet their needs, and 15 per cent were unhappy with the quality of childcare available. Lack of flexibility and the affordability of available holiday provision caused more difficulties for lone parents than couple parents. A substantial minority of parents also indicated that the availability and affordability of holiday childcare impacted on their capacity to work more hours.
Lastly, focusing on families who did not use holiday childcare, 43 per cent said they would be likely to use childcare in the holidays if it was available. Where parents used formal providers during term-time but not in the holidays, over half (53%) said that their providers were not available during the holidays. These figures suggest that there was a considerable level of unmet demand for holiday provision amongst those families who used formal childcare during term-time but not in the holidays. This might be met though term-time formal providers remaining open for business during the holiday periods.
Mothers, childcare and work
The level of maternal employment has been broadly stable over the last few years, following increases around the turn of the century with the expansion of free childcare and introduction of tax credits. This is despite a small increase in unemployment among women aged 16-64 recorded by the LFS between the 2009 and 2010 surveys.
Atypical working (defined as usually working before 8am, after 6pm or at the weekends) was not particularly common, with 16 per cent usually working outside these usual office hours, most commonly in the evenings or on Saturdays. For a substantial minority of these mothers (20% to 27%), working atypical patterns caused difficulties with their childcare arrangements.
Among families as a whole, the most common pattern for couples was to have one partner in full-time employment, with the other in part-time employment (31%). Almost half of lone parents (49%) were workless, compared with seven per cent of couples. Around half of working families had a parent usually working atypical hours (51%). Just under one-third (31%) of lone parents usually worked atypical hours at least sometimes.
Finding a job that enabled mothers to combine work with childcare remained the most
common reason for entering work among those mothers who had entered employment in the past two years, and a job opportunity or promotion was the factor most likely to have
prompted a move from part-time to full-time work.
A range of factors enabled mothers to be in work, with having reliable childcare and the availability of informal childcare the most commonly reported factors among couples and lone parent families alike. Assistance with childcare costs through tax credits was important for a significant minority of lone mothers (17%).
Financial necessity, and an enjoyment of work, were the most commonly reported influences on mothers’ decisions to go out to work, and financial necessity was a more important
influence for lone mothers than for those in a couple. The availability of family-friendly work appeared to be less of an influence. Lone mothers were also more likely than partnered mothers to report that they would feel useless without a job.
substantial minority reporting that they would like to increase their working hours if they could secure reliable, affordable, good quality childcare (23%). Lone mothers, and those in routine and semi-routine occupations, were most likely to report that they would like to increase their hours.
Availability of reliable childcare, childcare provision from relatives, and children being at school were all important factors that allowed mothers to study.
1. Introduction
1.1 Aims of the study
This report provides the main findings of the 2010 survey in the Childcare and Early Years Survey of Parents series. The survey was funded by the Department for Education (DfE), and carried out by Ipsos MORI. The study has two key objectives. The first is to provide salient, up-to-date information on parents’ use of childcare and early years provision, and their views and experiences. The second is to continue the time series statistics – which have now been running for over ten years – on issues covered throughout the survey series. With respect to both of these aims, the study aims to provide information to help monitor the progress of policies in the area of childcare and early years education.
1.2 Policy background
Since the 1998 National Childcare Strategy (DfEE, 1998) there have been significant developments which have tended to increase the availability of childcare services, improve the quality of care and make services more affordable to parents. The strategy had the dual objectives of improving children’s outcomes through the provision of high quality early education, and supporting parents to enter paid employment, and thereby reduce child poverty. A further ten-year strategy was published in 2004 (HM Treasury 2004). The
objectives of this strategy were to create a sustainable framework for childcare provision and support to balance work and family life, with the aim of improving the choice, availability, quality and affordability of childcare. An update was published in 2009 (HM Government 2009).
Since the Coalition Government was formed in 2010 there have been a number of other policy initiatives, which are described in the policy document Supporting Families in the Foundation Years (DfE 2011). Addressing the recommendations of three independent policy reviews for Government5, the document outlines plans to reform the Early Years Foundation Stage; retain a national network of Sure Start Children’s Centres and consult on a new core purpose; extend free early education to 40 per cent of two-year-olds; revise statutory guidance to increase the flexibility of free early education for three- and four-year-olds; and promote quality and diversity across the early education and childcare sector.
The childcare system in England is a mixed economy, with services provided by the public, private, voluntary and independent sectors. It is a well-regulated sector and most providers must register with and be inspected by the regulator Ofsted, although some providers do not have to register (e.g. those caring for children over the age of eight only, and those providing care in the home of the child).
The legislative framework is provided through the Childcare Act 2006 which enacted many of the provisions of the 2004 Strategy. Local authorities play a key role in the provision of childcare through ensuring there is sufficient provision for working families, administering free early education places, supporting the local childcare market through working with providers,
5
HM Government (2010) Preventing poor children becoming poor adults. The report of the Independent Review on Poverty and Life Chances by Frank Field. Cabinet Office: London.
HM Government (2011) Early Intervention: The Next Steps and Early Intervention: Smart Investment, Massive Savings. Two Independent Reports by Graham Allen MP. Cabinet Office: London.
and the provision of information to parents about their entitlements. Many also provide services directly and offer additional subsidies to certain groups of parents.
There is now a wide range of support for families seeking childcare. Since September 2010, when fieldwork for this survey began, all three- and four-year-old children have been entitled to 570 hours of free early education a year, accessed over a minimum of 38 weeks of the year (equating to 15 hours a week). This is largely delivered by nurseries and pre-schools, although some childminders also provide these places. New guidance in September 2010 made the offer more flexible by allowing parents to access the free hours over three days, rather than five days. During 2011 the Government consulted on allowing the offer to be taken over two days, with new guidance planned to be introduced in September 2012.
The Government is also extending free early education places to disadvantaged two-year-olds, with an aim to cover 20 per cent of the cohort by 2013 and 40 per cent by 2014 (DfE, 2012), following a number of pilots involving much smaller numbers of children. However, this policy had not been implemented during the fieldwork for the 2010 survey. At the time of writing the precise definition of disadvantage is yet to be announced, but the Government has indicated that the initial 20 per cent will be based on children who meet the criteria for free school meals (families are on out-of-work benefits or a low income), and looked-after children, with local discretion to include other children. The Government has yet to announce how the definition will change when 40 per cent of children are eligible.
Other Government support for childcare includes the means-tested childcare element of Working Tax Credit, through which parents working more than 16 hours per week can claim up to 70 per cent of their childcare costs. Between April 2006 and April 2011 the proportion of costs covered was 80 per cent, so during the fieldwork a higher level of support was available. Eligible costs are limited to £175 per week for one child and £300 per week for two or more children, figures which are unchanged since 2005. Between 2013 and 2017 Working Tax Credit, including the childcare element, will be merged with other benefits and tax credits to form a single payment called Universal Credit. The Government has announced that an additional £300 million will be invested so that families working less than 16 hours per week may also claim help with their childcare costs.
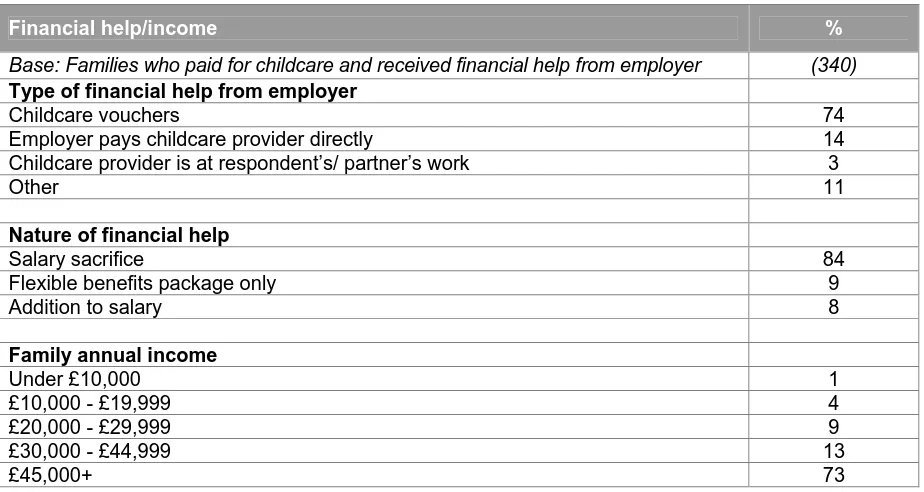
Working parents can also save up to £933 per year by using childcare vouchers to pay for their childcare. These are available from their employer in lieu of salary and are exempt from income tax and national insurance, resulting in a saving to both the employer and employee.
Children’s centres are