Disability, health and access to training
65
0
0
Full text
(2) About EMAR Employment Market Analysis and Research (EMAR) is a multi-disciplinary team of economists, social researchers and statisticians based in the Employment Relations Directorate of the Department for Business, Innovation and Skills. Our role is to provide the evidence base for good policy making in employment relations, labour market and equality and discrimination at work. We do this through: •. Conducting periodic benchmark surveys. •. Commissioning external research reports. •. Conducting in-house research and analysis. •. Assessing the regulatory impact of new employment laws. •. Monitoring and evaluating the impact of government policies. We publicly disseminate the results of this research through the BIS Employment Relations Research Series and other publications. For further details of EMAR's work, including PDF versions of all our publications, please see our web pages at:. www.berr.gov.uk/employment/research-evaluation. About this publication The project manager for this report was Jane Carr in the EMAR branch. Published in November 2009 by the Department for Business, Innovation and Skills. URN 09/1320 ISBN 978-0-85605-724-3 © Crown Copyright 2009 This report can be ordered at: www.bis.gov.uk/publications Click the ‘Browse by subject’ button, then select ‘Employment Relations Research’. Alternatively, call the BIS Publications Orderline on 0845 015 0010 (+44 845 015 0010) and quote the URN, or email them at: publications@bis.gsi.gov.uk. Electronic copies are available to download at: http://www.berr.gov.uk/employment/research-evaluation/errs/index.html Enquiries should be addressed to emar@bis.gsi.gov.uk or to: Employment Market Analysis and Research Department for Business, Innovation and Skills Bay 4107 1 Victoria Street London SW1H 0ET UNITED KINGDOM The views expressed in this report are the authors’ and do not necessarily reflect those of the Department or the Government..
(3) Acknowledgements The author acknowledges financial support from the Department for Business, Innovation and Skills. She is also grateful to Jane Carr, Emilia del Bono, Carlo Devillanova, Steve Pudney and seminar participants at ISER (University of Essex), University College London and University of Sheffield for helpful comments and suggestions.. ii.
(4) Contents Acknowledgements………………………………………………………………………i Contents………………………………………………………...………………………..ii Tables and Figures…………………………………………….........…………………iii Executive summary……………………………………………………………………..1 CHAPTER ONE: Introduction……………………………….…………………………3 CHAPTER TWO: Institutional and theoretical background…………………………5 2.1. Disability and training in the U.K………………………………………….5 2.2.Theoretical background…………………………………………………….6 2.3. Previous evidence………………………………………………………….7 CHAPTER THREE: Data and sample description…………………………..……..11 3.1. WERS 2004……………………………………...………………………..11 3.2. Selected sample…………………………………...……………………..12 3.3.Descriptive statistics………………………………………………………14 CHAPTER FOUR: Investing in human capital………………………………......…19 4.1. A two parts process………...…………………………………………….19 4.2. Explanatory variables and their expected coefficients…….………….20 CHAPTER FIVE: Empirical analysis………….………………………………......…25 5.1. Random intercepts and random coefficient models ………………….25 5.2. Estimating the two processes jointly …………………………………..31 5.3. Excess of zeros and double hurdle models………………….………..37 CHAPTER SIX: Concluding remarks .……….………………………………......…43 References……………………………………………………………………………..45 Annex A: Estimates of disability……………………………………………………...50 A.1.1. Estimates of disability according to different surveys in the UK…..50 A.1.2 WERS and my definition of disability…......………………………….54 Annex B: Supplementary tables……………………………….…………………….55. iii.
(5) Tables and Figures Tables Table 3.1: number of disabled people Table 3.2: Policies against discrimination Table 3.3: Proportion of trained workers Table 3.4: days of training Table 3.5: workers’ health status in private firms Table 4.1: Factor analysis for the variable describing the degree of discrimination against disabled Table 5.1: random intercept and random coefficient models Table 5.2: training incidence Table 5.3: training intensity Table 5.4: two parts models Table 5.5: double hurdle models Table A.1.: health status according to the LFS Table A.2: disabled people according to the LFS Table A.3: disabled people according to the BHPS (1) Table A.4: disabled people according to the BHPS (2) Table A.5: disabled people according to the BHPS (3) Table A.6: disabled people in WERS Table A2.1: training incidence (all the coefficients) Table A2.2: training intensity (all the coefficients) Table A2.3: training incidence (all the coefficients, two parts models) Table A2.4: training intensity (all the coefficients, two parts models). i.
(6) Figures Figure 3.1: proportion of trained workers by tenure Figure 3.2: number of days of training by tenure Figure 3.3: Proportion of trained workers by tenure and health status Figure 3.4: number of days of training by tenure and health status Figure 4.1: percentage of workers who left the firm in the year before the interview Figure 5.1: distribution of training Figure 5.2: distribution of training after Box Cox transformation. v.
(7) Executive summary Providing disabled people with adequate training is one of the main objectives of recent legislative measures against discrimination in the labour market for the UK. In fact, when affirmative policies make it difficult for the employers to discriminate in terms of pay levels, firms could use poor access to training to substitute low current wages with low future wages. Using the 2004 British Workplace Employee Relations Survey (WERS 2004), this paper analyses the determinants of training for disabled workers both at the individual and at the firm level. We argue that employers' decisions on training for disabled people are based on estimates of the severity of their impairment based on the available information. We find that being disabled decreases the probability of being trained, but it has a negligible effect on the length of training. We also find that workers' expected tenure influences the amount of the investment in human capital and that firms provide training by relying on hard-to-observe characteristics as long as new information is made available.. Aims and objectives The United Kingdom was one of the first countries in Europe to adopt measures to combat discrimination against disabled employees in the workplace. While most of the European countries started addressing the problem just after 2000 in line with a general European concern, the UK Disability Discrimination Act dates back to 1995. However, in spite of such an effort on the legislative side, discrimination against ill and disabled people at the workplace does not seem to be a rare behaviour in Great Britain as shown by recent studies aiming at assessing the degree of enforcement of disabled people’s rights (Grainger and Fitzner (2007), Casebourne et al (2006)) Unequal access to training for disabled people is a strategic issue to be addressed by policy makers, not only because it can hide a form of discrimination in future wages as stated by Lazear (1979), but also because it is can discourage participation of disabled people at the workplace. In line with such a need, the Disability Right Commission's agenda explicitly states among its key objectives “to enable disabled adults to renew and refresh their skills to gain employment and progress in their careers” (Disability Right Commission 2007). This paper studies the provision of training for disabled people by stressing the importance of the contextual factors defining the working environment where the disabled people are employed. This information is crucial to understand how the presence of an impairment can influence the process of investing in human capital and how the implementation of anti discrimination 1.
(8) policies can help to ensure equal opportunities for each worker regardless his health status.. Analysis and findings Using the cross section part of the 2004 Workplace Employment Relation Survey (WERS 2004) a new and interesting dataset of British firms matched with a sample of employees working in each establishment, the paper argues that when available information is scarce, ill-health is perceived as a characteristic signalling “risky” i.e. workers who are perceived to be more likely to drop out of the labour force, thus making the investment in human capital unprofitable. The statistical analysis is based on the idea that the process of investing in human capital can be divided in two parts the first one indicating whether the workers received training while the second part defining the actual amount of training he gets. In general, most of the model we apply lead to the conclusion that ill-health seems to be associated with a worse access to training while it does not seem to lead to a lower investment in human capital for the sub sample of trained workers. We believe it might be due to a lack of information such that the presence of a disability is perceived as a signal of a shorter expected tenure in the firm. In the last part of the paper, we try to take into account the factors determining no investment in human capital in the cases in which the workers are suitable for the training. This can be read as a situation in which the lack of information is reduced: we find that in such a scenario there is a separation between a group of disabled people who get more training than non disabled people and another group of disabled people which does not get training at all. We believe that our conclusions pose a challenge for policy makers who, on the one hand, must make it possible to each employee to declare his health status, on the other hand must set up a safety net aiming at preventing every form of discrimination against disabled people.. 2.
(9) CHAPTER ONE. Introduction 1.1 Motivation The United Kingdom was one of the first countries in Europe to adopt measures to combat discrimination against disabled employees in the workplace. While most of the European countries started addressing the problem just after 2000 in line with a general European concern, the UK Disability Discrimination Act dates back to 1995. Despite this early adoption, discrimination against ill and disabled people at the workplace does not seem to be a rare behaviour in Great Britain. A preliminary analysis by Grainger and Fitzner (2007) on the `first Fair Treatment at Work Survey' shows that long term illness and disability play a crucial role in explaining the episodes of unfair actions against employees. The authors point out that those having a long term illness or disability are twice as likely as other workers to have experienced unfair treatment in employment and a poor health condition is perceived by the respondents to be the first cause of discrimination. 1 Moreover, among the FTWS respondents who declared they were aware of a colleague at their workplace being treated unfairly, 3.8 per cent cite poor health conditions as reason for such an unfair treatment. Finally long term ill or disabled workers are also more likely to be victims of bulling and sexual harassment. It is worth noticing that FTWS shows that unfair treatment on the basis of long-term illness seems to be twice as common as for disability, showing that a more complex analysis should be carried out.. Such a disadvantage persists although, according to the Employment Rights at Work Survey 2005, (see Casebourne et al. (2006)), 92 per cent of employees are aware of their rights under disability discrimination law. However, the same survey shows that experiencing some forms of illness or disability increases the odds of having had a problem at work. 2 Dupre and Karjalainen (2003) point out that among European countries, only in Finland is the rate of reported disability over the total number of the working age population higher that the one for UK. Although such comparisons can be weakened by persistent cultural bias that affect reported disability (Banks et al. 1. Unfair treatment is self reported by the employees. Grainger and Fitzner (2007) argue that the definition of `unfair treatment' has been chosen because of its being as broad and allencompassing as possible. Such a definition does not necessarily imply discrimination 2 The most common `problems' experienced were related to pay, being informed through written contract and statements about the terms and conditions of the job, taking rest breaks at work, number of working hours and days.. 3.
(10) (2004)), the study shows that the conditions of disabled employees at work should be a matter of concern for the United Kingdom.. 1.2 Aim of the paper Using data from the 2004 British Workplace Employee Relations Survey, this paper studies the provision of training, with particular attention to the opportunities offered to people in poor health conditions. Although legislative bodies and human rights agencies are concerned about the possibility of unequal access to training for workers in poor health, the topic has not been directly addressed in the economic literature. The literature on human capital has largely studied the determinants of training, 3 but the role of health status in determining workers' probability of getting training has often been neglected. 4 Analogously, the literature studying the impact of disability on labour market outcomes has mainly focused on explaining low employment ratios among disabled employees and wage differentials between disabled and nondisabled.. 1.3 Summary The paper is divided as follows. Section 2 presents the institutional and legislative framework; section 3 and 4 discuss the theoretical background and the previous evidence; sections 5, 6, 7, 8 and 9 present the econometric specification and the results; section 10 concludes.. 3. for a review see Acemoglu and Pischke (1999) Becker (1964) observes health is one of the determinants of workers' productivity, but he explicitly admit that the analysis of investment in health is beyond the scope of his work. 4. 4.
(11) CHAPTER TWO. Institutional and theoretical background. 2.1 Disability and training in the UK. The most important piece of legislation in the United Kingdom dealing with the rights of disabled workers is the Disability Discrimination Act (DDA) introduced in 1995 and then updated thorough the following decade in response to the European legislation, as a consequence of the `Employment Equality Directive' (EU council directive 2000/78/EC). The DDA defines as `disabled' someone having or having had `a physical or mental impairment which has a substantial and long term adverse effect on his ability to carry out normal day-to-day activities'. In order to meet the definition of disability under the DDA, the person must show that one of the day-to-day activities adversely affected involves one of the following capacities: mobility, manual dexterity, physical coordination, continence, the lifting or moving of everyday objects, speech, hearing or eyesight, memory, concentration, learning or understanding and perception of risk and danger. `Long term illnesses' are commonly considered those having lasted or being likely to last at least for 12 months. Such a categorization potentially includes those impairments having intermittent although repeated nature. The DDA makes it unlawful for employers to discriminate against disabled employees for reasons related to their impairment, unless such discrimination can be justified. The DDA applies to recruitment and retention of employees, promotions and transfers, dismissals and training. It originally covered only employers having 20 or more employees but has been successively extended, first to employers of 15 or more employees (December 1998) and to all small firms (October 2004) and public bodies (2005). In addition, in April 2000 the Disability Rights Commission (DRC) was set up with the aim of assisting disabled people and establishing the extent to which the legislation applied. The role of the DRC has been recently subsumed into that of the Equality and Human Rights Commission (EHRC) which, however, does not prevent the commission from setting up specific goals for disabled people. The DRC's Disability Agenda explicitly states among its key objectives `to enable disabled adults to renew and refresh their skills to gain employment and progress in their careers' (disability right commission (2007)). In particular, it suggests the. 5.
(12) implementation of a `Skills Escalator' programme enabling disabled workers to increase their skills and gain higher skilled employment.. 2.2. Theoretical background There is a huge literature in economics studying the determinants of training and explaining why firms pay for it. The first piece of work analysing training as a form of investment in human capital is Becker (1964). There are two crucial features characterising the investment in human capital. The first one is that, unlike the investment in physical capital, investment in human capital is irreversible, since the skills imbedded in the workers cannot be sold in the market. Secondly, labour is a mobile production factor and it is almost impossible for the firms to retain those workers they have invested in. Moreover, when training is general, the returns of human capital can be enjoyed by future employers who do not bear the cost of the investment. As a consequence, firms must be very careful in evaluating workers' characteristics before undertaking the investment. In addition, for the firms to pay for training, there must be some frictions in the market preventing the workers to capture the whole returns to training. There are a few reasons explaining why disabled employees could be less likely to receive firm sponsored training. The first one is prejudice (Becker (1959)) arising if employers are biased against disabled employees. The second is imperfect information which could lead to statistic discrimination (Phelps (1972); Aigner and Cain (1977); Lang (1986); Cornell and Welch (1996); Lundberg and Starz (1983)). 5 The state of the available information is relevant since the future productivity of the workers is not known before the investment, but it can only be predicted on the basis of observed actions or observed characteristics. According to Spence's terminology (Spence (1973)) I will call the former `signals' and the latter `indices'. We can think that for disabled workers such a lack of information is even more pertinent, since the severity of the impairment can be rarely observed directly and it can often be assessed only by a professional. If the employer relates the presence of disability to a lower expected productivity, he can be less willing to offer firm sponsored training. Moreover, even if the employers are able to observe which workers have any impairment, they can hardly have a clear picture of their health status and of the consequences their condition might have on work related performances. In particular, even in the case where disabled employees have on average the same level of productivity as people in good health, we can reasonably suppose that the variance in their performance is higher than the one for non-disabled people. Oettinger (1996) observes that when workers' productivity can be evaluated only through a signal with known mean and variance, two different subgroups with the same expected productivity can be treated differently due to the difference in the variance of the returns of their work.. 5. for a comparison between the two groups see Arrow (1973) and Cain (1986). 6.
(13) For all the aforementioned reasons, it becomes interesting analysing the process through which the employers get information about employees' characteristics thus employees' suitability for training. Altonji and Pierret (2001) analyse employers' learning and how information affects the outcomes for different subgroups of employers. The authors argue that, when firms hire new workers, they discriminate among them on the basis of easily observed characteristics, while, after getting new pieces of information about the quality of the employees, they start relying on hard-to-observe characteristics. In fact, over time firms observe noisy signals of the workers' productivity, making the initial information superfluous. In particular, the paper points out that employers' beliefs about workers' productivity can influence the amount of training, thus affecting future wages. An important piece of information the firms must take into account in deciding their investment in human capital is the expected tenure of the workers. In fact, like any other form of investment, the cost of training must be counterbalanced by the stream of expected returns generated by the increase in the worker's productivity. The investment is worthy for the firms only if the increase in the productivity can be enjoyed for a period of time long enough to cover the cost of training. Kuhn (1993) sets up a model in which firms match employees having different degrees of labour market attachment with available jobs by involuntarily discriminating on the basis of demographic attributes. In particular, shared investments in firm specific training are offered mainly to those having a higher exogenous probability of remaining in the labour market in the period following the training. The centrality of the probability of leaving the firm becomes the rationale for the idea of `delayed training' (Loewenstein and Spletzer (1997)). The authors show that it can be preferable for employers delaying training in order to get better information on the `quality' of the workers. Such behaviour may be optimal for the firms because it makes it possible for the employers to provide training only to those workers who are less likely to leave the job. The importance of expected tenure of the workers is also discussed by Idson (1996) in order to explain why firm sponsored training is more frequent in large firms. The author argues that in large firms there is higher intra firm job mobility related to a longer duration of employment. Such a longer time horizon makes large firms more willing to provide training. Finally, Royalty (1996) estimates jobto-job and job-to-non employment probabilities as proxies for the estimated time horizon for the investment in human capital and she argues that workers differing in their labour attachment have different probabilities of receiving training. The latter set of models becomes even more interesting if applied to workers in bad health. In fact, on one hand we can think that disabled employees have a higher probability of leaving the firm since they have a high probability of dropping out of the labour force due to the impairments they have. On the other hand, people whose impairment is not severe can be less likely to leave the firms since they have worse outside options due to their difficulty in finding another. 7.
(14) suitable match. 6 For example, hiring a worker with an impairment can imply higher starting costs if disabled workers are able to perform a narrower range of tasks than non-disabled. This, for the former, makes the probability of mismatch to increases, thus making matching costs to rise. Moreover, hiring costs can rise due to the need of making workplace modifications to enable the disabled person to work. This type of costs allows the firm to capture part of the returns to training. (Acemoglu and Pischke (1998), Acemoglu (1997)) Finally, the firm decision strategy is affected by anti-discrimination policies. Lazear (1979) observes that when affirmative policies make it difficult for the firms to discriminate in terms of pecuniary wages, the employers try to substitute current wages with future wages. As a consequence, even where there is no difference in the current wages between subgroups, the difference in unobserved non pecuniary components of the wage tends to increase, since an unequal access to training can be viewed as an unequal access to future wage growth. My paper is based on the idea that there exist `safe' and `risky' forms of investment. I consider `safe' an investment which guarantees a long expected stream of future revenues. In line with that, I distinguish between `risky' and `safe' disabled workers on the basis of their probability of leaving the firm. The former have severe impairments, thus a high probability of dropping out of the labour force due to illness. The latter, whose disability is not severe, display higher matching and mobility costs and lower job-to-job mobility due to poor outside options. Since people's health condition is not completely observable, employers get only noisy signals of workers' quality. As a consequence, decisions on training for disabled employees are based on estimates of the severity of their impairment based on available information. It has been already pointed out that expected tenure is a key variable in understanding the determinants of training. In fact, the longer is the time horizon of the investment in human capital, the higher is the net present value of such an investment. We expect employers to provide training to disabled employees only when they can be reasonably sure they are not undertaking a risky investment. In other words, I argue that training is selectively provided only to those disabled employees who are likely to have a lower probability of leaving the job. If firms use Bayesian learning to make their choice, differences in the estimated future tenure between the two groups of disabled have further consequences. In fact, in a Bayesian setting, expectations about workers' probability of staying with the firms are based also on people's past job history. Hence, employers conclude that disabled employees who have been working in the same firm for long time must belong to the group of `safe' disabled, so they must have a low probability of leaving the firm.. 6. for a discussion of the impact of outside options on the probability of leaving the firm see Blackaby, Booth, and Frank (2005). 8.
(15) 2.3. Previous evidence A growing literature studies the consequences of disability on labour market outcomes, but, as far as I am aware, no one of the papers analyses explicitly the relationship between poor health and training. The low rate of employment among disabled employees and the wage gap between workers in good health and workers having any form of impairment made the literature to focus on the impact of disability on work participation, type of employment and earnings (for the UK see: Bardasi et al. (2000); Blackaby et al. (1999); Kidd et al (2000); Jenkins and Rigg (2003); Madden (2004), while for the US see: Acemoglu and Angrist (2001); Baldwin and Johnson (1994, 1995, 2000); Haveman et al (1991); Kruse and Schur (2003)) In general, all these pieces of work conclude that disability has a negative effect both on employment and on wages. Pelkowski and Berger (2004) find that temporary health problems have no significant effects on earnings. Nevertheless, I argue that even if a bad health condition does not affect current wages, it is likely to influence future wages if it is correlated with a lower access to training. This makes temporary impairments to have permanent effects in the long run. Few papers study the relationship between disability and expected tenure, which is of primarily importance in our analysis. Baldwin and Schumacher (2002) focus on involuntary job changes. They observe that disabled workers have a higher probability than non-disabled workers to experience involuntary job changes. It can be due either to discrimination in firing or job mismatch among workers with disabilities. However, when other forms of job mobility are analysed, the authors do not find significant differences between disabled and non-disabled workers. Using multinomial probit models on data from the National Longitudinal Survey of Youth (NLSY), Royalty (1996) estimates the determinants of job-to-job and jobto-unemployment turnover. She finds that bad health increases the probability of making the transition to unemployment for every group of workers, while it increases the probability of job-to-job turnover only for low educated employees. It is worth noticing that the data include also transitions due to layoffs. It can partially explain the results the author got for job-to-job turnover for people in bad health. In fact, low educated workers having a form of illness or disability are more vulnerable and they are more likely to experience downward job-to-job transitions. On the contrary, for more educated workers, disability lowers the probability of job-to-job turnover, since it narrows the range of available outside options. Royalty (1998) studies the effect of the probability of job turnover on the probability of receiving training. The author argues that different degrees of labour market attachment create differential incentives for investment in human capital. In particular, she argues that health status does not influence the amount of offered training through a direct channel, but through labour turnover since poor health conditions affect the expected time horizon of the investment in human capital. Finally, the paper observes that those articles finding an effect of. 9.
(16) tenure on training but not controlling for the expected time horizon of the investment may suffer from omitted variable bias. Royalty (1998) provides a rare example of a paper discussing the impact of disability on training, although the consequences of poor health conditions are not the main focus of the work. Most of the remaining literature on the determinants of training has not studied the investment in human capital for disabled 7 and it has not even included health status among the explanatory variables. A partial exception to this lack of interest is Addison and Belfield (2004). Using WERS 1998, the authors study the variables influencing `training incidence' (whether the worker got trained in the 12 months before the interview) and `training intensity' (how many days of training he got). Although the main focus of the paper is not studying the impact of disability on training, Addison and Belfield include workers' health status among the controls and they found a positive (though not significant) effect of disability on incidence of training and a opposite effect (but still not significant) on the intensity of training. Hence, according to their results, ill-health does not seem to be an important determinant of training and the common concern about an unequal provision of training for disabled employees does not seem to be justified. However, it is worth noticing that in WERS 1998 the question asking for the amount of training the worker got does not explicitly exclude health and safety training. 8 The choice of including health and safety training is meaningful for those who want to study the opportunities of training for disabled employees. Including health and safety training in the count of days devoted to investing in human capital can mask an unequal provision of training for people in different health status. In fact, if such kind of training is offered mainly to disabled workers, the distribution of the overall training turns out to be more equal than the distribution of those investments in human capital leading to increases in future wages.. 7. Instead, much emphasis has been given to the opportunity of training offered to other disadvantaged subgroups of workers such as low educated people, women and ethnic minorities (Lynch (1992); Arulampalam, Booth, and Bryan (2004) ; Blundell, Dearden, and Meghir (1996)) or to the impact of labour market institutions on human capital accumulation (Arulampalam, Booth, and Bryan (2004), Almeida-Santos and Mumford (2005), Booth and Böheim (2004); Booth, Francesconi, and Zoega (2003)) 8 while WERS 2004 does. 10.
(17) CHAPTER THREE. Data and sample description 3.1 WERS 2004 This paper uses the cross-section part of the 2004 Workplace Employment Relation Survey (WERS 2004). WERS 2004 cross-section survey is based on a stratified 9 random sample of British establishments having more than 5 employees and a random sample of employees within each establishment. The sampling procedure of workplaces excluded firms operating in agriculture, hunting and forestry, fishing, mining and quarrying as well as all private households with employed persons and extra territorial bodies. As a consequence, the dataset covers workplaces belonging to the sectors of manufacture, electricity gas and water, construction, wholesale and retail, hotels and restaurants, transports and communication, financial services, other business services, public administration, education, health and other commercial services. Those firms selected for the 1998-2004 WERS panel dataset are also excluded. 10 The primary unit sampling yielded a sample of 2,295 firms. In the responding workplaces a fixed number of employees was interviewed. 11 The final design yielded a sample of 22,451 workers.. 9. the strata are constructed on the basis on the basis of the SIC sector of activity and the IDBR recorded workforce size. 10 WERS includes a set of matched employer-employees cross sections and a panel of firms. Firms contained in the panel are not surveyed for the cross sectional part 11 for firms having less than 25 workers all the employees have been included in the sample, while for smaller firm a random sample of 25 workers has been drawn.. 11.
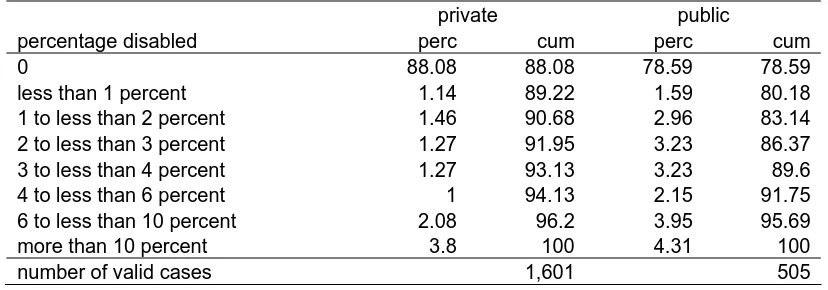
(18) 3.2. Selected sample In line with the literature on WERS 12 , I chose to include in our sample just private firms, since public and private firms are likely to face different incentives and to be exposed to a different degree of risk. Private and public workplaces seem also to differ in a series of characteristics related both to disability and training. Descriptive statistics on managers' answers show that public firms have a higher percentage of disabled workers than private firms. Table 3.1 shows the distribution of the share of disabled employees for the two groups. We can see that 88 per cent of the managers employed in the private sector declare that no disabled employees work in their firm. In public sector firms such a percentage only exceeds 78 per cent.. Table 3.1: number of disabled people. percentage disabled 0 less than 1 percent 1 to less than 2 percent 2 to less than 3 percent 3 to less than 4 percent 4 to less than 6 percent 6 to less than 10 percent more than 10 percent number of valid cases. private perc 88.08 1.14 1.46 1.27 1.27 1 2.08 3.8. cum 88.08 89.22 90.68 91.95 93.13 94.13 96.2 100 1,601. public perc 78.59 1.59 2.96 3.23 3.23 2.15 3.95 4.31. cum 78.59 80.18 83.14 86.37 89.6 91.75 95.69 100 505. Not only are public and private firms different in their average number of disabled workers, but they also differ in the level of implementation of the policies against discrimination. The manager questionnaire contains an extensive section dealing with Equal Opportunities policies and practices in the workplace. The data summarised in table 3.2 show that in the public sector the practices promoting fair treatment at work for disabled employees are much more common than in the private sector.. 12. see, for example, Booth and Böheim (2004). 12.
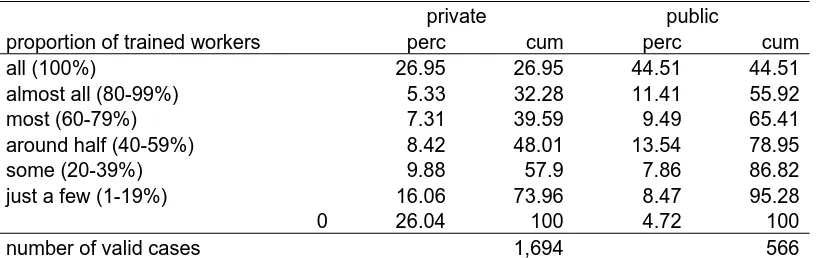
(19) Table 3.2: Policies against discrimination private 5.75 48.69 14.21 12.45 5.1 6.11 2.01. favouring applications of disabled policy mentioning discrimination against disabled monitoring recruiting and selection reviewing recruitment and selection monitoring promotions reviewing promotions reviewing relative pay rates. public 31.1 83.01 54.01 41.84 23.06 27.2 11.5. When we look at the proportion of trained workers that emerges from the managers' questionnaire, we observe that in public firms 44.51 per cent of the managers declare that the whole workforce is trained, while in the private sector the same answer is given only by less than 27.00 per cent. Again, employers reporting no training at all are 26.04 per cent in the private sector and a tiny 4.31 per cent in the public sector (see table 3.3).. Table 3.3: Proportion of trained workers. proportion of trained workers all (100%) almost all (80-99%) most (60-79%) around half (40-59%) some (20-39%) just a few (1-19%) 0. private perc 26.95 5.33 7.31 8.42 9.88 16.06 26.04. number of valid cases. cum 26.95 32.28 39.59 48.01 57.9 73.96 100 1,694. public perc 44.51 11.41 9.49 13.54 7.86 8.47 4.72. cum 44.51 55.92 65.41 78.95 86.82 95.28 100 566. Finally, not only do public firms offer training to a greater proportion of employers, but they also provide workers with longer programmes (table 3.4).. Table 3.4: days of training. days of training no time less than one day 1 to less than 2 days 2 to less than 5 days 5 to less than 10 days 10 days or more number of valid cases. private perc 2.03 5.69 27.64 36.31 14.85 13.48. cum 2.03 7.73 35.36 71.67 86.52 100 1,427. public perc 0.22 4.67 15.4 36.78 25.85 17.09. cum 0.22 4.89 20.29 57.07 82.91 100 525. I have also excluded those observations for which I did not have complete information on the variables of interest. The exclusion of missing records led to a 18.52 per cent decrease in the sample size. The distribution of the missing values does not present sharp differences across categories of respondents. 13.
(20) although very young and older workers as well as workers belonging to ethnic minorities have lower response rate. Unsurprisingly, people in good health have a higher response rate than those having a disability, being the percentage of non respondents equal to 7.93 per cent for people in good health, 9.35 per cent for those having a non work limiting disability and 9.77 per cent for those having a work limiting disability. However, mean comparison tests suggest that the response rate is statistically different only when we compare people in good health and people living with a work limiting disability, while the intermediate categories do not seem to differ in this respect. As a consequence, the broader sample I used includes 12436 workers clustered in 1177 firms.. 3.3 Descriptive statistics First of all I am interested in the proportion of disabled in the WERS sample. WERS describes health related conditions through single-item, global and self reported questions. Due to self reporting, the derived measure of disability must be considered subjective. The data permit us to derive two alternative measures of disability. 13 The first definition is indicated by the acronyms LSI and it describes self reported Long Standing Illness or disability (LSI). The idea of LSI is meant to capture the negative effect of poor health as perceived by the respondent. The acronym for the second definition is WLD. It indicates a `Work Limiting Disability' reflecting the respondent's perception of his ability to carry out paid work. The question assessing WLD is always hypothetical in order to avoid an endogenous recording of health status. In fact, the respondents are asked to relate their health conditions to the type of job they can, might or could do. In the WERS cross section of employees, health condition is assessed through two different questions. Workers are first asked whether they have a long term illness, health problem or disability 14 and then they are asked whether their illness or disability affects the amount or type of work they can do. Such a two step question, which allows a distinction to be made between two different classes of ill and disabled employees, was introduced in the last survey, since WERS 1998 used the LLSI definition. 15 This means that any comparison between the two surveys on estimates of disability must be done with caution. The presence of two different but related questions regarding people's health status makes it difficult to create a measure of disability without making assumptions on the basis of their responses. In particular, I decided to exclude 13. there are other two possible definitions which are not used here i.e. whether the respondent is covered by the Disability Discrimination Act (DDA disabled) and whether the individual has an impairment limiting him in his in their day-to-day life (LLSI: `Limiting Long Standing Illness or disability') 14 where a `long-term' disability is defined is an illness, health problem or disability that can be expected to last for more than one year 15 the exact wording of the 1998 survey is `do you have any long standing health problem or disability which limit what you can do at work, at home or in your leisure time?'. 14.
(21) from my analysis those whose answers were not coherent i.e. those answering the question defining the consequences of the impairment on job performances after declaring they do not have a LSI. The appendix explains this choice and it compares the distribution I got with the estimates derived from other important surveys in the UK. Table 3.5 sheds light on the health status of the workers employed in private firms. According to my data, more than 87 per cent are in good health, almost 5 per cent has a disability limiting the amount or the type of work they can do and the remaining 8 per cent has a long lasting illness which, however, does not affect job performances. Table 3.5: workers’ health status in private firms health status good health work limiting disability (WLD) non work limiting disability number of valid cases. perc 87.39 4.89 7.72. cum 87.37 92.28 100 13,596. Figure 3.1: proportion of trained workers by tenure. Proportion of trained workers. .4 0. .2. mean of trained. .6. .8. by tenure. less than 1 year. 1 to less than 2 years. 2 to less than 5 years. 5 to less than 10 years. 10 years or more. data: WERS 2004 The Cross-Section Survey of Employees. In the previous paragraph I argued that actual tenure is an informative variable in explaining the provision of training. Figure 3.1 shows the proportion of trained workers in each recorded band of tenure. Unsurprisingly training is offered in the first part of people's career and it declines with tenure, however, such a relationship does not seem to be linear, given that the bigger investment in human capital seems to take place between the first and the second year of tenure.. 15.
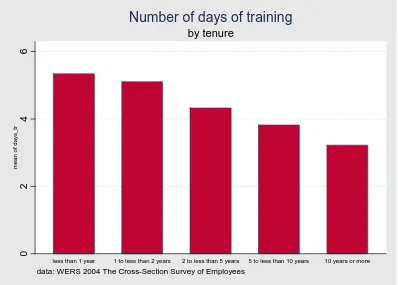
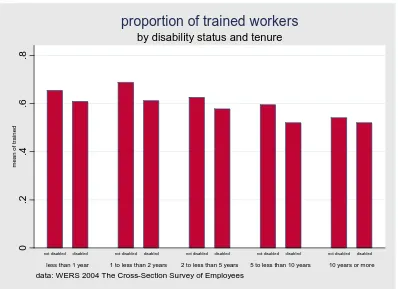
(22) Figure 3.2: number of days of training by tenure. Number of days of training. 0. 2. mean of days_tr. 4. 6. by tenure. less than 1 year. 1 to less than 2 years. 2 to less than 5 years. 5 to less than 10 years. 10 years or more. data: WERS 2004 The Cross-Section Survey of Employees. When we look at the number of days of training (see figure 3.2), we get a similar pattern displaying a peak between the first and the second year in the firm and a decreasing trend after reaching the maximum. Such a stylised fact indicates that there is a type of training (not necessarily induction training) which is offered to the workers when they are still in the earlier part of their career, but they have spent some time in the firm. 16 It is in line with the idea that the employers prefer to delay training in order to collect more information on the quality of the workers (Loewenstein and Spletzer (1997)) Similarly, training taking place in the first year of tenure can be interpreted as a `screening device' as argued by Autor (2001). If we analyse the provision of training by dividing the workers according to their health status, 17 we notice that the proportion of workers who are trained is lower for disabled people than for people in good health (see figure 3.3). It suggests that when health and safety training is excluded rom the calculus of the days devoted to increasing workers' human capital, the public concern about a lower access to training for people in bad health seems to be justified. Such a gap does not seem to change significantly with tenure.. 16. This training has not been necessarily provided after at least one year in the firm, however, being the respondents in their second year in the establishment, the information reported is unlikely to refer to the proper induction training which takes place in the very first few weeks after being hired. 17 I have used the LSI definition of disability by putting together WLD and non WLD disabled. 16.
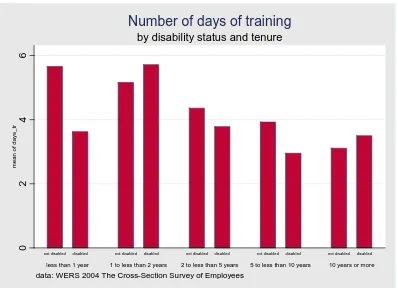
(23) Figure 3.3: Proportion of trained workers by tenure and health status. proportion of trained workers. .4 0. .2. mean of trained. .6. .8. by disability status and tenure. not disabled. disabled. less than 1 year. not disabled. disabled. 1 to less than 2 years. not disabled. disabled. 2 to less than 5 years. not disabled. disabled. 5 to less than 10 years. not disabled. disabled. 10 years or more. data: WERS 2004 The Cross-Section Survey of Employees. Figure 3.4 looks at the number of days of training offered to people in different health status. The gap between disabled and non-disabled employees is very large for newly hired, it almost vanishes between the first and the second year in the firm, then it appears again after the peak and declines with tenure. 18. 18. the group of those having tenure between 5 and 10 years is the smallest group, which makes descriptive statistics for this band slightly unreliable. 17.
(24) Figure 3.4: number of days of training by tenure and health status. Number of days of training. 0. 2. mean of days_tr. 4. 6. by disability status and tenure. not disabled. disabled. less than 1 year. not disabled. disabled. 1 to less than 2 years. not disabled. disabled. 2 to less than 5 years. not disabled. disabled. 5 to less than 10 years. not disabled. disabled. 10 years or more. data: WERS 2004 The Cross-Section Survey of Employees. It is not desirable drawing strong conclusions on the basis of figure 5.4. alone, given that some of the variance in the height of the bars is due to the upper value we used for the right censored band in the number of days of training (more than 10 days). However, the graph leads to think that there might be a postponement in the induction training for people with disabilities, which might explain both the huge gap between disabled and non disabled people for the days of training offered to people in their first year in the firm and the `catching up' which seems to take place in the case of people who are in their second year in the firm. An explanation for such a phenomenon could be that, when the employers do not have enough information about workers' `quality', they use disability as a signal of low productivity or poor labour attachment. This leads to a lower access to training for newly hired disabled worker and, perhaps, to a postponement of the investment in human capital for a sub sample of disabled employees.. 18.
(25) CHAPTER FOUR. Investing in human capital 4.1. A two parts process The main intuition of this paper is that the process of investing in human capital can be divided in two parts: the first one indicating whether the worker got any training and the second one indicating how many days of training she got, conditional on being selected for training. As a consequence, the probability of receiving x days of training can be written as:. (. ). (. P x = x = P ( x > 0 )P x = x | x > 0. ). (. ). where P(x > 0) is the probability of getting any training and P x = x | x > 0 is the probability conditional to get a positive amount of training. In line with part of the literature on training (see, for example, Addison and Belfield (2004) and Booth and Böheim (2004)), I will call the first part of the process `training incidence', while the second part `training intensity'. I believe that it is informative to study separately `training incidence' and `training intensity' since they are different in nature. In particular, the sub sample of those receiving training is not a random sample of the total workforce, but it is mainly composed by workers who are perceived to be `safe investments'. My dependent variables are derived by using the question in WERS asking the employees: `apart from health and safety training, how much training have you had during the last 12 months, either paid for or organised by your employer?'. The possible answers are: `None', `Less than 1 day', `1 to less than 2 days', `2 to less than 5 days', `5 to less than 10 days', `10 days or more'. Training incidence is a dichotomous variable indicating whether the worker got any training. In my specification training intensity indicates the number of days the worker got, given that she got a positive amount of firm sponsored training. As a consequence, I excluded the null records and I focused on the observations reporting positive amounts of training. 19. 19. In this choice, our paper is different from the previous literature. 19.
(26) 4.2 Explanatory variables and their expected coefficients The independent variables can be divided in two groups: individual and firm characteristics. Among the individual variables, the one we am mostly interested in is `disability' since the aim of the paper is studying whether and in which cases ill-health is associated with poor access to training. We mainly focused on the LSI definition of disability defining as `disabled' those having an impairment which lasted or it is expected to last for at least 12 months. We did this for two reasons. First the perception of disability is likely to depend partially on the respondent's occupation, as a consequence, using the WLD definition of disability introduces an additional potential source of endogeneity. Second, since disabled employees are a small percentage of the whole workforce, splitting them into two groups does not seem to be desirable, since the number of observation for each group becomes really tiny. One of the most important variables is workers' actual tenure. As my descriptive statistics have shown, people's actual tenure seems to be important for understanding the provision of training for people in poor health. However, any statement about any causal effect of tenure on training must be made with caution, since the variable is clearly endogenous. Nevertheless, we think that the sign of the correlation between actual tenure and firm sponsored training is extremely meaningful in the case of people in poor health. Tenure is measured by using three dummy variables. The first one indicates whether the respondent has been working in the firm for a period of time ranging from one to two years. This is also the reference category since we have shown that in this time band there is a peak in the amount of training provided (whatever indicator is used) and the investment in human capital seems not to be different for workers in different health conditions. Moreover, in order to exploit better the relationship between disability and permanence within the firm, I included also a set of interactions between disability and tenure which are meant to capture the changes in the effect of disability as long as the time spent in the firm increases. The individual controls are: sex, age (in linear and in quadratic form), ethnicity, marital status, presence of dependent children, higher educational qualification and occupation (SOC 2000 major groups). 20 Furthermore, we controlled for a dummy indicating whether in the twelve months before the interview the respondent has ever worked more than 48 hours a week (to control for absence). 21 The information on the extra hours worked is aimed at 20. Controlling for education and occupation can hide the indirect effect of disability on training, since disabled employees are more likely to be less educated and to be in low-paid jobs (Hale et al. (1998); Blackaby et al. (1999)). However, we think that failing to control for those variables would lead to biased estimates 21 the variable takes value equal to one if the worker has never done extra hours in the time span considered. 20.
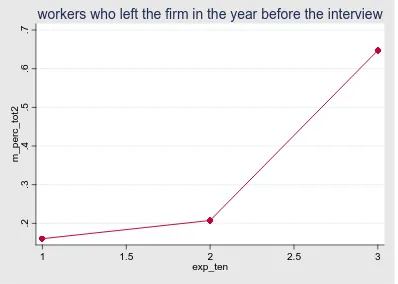
(27) capturing the time spent at work in the year before the interview in order to take into account not just the usual workload, but also the presence at work during the time span in which also training is recorded. It can be a (negatively related) proxy of the days lost due to poor health conditions. Workers in poor health conditions can be more likely to be excluded from training not only because their probability of being selected for training in a specific day is lower (for example because the firms think they are not a safe investment), but also because they simply have fewer available working days, since they are more likely to be absent from work as a consequence of their illness. The WERS managers' questionnaire provides a broad set of firm specific variables permitting the analysis of the effect of firm level covariates on the decision of offering paid off-the-job training. 22 Perhaps the most important set of firm level variables is the one referring to the average expected tenure for workers in the firm since believe that the expected tenure of the worker helps to understand why firms invest in workers' human capital. In order to construct such a variable we used the managers' questionnaire where the employers are asked the extent in which they agree or disagree with the sentence: `Employees are led to expect long-term employment in this organisation'. The question is important not only since it sheds some light on the average expected tenure of the workers for each firm, but also because it gives some information on the way in which the tenure is perceived by the employers. Using information derived from the employers' side is informative, given that the variable determining firms' investment in human capital is not the actual tenure of the workers, but the expectation the managers have on that. The answers to this question are recorded in five bands, depending on whether the manager declared to `strongly agree', `agree', `neither agree, nor disagree', `disagree' or `strongly disagree' with the sentence presented. I collapsed the first two and the last two categories and I divided the firms into three groups. In the first group (long tenure) we have included all those firms in which workers are likely to expect a long tenure, while in the second group (neither long nor short tenure) there are all those firms whose managers answered they neither agreed nor disagreed with the statement. Finally, in the last group, which is also the reference group for the dummy variables, we aggregated all those firms whose managers disagreed or strongly disagreed. Being a subjective measure, the validity of the variable can be questioned. Figure 4.1 plots a raw measure of labour turnover for each group of expected tenure. WERS 2004 does not contain a direct measure of workers' turnover, but it reports the number of employees who left the firm due to dismissals, resignations, redundancies and other reasons including retirements. We think that the first three causes can be negatively correlated with tenure. Since the category `other. 22. studying the consequence of disability on people's life becomes even more important after the introduction by the World Health Organisation of the `biopsychosocial model of disability'. In fact, the `International Classification of Functioning, Disability and Health' (ICF) developed in 2000 provides a new standard framework for the analysis of health and healthrelated states and it emphasises the importance of the interaction between health status and environment where people live (see WHO (2002).. 21.
(28) reasons' includes retirements, we suspect that this can be positively correlated with average expected tenure, being tenure closely linked to age. We created the variable summarising the number of people who left the firm in 2003 by adding just dismissals, redundancies and resignations. Then we computed the mean of the variable for each of the three groups of expected tenure constructed according to what stated in the employers' questionnaire. Group number one in the x axis includes all the firm whose managers declared they either strongly agree or agree with the aforementioned question, group two includes all those firm where no clear answers were given and group three includes firm where workers are perceived not to expect a long tenure. The mean of the variable, computed for each group of declared expected tenure, has the expected behaviour, given that it is low for the group 1 and it increases monotonically for the following groups, thus giving evidence in favour of our measure for the expected time horizon of the investment. Figure 4.1: percentage of workers who left the firm in the year before the interview. .2. .3. m_perc_tot2 .4 .5. .6. .7. workers who left the firm in the year before the interview. 1. 1.5. 2 exp_ten. 2.5. 3. Moreover, we included a set of firm level variables indicating firms' attitudes towards training and disability. Among the former, the first set of dummies indicates the presence of direct forms of consultation about training between the employers and the employees and it is a measure of the possibility for the workers to influence directly the process of skill formation. In the WERS managers' questionnaire the workers are asked whether there exist `meetings between senior managers and the whole workforce (either altogether or group by group)', furthermore, they are asked to indicate the content of these meetings. A similar question assesses the presence of meetings where supervisors and line managers discuss with the workers they are responsible for. Finally, the. 22.
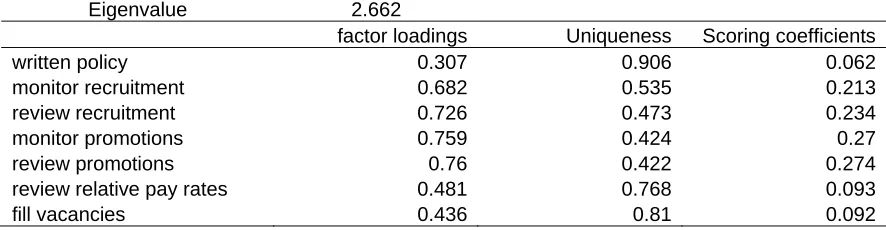
(29) questionnaire asks if there are committees of managers and employees aimed at consultation rather than negotiation (`joint consultative committees', `works councils' or `representative forums') and the topics they mainly deal with. Since alternative forms of direct participation display a great level of complementarity or substitutability, responses to the aforementioned questions are likely to be highly correlated. As a consequence, we aggregated them in a set of three dummy variables. Therefore, we divided the firms in three groups. The first group is composed by all the firms where there is no form of direct consultation or negotiation. The second group includes those workplaces where there is at least a meeting or a committee where employers and employees can interact directly but training is not among the topics discussed. The third group indicates the firm where there are both direct consultation through meetings or committees and discussion about training. The last group is also the reference category. Obviously direct consultation is not the only channel through which employers and employees interact. WERS contains information also about the use of representative bodies. In particular, the managers' are asked whether there is any form of bargaining with the employees' representatives on a set of topics including training. A scale of different degrees of interaction is used, ranging from `no interaction at all' to `negotiation of training'. 23 The question is asked twice: the first time referring to unions and the second time referring to non union representatives. We created a variable indicating whether there exists any form of negotiation on training between employers and either union or non union employee representatives. We have also created a variable summarising firms' attitude towards fair treatment at work with a particular focus on disability. 24 I have first considered if firms have a formal written policy on equal opportunities explicitly mentioning disabled people among the protected categories. Moreover, I have considered the following anti discrimination actions: whether recruitment, selection and promotion procedures are monitored and reviewed in order to identify indirect discrimination by disability, whether relative pay rates are reviewed by disability and whether in filling vacancies the firm has any special procedure for encouraging the application of disabled people. Since the above are likely to be different aspects of a more general commitment of the firm against disability, I used factor analysis to create a common factor describing firms' anti-discrimination behaviour which can be used in place of the single variables to avoid multicollinearity. Table 4.1 shows the contribution of each analysed practice in the determination of the common factor. It also shows that in the main the extracted factor summarises data very well.. 23. The intermediate steps are `the managers inform representatives about training' and `the managers consult representative about training'. 24 In order to derive it, I used the section in the employers' questionnaire called `fair treatment at work' which was highly improved in the 2004 cross section. The section contains rich information about the degree of implementation within the firm of different policies against discrimination against people in poor health.. 23.
(30) Table 4.1: Factor analysis for the variable describing the degree of discrimination against disabled Eigenvalue written policy monitor recruitment review recruitment monitor promotions review promotions review relative pay rates fill vacancies. 2.662 factor loadings 0.307 0.682 0.726 0.759 0.76 0.481 0.436. Uniqueness 0.906 0.535 0.473 0.424 0.422 0.768 0.81. Scoring coefficients 0.062 0.213 0.234 0.27 0.274 0.093 0.092. Although anti discrimination practices are very unlikely to influence directly the overall training, the variable has been included in order to control for unobserved firms' attitude towards disability. In fact, in order to avoid biased estimates of the coefficient for disability, the unobserved firm effect, after controlling for the covariates at firm level, must be uncorrelated with the variable of interest. Finally, I controlled for firm size (in linear and quadratic form) and for a variable indicating the average period of time it takes for the newly hired to become able to do their job as well as more experienced workers already employed in the firm. 25 This variable can be interesting for two reasons. First of all, it can measure the average complexity of the task performed in the firm. Following Schumacher and Baldwin (2000), we argue that there could be endogenous sorting of disabled people in less complicated jobs. Hence, when omitted requirements of the job are correlated with disability status, the estimates of the effect of health condition on the outcomes in the labour market can be biased. 26 The second reason observes that the time it takes for a new hired employee to become as skilled as an experienced worker is correlated with training. Loewenstein and Spletzer (1999) use the number of weeks it takes until a new hired becomes fully trained as a control in an equation analysing the determinants of training. The authors interpret the variable as a proxy of on-thejob training and they find a positive relationship between job complexity and actual training. If interpreted as a proxy of the amount of on-the-job training, a positive correlation implies a form of complementarity between on-the-job and off-the-job training.. 25. in the tables it is called `difficulty' the paper focus on wage differentials, but the argument can be reasonably extended to other outcomes in the labour market. 26. 24.
(31) CHAPTER FIVE. Empirical Analysis For the empirical analysis we use a set of different econometric models whose common characteristic is separating the two parts of the process of investing in human capital. The first set of models exploits the multilevel nature of my data since the individual observations are nested into firms. The second set of models follows Cragg (1971), but it explicitly accounts for the fact that days of training are recorded in bands.. 5.1 random intercept and random coefficient models * Let yij be the latent variable indicating the propensity of receiving training. We can now define two new variables for training incidence yij and training intensity ~ yij . The former takes only two possible values (0 and 1), while the latter can take 5 different values corresponding to each of the positive intervals in which the data are recorded.. I have estimated yij , through logit models. The latent variable specification for the logit is the following: ⎧1 y ij = ⎨ ⎩0. if y * ij > 0 if otherwise. (1). ~ yij has been estimated through ordered-logit models using only positive records. The formula for ordered logit is: ⎧ 1 if ⎪2 ⎪⎪ if ~y = 3 if ⎨ ij ⎪ 4 if ⎪ ⎪⎩ 5 if. y * ij ≤ κ 1 κ 1 ≤ y * ij ≥ κ 2. (2). κ 2 ≤ y * ij ≥ κ 3 κ 3 ≤ y * ij ≥ κ 4 κ 5 ≤ y * ij. where κ1 , κ 2 , κ 3 , κ 4 , κ 4 are the thresholds, 1-5 are the possible outcomes: less than one day of training, one to less than two days, two to less than five days, five to less than ten days, ten days or more. For each model I have allowed for two types of firm specific random effects: a linear one determining a random intercept and a multiplicative one which takes the form of a random coefficient for the variable disability. The rationale for this 25.
(32) second random effect is studying whether, after controlling for the relevant firm specific characteristics, firm specific unobserved characteristics make poor health status to have differential consequences on training. The equation for the latent variable measuring the `propensity for receiving training' can be written as follows:. y*ij = (β1 + ζ 1 j ) + (β 2 + ζ 2 j )dij + β '3 xij + β ' 4 x j + ε ij. (3). or. y*ij = β1 + β 2 dij + β '3 xij + β ' 4 x j + ζ 2 j dij + ζ 1 j + ε ij. (4). Where d ij is the dummy variable indicating the health status of person i in firm j, xij is a vector of individual and match specific covariates describing worker i in firm j, x j is a vector of firm specific covariates for firm j and ε ij has a standard 2 logistic distribution (with variance equal to π ).. ζ 1 j is a firm specific random intercept i.e. the deviation from the mean intercept β1 due to firm characteristics. ζ 2 j is the random slope i.e. the firm specific deviation from the mean slope β 2 j . Variances and covariance between the two random effects are: Var (ζ 1 j ) = ψ 11. (5). Var (ζ 2 j ) = ψ 22. (6). Cov (ζ 1 j , ζ 2 j ) = ψ 21. (7). Moreover, we also have:. β1 = 0. (8). where (8) is the usual restriction for ordinal logit for identifying the thresholds. Comparing dichotomous logit and ordered logit models suggests a strategy for the identification of causal effects. Controlling for a large set of covariates is not always desirable, therefore, even controlling for observed firm and individual characteristics, there might be still some potential source of endogeneity, due to an omitted variable problem. In this paper we are not interested in the effect of disability per se on training, but we want to study how the effect of disability changes when more information is 26.
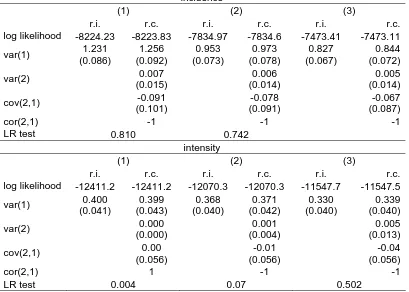
(33) made available and when a selected subgroup of workers is taken into account. In this way, we do not need to assume complete exogeneity but only that the potential endogeneity has a comparable effect across all the stages of the process. Results I analysed training incidence and training intensity allowing both for a single linear firm effect and for two firm effects: a random coefficient and a random intercept. The results are contained in tables 5.1, 5.2., 5.3. and 5.4 . The models in column (1) include only few individual variables: age, sex, ethnicity and disability i.e. those characteristics which are thought to be related with some form of discrimination. The results in column (2) refer to a more complicated model including the full set of covariates at the individual level, finally column (3) contains the full model using both individual and firm specific characteristics. Random coefficient and random intercept models yield exactly the same results in terms of size and significance of the coefficients. The main difference is that, in the case of random coefficient models, few additional parameters are estimated and they include the variance of the multiplicative effect and the covariance between the two unobserved firm effects. The estimated values for the variance of the second random effect suggest that the random coefficient model does not seem to fit the data better that the simple random intercept model. However, in order to prove it formally, I tested the null hypothesis of zero variance for the multiplicative random effect. Since the random intercept model can be seen as a restricted version of the random coefficient model, I used a likelihood ratio test comparing the value of the likelihood in the two specifications (Table 5.1 summarises the results). The main problem for this test is that the hypothesis that the slope of the coefficient for disability does not vary across firms lies at the boundary of the parameter space, as a consequence, the usual chi-square test with two degrees of freedom for the two additional parameters (variance of the second random effect and covariance between the two effects) cannot be used. The solution suggested by Snijders and Bosker (1999) is dividing the p-value by two, thus making less restrictive the criteria leading to reject the null. However, the minuscule values I got for the test statistics especially for training incidence, is not high enough to make the hypothesis of using random coefficient attractive.. 27.
(34) Table 5.1: random intercept and random coefficient models incidence (1) log likelihood var(1) var(2) cov(2,1) cor(2,1) LR test. r.i. -8224.23 1.231 (0.086). r.c. -8223.83 1.256 (0.092) 0.007 (0.015) -0.091 (0.101) -1 0.810. (2) r.i. -7834.97 0.953 (0.073). r.c. -7834.6 0.973 (0.078) 0.006 (0.014) -0.078 (0.091) -1 0.742. (3) r.i. -7473.41 0.827 (0.067). r.c. -7473.11 0.844 (0.072) 0.005 (0.014) -0.067 (0.087) -1. intensity (1) log likelihood var(1) var(2) cov(2,1) cor(2,1) LR test. r.i. -12411.2 0.400 (0.041). r.c. -12411.2 0.399 (0.043) 0.000 (0.000) 0.00 (0.056) 1 0.004. (2) r.i. -12070.3 0.368 (0.040). r.c. -12070.3 0.371 (0.042) 0.001 (0.004) -0.01 (0.056) -1 0.07. 28. (3) r.i. -11547.7 0.330 (0.040). r.c. -11547.5 0.339 (0.040) 0.005 (0.013) -0.04 (0.056) -1 0.502.
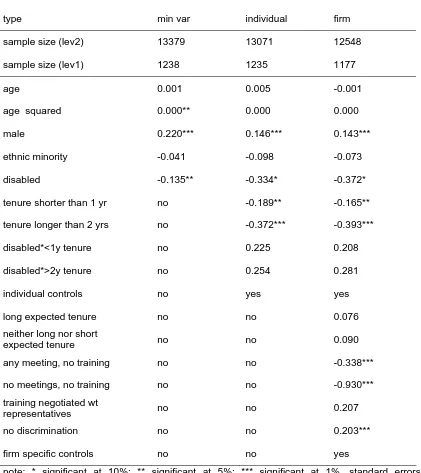
(35) Table 5.2: training incidence incidence type. min var. individual. firm. sample size (lev2). 13379. 13071. 12548. sample size (lev1). 1238. 1235. 1177. age. 0.001. 0.005. -0.001. age squared. 0.000**. 0.000. 0.000. male. 0.220***. 0.146***. 0.143***. ethnic minority. -0.041. -0.098. -0.073. disabled. -0.135**. -0.334*. -0.372*. tenure shorter than 1 yr. no. -0.189**. -0.165**. tenure longer than 2 yrs. no. -0.372***. -0.393***. disabled*<1y tenure. no. 0.225. 0.208. disabled*>2y tenure. no. 0.254. 0.281. individual controls. no. yes. yes. long expected tenure. no. no. 0.076. neither long nor short expected tenure. no. no. 0.090. any meeting, no training. no. no. -0.338***. no meetings, no training. no. no. -0.930***. training negotiated wt representatives. no. no. 0.207. no discrimination. no. no. 0.203***. firm specific controls. no. no. yes. note: * significant at 10%; ** significant at 5%; *** significant at 1%, standard errors in parentheses. 29.
Figure

+7
Related documents
Political Parties approved by CNE to stand in at least some constituencies PLD – Partido de Liberdade e Desenvolvimento – Party of Freedom and Development ECOLOGISTA – MT –
Most companies recruit for full-time and internship positions, but some indicate Co-Op as a recruiting priority, while not attending Professional Practice
$1000 and a complimentary letter to Mary Patten for her heroic work in bringing the fast sailing clipper ship safely around the dangerous Cape Horn?. When Mary and Captain
The Master Fund is authorised in Luxembourg as a specialised investment fund and is managed by a management company, Ress Capital Fund Management SA, who acts
• Storage node - node that runs Account, Container, and Object services • ring - a set of mappings of OpenStack Object Storage data to physical devices To increase reliability, you
Customer to pay any amount within ten (10) days after the amount is due and payable, b) abuse of the System or the equipment, c) dissolution, termination, discontinuance,
Recording Data for New or Revised Course (Record only new or changed course information.) Course prefix (3 letters) Course Number (3 Digits) Effective Term (Example:
The Department of Health, Physical Education, Recreation and Dance offers a Master of Science in Education in Health and Physical Education and a Master of Science in
