RESEARCH NOTE
Simple descriptive missing data
indicators in longitudinal studies with attrition,
intermittent missing data and a high number
of follow-ups
Morten Wærsted
1*, Taran Svenssen Børnick
1, Jos W. R. Twisk
2,3and Kaj Bo Veiersted
1Abstract
Objective: Missing data in longitudinal studies may constitute a source of bias. We suggest three simple missing data indicators for the initial phase of getting an overview of the missingness pattern in a dataset with a high number of follow-ups. Possible use of the indicators is exemplified in two datasets allowing wave nonresponse; a Norwegian dataset of 420 subjects examined at 21 occasions during 6.5 years and a Dutch dataset of 350 subjects with ten repeated measurements over a period of 35 years.
Results: The indicators Last response (the timing of last response), Retention (the number of responded follow-ups), and Dispersion (the evenness of the distribution of responses) are introduced. The proposed indicators reveal different aspects of the missing data pattern, and may give the researcher a better insight into the pattern of missingness in a study with several follow-ups, as a starting point for analyzing possible bias. Although the indicators are positively correlated to each other, potential predictors of missingness can have a different relationship with different indicators leading to a better understanding of the missing data mechanism in longitudinal studies. These indictors may be use-ful descriptive tools when starting to look into a longitudinal dataset with many follow-ups.
Keywords: Longitudinal study, Missing data, Wave nonresponse, Patterns of missingness, Missing data indicators, Attrition
© The Author(s) 2018. This article is distributed under the terms of the Creative Commons Attribution 4.0 International License (http://creativecommons.org/licenses/by/4.0/), which permits unrestricted use, distribution, and reproduction in any medium, provided you give appropriate credit to the original author(s) and the source, provide a link to the Creative Commons license, and indicate if changes were made. The Creative Commons Public Domain Dedication waiver (http://creativecommons.org/ publicdomain/zero/1.0/) applies to the data made available in this article, unless otherwise stated.
Introduction
A longitudinal study with a high number of follow-ups provides a unique opportunity to evaluate individual development over time, but it also implies many chal-lenges. Participants may be present for some waves of data collection and missing for others (wave nonre-sponse). The pattern of missingness may be monotone
(the subject drops permanently out of the study, often referred to as attrition or dropout), intermittent (miss-ing observations between the observed) or mixed (an intermittent pattern followed by monotone missingness) [1–6].
Missing data makes standard analyses more difficult or inappropriate to implement, gives loss of efficiency, and under certain circumstances introduces bias [5, 7]. Advanced statistical methods are available in standard statistical software and increase efficiency by using all data collected [8–10]. However, applying these advanced techniques may also introduce bias and requires high sta-tistical skill to avoid pitfalls [9]. For a proper interpreta-tion of study results, it may be important to investigate whether people with different missing data patterns dif-fer from each other in other characteristics. Most litera-ture on missing data has focused on monotone missing data [11], where a common method is to dichotomize participants from baseline to: (1) Participants who pre-maturely dropped out, and (2) Participants who answered all follow-ups [12]. In datasets with many follow-ups and
Open Access
*Correspondence: [email protected]
1 Department of Work Psychology and Physiology, National Institute
different patterns of missingness the analysis becomes more complicated [6]. In a study with three follow-ups Ware and co-workers [13] introduced four categories of response patterns: Always responders (no missing), Leav-ers (responding to one or two follow-ups, but not the last one), Returners (missing one or two follow-ups, but not the last one), and Never responders (responding only at baseline). However, these categories are less applicable when the number of follow-ups is large.
This paper proposes three simple descriptive missing data indicators to characterize individual patterns that may arise in a longitudinal study with many follow-ups. These indicators may be a helpful additional tool in the initial phase of getting an overview of the missingness patterns in a dataset. The first indicator is the timing of the last response to follow-up, independent of a partici-pant’s pattern of missingness before the last response. The second indicator is the amount of data each partici-pant contributes with, i.e. the number of follow-ups each participant responded to. The third indicator concerns the evenness of the distribution of responses throughout the whole follow-up period. Together these three sim-ple indicators may be helpful in evaluating the patterns of missing data which is a crucial issue in order to have an idea about the external validity of study results. The aim of this paper is to stress the importance of evaluat-ing the patterns of missevaluat-ing data and this paper provides a few relatively simple tools to do so. As far as we know, the way of addressing this issue and the three proposed descriptive indicators are new inventions of this paper. In order to exemplify the calculation and possible use of these indicators, datasets are obtained from two pre-viously published studies with a longitudinal design and a high number of follow-ups. One dataset comes from a Norwegian study following technical school students through their apprenticeship period and into working life [14]. The other dataset comes from a Dutch study with a follow-up period of 35 years from the age of 12–14 [15].
Main text
Methods Sample datasets
The first dataset is drawn from a Norwegian longitu-dinal study with 20 follow-ups over six and a half years [14], including 420 technical school students (mean age 17.5 years at baseline). Throughout the follow-up period, the participants were allowed to skip one or more follow-ups without being excluded from further participation. We selected four independent variables measured at baseline and known from other studies to have a poten-tial to influence dropout, in addition to the baseline value of the main outcome variable of the original study. These five variables (Gender, Parents’ country of origin, Smoking,
Self-reported health and Neck and shoulder pain last 4 weeks) were all dichotomized (see the left column of Table 1 in “Results” section). Self-reported health was rated with a simple question—How is your health now?
collected from ‘Health Behavior among pupils’, a World Health Organization survey [16]. Neck and shoulder pain last 4 weeks was measured by an index capturing both intensity and duration [14, 17]. More detailed informa-tion about this cohort is given elsewhere [14].
The second dataset is drawn from the Amsterdam Growth and Health Longitudinal Study with 10 follow-ups over 35 years [15]. The study started in 1976 with more than 600 boys and girls aged between 12 and 14 years of age. The sample dataset includes the 350 sub-jects that were invited to all follow-ups. We selected the following variables as potential indicators for missing:
Gender, Biological age, Social desirability, Social inad-equacy and Physical fitness. Biological age was estimated as skeletal age by radiographs of the left hand and wrist.
Social desirability was measured with the Achievement Motivation Test [18], while Social inadequacy was meas-ured with the Dutch Personality Inventory [19]. Physi-cal fitness was assessed by measuring maximal oxygen uptake (VO2max) by running on a treadmill [20].
Descriptive missing data indicators
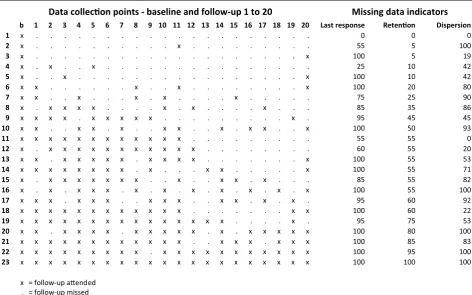
The Last response indicator uses the timing of the last follow-up measurement that was responded to, giv-ing a score of zero for only respondgiv-ing at baseline and the maximum score of 100 for responding at the last follow-up.
The Retention indicator reflects the exact number of measurements responded to relative to the total number of measurements in the study protocol, giving a score of zero for only taking part in the baseline measurement and the maximal score of 100 for taking part in all follow-up measurements in the study.
sum is normalized to a score between zero and 100 and turned to give increasing score on the Dispersion indica-tor with increasing dispersion of the attended measure-ments. The exact calculation steps needed to obtain the
Dispersion indicator are listed in Additional file 1. This calculation is less straight forward than the calculation of the first two indicators, and will most conveniently be done with a custom-made program (see an example in Additional file 2).
Figure 1 gives concrete examples of the proposed miss-ing data indicators calculated for selected subjects drawn from the Norwegian dataset.
Statistical analysis
Mann–Whitney U tests and Spearman correlation coeffi-cients (IBM SPSS version 21.0) were used to relate varia-bles potentially related to missingness to the missing data indicators. Non-parametric methods were used because the missing data indicators could not be assumed to be
symmetrically distributed. In addition, Spearman corre-lation coefficients were calculated to assess the correla-tions between the missing data indicators. A p value < .05 was considered significant.
Results
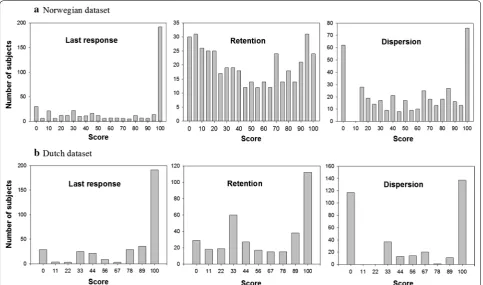
The distribution of the three missing data indicators is shown in Fig. 2.
In the Norwegian dataset (Table 1), smokers compared to non-smokers and participants with at least one parent of non-western origin had lower scores for all the miss-ing data indicators. Men scored lower than women on the Retention indicator. Neither Self-reported health nor
Neck and shoulder pain last 4 weeks differed between the categories for any of the indicators.
In the Dutch dataset (Table 1), gender was not related to any of the missing data indicators. Biological age and social desirability were inversely related to the
Last response indicator. Physical fitness was positively
Table 1 Bivariate relationships in the two sample datasets
Missing data indicators Last response Retention Dispersion Median (percentiles
25–75%) p Median (percentiles 25–75%) p Median (percentiles 25–75%) p
Norwegian dataset (n = 420) Gender
Men (n = 153) 85 (25–100) .43 30 (10–75) .016 65 (18–88) 1.0
Woman (n = 267) 90 (35–100) 50 (20–80) 50 (22–89)
Parents’ country of origin
Both western (n = 368) 95 (35–100) .015 50 (20–80) < .001 64 (21–90) .050
One or both non-western (n = 52) 53 (20–100) 20 (5–44) 43 (5–78)
Smoking (n = 419) Never/former/sometimes
(n = 279) 100 (35–100) .005 55 (20–83) .001 67 (22–92) .017
Every day (n = 140) 65 (30–100) 35 (10–60) 50 (19–76)
Self–reported health
Good/very good (n = 306) 95 (30–100) .41 40 (15–80) .84 54 (19–88) .71
Not quite good/poor (n = 114) 78 (34–100) 45 (20–80) 51 (26–88)
Neck and shoulder pain last 4 weeks
No (0–1) (n = 279) 95 (30–100) .73 40 (15–80) .99 58 (19–90) .92
Yes (2–12) (n = 141) 80 (35–100 50 (18–75) 64 (28–85)
Dutch dataset (n = 350) Gender
Men (n = 169) 100 (56–100) .93 56 (33–100) .25 50 (0–100) .42
Woman (n = 267) 100 (56–100) 67 (33–100) 62 (0–100)
Spearman correlations p Spearman correlations p Spearman correlations p
Biological age − 0.140 .009 − 0.006 .92 − 0.078 .15
Social desirability − 0.143 .008 − 0.088 .10 − 0.094 .08
Social inadequacy − 0.104 .054 − 0.082 .13 − 0.070 .19
[image:3.595.60.540.99.468.2]associated with the missing data indicators Last response
and Dispersion. Although in general, the observed rela-tionships were relatively small.
Discussion
In order to highlight different individual patterns in miss-ingness, we have introduced three missing data indica-tors. We propose these indicators as descriptive tools in an early stage of evaluating a dataset with a high num-ber of follow-ups and wave nonresponse with monotone, intermittent or mixed missingness. By using these indica-tors, the researcher may observe interesting patterns of missingness that may be overlooked in ordinary analysis and that may be potential sources of selection bias. The three indicators were constructed to catch in a simple manner three different aspects of an individual response pattern in a longitudinal study where all participants par-ticipate at baseline.
The Last response indicator gives a simple measure of how long into the study the subject is observed. This may be the most important aspects to evaluate for research
questions where a long follow-up is crucial, and can be viewed as an indicator of dropout from a study.
The Retention indicator reflects the total amount of data each participant contributes. For many purposes, a high response rate may be regarded as the most impor-tant aspect.
The Dispersion indicator captures to what extent the data from a subject cover a large part of the study period relative to the number of data collections attended to. The argument for constructing this indicator is the value of having subjects contributing throughout a study period. Thus, in most studies an even distribution of attended data collections may be viewed as optimal, given the number of data collections where the subject contributed. For several research questions this qual-ity will add to the validqual-ity of the data contributed from the subject. Constructing an indicator for this aspect, however, is not as straight forward as for the two other indicators. We chose to score the evenness of the distri-bution of responses given the total number of responses, so that for every number of responses both a maximal
Data collecon points - baseline and follow-up 1 to 20 Missing data indicators b 1 2 3 4 5 6 7 8 9 10 11 12 13 14 15 16 17 18 19 20 Last response Retenon Dispersion
1 x . . . 0 0 0
2 x . . . x . . . 55 5 100
3 x . . . x 100 5 19
4 x . x . . x . . . 25 10 42
5 x . . x . . . x 100 10 42
6 x x . . . x . . x . . . x 100 20 80
7 x x . . x . . . x . x . . . . x . . . 75 25 90
8 x . x x x x . . . . x . x . . . . x . . . 85 35 86
9 x x x x . x x x x x . . . x . 95 45 45
10 x x . . x x . x . . x x . . x . x x . . x 100 50 93
11 x x x x x x x x x x x x . . . 55 55 0
12 x . x x x x x x x x x x x . . . 60 55 20
13 x x . x x x x x . x x x x . . . x 100 55 53
14 x x x x x x x x . x . . . x x . . . x 100 55 71
15 x . x x x x x x x . . x . . x x . x . . . 85 55 82
16 x . x . x x x . x . x . x . x . x . x . x 100 55 100
17 x x x . x x x . . x x x . . x x . x . x . 95 60 92
18 x x x x x x x x x x x x . . . x x 100 60 22
19 x x x x x x x x x x x x x x x . . . . x . 95 75 53
20 x x . x x x x . x x x x x . x . x x x x x 100 80 100
21 x x x x x x x x x x x x . . x x x . x x x 100 85 83
22 x x x x x x x x x . x x x x x x x x x x x 100 95 100
23 x x x x x x x x x x x x x x x x x x x x x 100 100 100
x = follow-up a ended . = follow-up missed
[image:4.595.61.534.88.383.2](100) and a minimal (0) score was possible. Simpler log-ics for calculating a Dispersion indicator were contem-plated; however, the logic presented in this paper gave the best reflection of the dispersion of the responses, and in the best way supplemented the other two indicators in addressing the different aspects of the missingness pat-terns. When a subject has very high or very low attend-ance, the Dispersion indicator is not so informative. One possible option can be not to include subjects with very high or very low scores on the Retention indicator when evaluating the Dispersion indicator.
The missing data indicators introduced in this paper, put numbers on three aspects of the patterns of missed follow-ups that may arise in a study with intermittent missing and a high number of follow-ups. The intention is to provide a tool that may help a researcher in getting an initial overview of the missingness in a dataset, as a supplement to the well-established methods to evaluate and handle missing data. The indicators are not linked to modelling or outcome, and are not constructed to give values that may be used to decide on the acceptability of the data or to decide on which methods to use to han-dle the missingness. However, a better understanding
of the missingness patterns in a dataset will be of value when looking for possible sources of bias and deciding on further steps in the data analysis. In this respect, some researchers may find the three proposed indicators help-ful, depending on the way they prefer to get an overview of their datasets.
Limitations
It should be realized that the three missing data indica-tors can only be calculated when the total number of follow-up measurements is known. In most longitudinal studies, this would probably be the case. However, when the follow-up time points are unplanned, the three miss-ing data indicators are not well defined. Besides that, a prerequisite to use the three proposed indicators is that a study protocol allows intermittent missingness or mixed missingness, which is mostly the case in long-term follow-up cohort studies. The more follow-up measure-ments, the more informative the three indicators will be. However, also with four or five follow-up measure-ments the first two indicators can be used, while more follow-ups are needed for the Dispersion indicator to be interesting. In our sample datasets, all the missing data
[image:5.595.57.541.88.373.2]indicators show a relatively strong interrelationship. This is partly a consequence of the way the indicators are con-structed, but does not mean that they convey identical information. Anyhow, the strength of this relationship might differ between datasets, and more interestingly, the associations between the missing data indicators and particular variables in the dataset will vary as illustrated in Table 1.
Abbreviation
VO2max: maximal oxygen uptake.
Authors’ contributions
MW and TSB designed the descriptive missing data indicators and drafted and wrote the main parts of the manuscript. MW, TSB and KBV designed the main research questions of the study, and contributed with the Norwegian dataset. JWRT was involved in revising the manuscript with important intellectual content, and contributed with the Dutch dataset. All authors are accountable for all aspects of the work. All authors read and approved the final manuscript. Author details
1 Department of Work Psychology and Physiology, National Institute
of Occupational Health, PO box 8149 Dep, 0033 Oslo, Norway. 2 Department
of Epidemiology and Biostatistics, VU Medical Center, De Boelelaan 1089a, 1081 HV Amsterdam, The Netherlands. 3 EMGO Institute for Health and Care
Research, VU Medical Center, De Boelelaan 1089a, 1081 HV Amsterdam, The Netherlands.
Acknowledgements Not applicable. Competing interests
The authors declare that they have no competing interests. Availability of data and materials
The two studies that provided the example datasets, are extensively pub-lished, see the cited references in “Methods” section. The specific subset used to exemplify the proposed missing data indicators is not publicly available, as this was not included in the request to use the data as examples in the present paper.
Consent for publication Not applicable.
Ethics approval and consent to participate
The participants in the two studies that provided the example datasets gave their written informed consent according to Norwegian and Dutch legislation, and these two studies had their approval of the local ethics committees, the Region South Committee for Medical Research Ethics in Norway and the VU Medical Center Ethical Committee in the Netherlands. For participants under the age of 18 in the Norwegian dataset written informed consent was also obtained from their parents. All participants in the Dutch dataset was under the age of 18 at inclusion and their parents provided written informed con-sent. For the measurements after the age of 18, the participants themselves gave written informed consent.
Additional files
Additional file 1. The file contains a table listing the calculation steps needed to obtain the Dispersion indicator.
Additional file 2. The file gives an example of a Phyton program to calculate the three missing data indicators.
Funding
There was no external funding to the present project. The funding of the stud-ies that provided the example datasets, is stated in the publications from the respective studies (cited in “Methods” section).
Publisher’s Note
Springer Nature remains neutral with regard to jurisdictional claims in pub-lished maps and institutional affiliations.
Received: 31 May 2017 Accepted: 2 February 2018
References
1. Schafer JL, Graham JW. Missing data: our view of the state of the art. Psychol Methods. 2002;7(2):147–77.
2. Little RJA, Rubin DB. Statistical analysis with missing data. 2nd ed. Hobo-ken: Wiley; 2002.
3. Fielding S, Fayers PM, Ramsay CR. Investigating the missing data mecha-nism in quality of life outcomes: a comparison of approaches. Health Qual Life Outcomes. 2009;7:57.
4. Farrington DP, Gallagher B, Morley L, Ledger RJS, West DJ. Minimizing attrition in longitudinal research: methods of tracing and securing cooperation in a 24-year follow up study. In: Magnusson D, Bergmann L, editors. Data quality in longitudinal research. Cambridge: Cambridge University Press; 1990. p. 122–47.
5. Nakai M, Ke W. Review of the methods for handling missing data in longitudinal data analysis. Int J Math Anal. 2011;5(1):1–13. 6. Xie H. Analyzing longitudinal clinical trial data with nonignorable
missingness and unknown missingness reasons. Comput Stat Data Anal. 2012;56:1287–300.
7. Laird NM. Missing data in longitudinal studies. Stat Med. 1988;7(1–2):305–15.
8. Twisk J, de Vente W. Attrition in longitudinal studies. How to deal with missing data. J Clin Epidemiol. 2002;55(4):329–37.
9. Sterne JAC, White IR, Carlin JB, Spratt M, Royston P, Kenward MG, Wood AM, Carpenter JR. Multiple imputation for missing data in epidemiologi-cal and cliniepidemiologi-cal research: potential and pitfalls. BMJ. 2009;338:b2393. 10. Biering K, Hjollund NH, Frydenberg M. Using multiple imputation to deal
with missing data and attrition in longitudinal studies with repeated measures of patient-reported outcomes. Clin Epidemiol. 2015;7:91–106. 11. Lin H, McCulloch CE, Rosenheck RA. Latent pattern mixture models for
informative intermittent missing data in longitudinal studies. Biometrics. 2004;60(2):295–305.
12. Miller RB, Hollist CS. Attrition bias. In: Salkind N, editor. Encyclopedia of measurement and statistics. Thousand Oaks: Sage Publications, Inc; 2007. 13. Ware RS, Williams GM, Aird RL. Participants who left a multiple-wave
cohort study had similar baseline characteristics to participants who returned. Ann Epidemiol. 2006;16(11):820–3.
14. Hanvold TN, Wærsted M, Mengshoel AM, Bjertness E, Twisk J, Veiersted KB. A longitudinal study on risk factors for neck and shoulder pain among young adults in the transition from technical school to working life. Scand J Work Environ Health. 2014;40(6):597–609.
15. Wijnstok NJ, Hoekstra T, van Mechelen W, Kemper HCG, Twisk JWR. Cohort profile: the Amsterdam growth and health longitudinal study. Int J Epidemiol. 2013;42(2):422–9.
• We accept pre-submission inquiries
• Our selector tool helps you to find the most relevant journal
• We provide round the clock customer support
• Convenient online submission
• Thorough peer review
• Inclusion in PubMed and all major indexing services
• Maximum visibility for your research
Submit your manuscript at www.biomedcentral.com/submit
Submit your next manuscript to BioMed Central
and we will help you at every step:
17. Steingrímsdóttir ÓA. Subjective health complaints and their relation to muscle responses in a working population (thesis). Faculty of Medicine, University of Oslo and National Institute of Occupational Health, Oslo, Norway. 2005.
18. Hermans HJM. Handleiding bij de PMT-K [Manual of the achievement motivation test youth version]. Lisse: Swets & Zeitlinger; 1983.
19. Luteijn F, van Dijk H, van der Ploeg FAE. Handleiding bij de NPV J, Herziene Uitgave [Manual of the Dutch personality inventory, revised edition]. Lisse: Swets & Zeitlinger; 1989.