R E S E A R C H A R T I C L E
Open Access
Microarray-based uncovering reference genes for
quantitative real time PCR in grapevine under
abiotic stress
João L Coito, Margarida Rocheta, Luísa Carvalho and Sara Amâncio
*Abstract
Background:Quantitative real time polymerase chain reaction is becoming the primary tool for detecting mRNA and transcription data analysis as it shows to have advantages over other more commonly used techniques. Nevertheless, it also presents a few shortcomings, with the most import being the need for data normalisation, usually with a reference gene. Therefore the choice of the reference gene(s) is of great importance for correct data analysis. Microarray data, when available, can be of great assistance when choosing reference genes. Grapevine was submitted to water stress and heat stress as well as a combination of both to test the stability of the possible reference genes.
Results:Using the analysis of microarray data available for grapevine, six possible reference genes were selected for RT-qPCR validation:PADCP,ubiq,TIF,TIF-GTP,VH1-IK,aladin-related. Two additional genes that are commonly used as reference genes were included:actandL2. The stability of those genes was tested in leaves of grapevine in both field plants and in greenhouse plants under water or heat stress or a combination of both. Gene stability was analyzed with the softwares GeNorm, NormFinder and theΔCq method resulting in several combinations of reference genes suitable for data normalisation. In order to assess the best combination, the reference genes were tested in putative stress marker genes (PCO,Galsynt,BKCoASandHSP17) also chosen from the same microarray, in water stress, heat stress and the combination of both.
Conclusions:Each method selected different gene combinations (PADCP + act,TIF + TIF-GTPandubiq + act). However, as none of the combinations diverged significantly from the others used to normalize the expression of the putative stress marker genes, then any combination is suitable for data normalisation under the conditions tested. Here we prove the accuracy of choosing grapevine reference genes for RT-qPCR through a microarray analysis.
Keywords:Microarray, Grapevine, Real time RT-PCR, Reference gene
Background
Quantitative real time polymerase chain reaction (RT-qPCR) has become a mainstream research tool for the quantification of mRNA and transcription data analysis [1,2]. This method presents many advantages when com-pared with the more commonly used reverse transcript-ase polymertranscript-ase chain reaction (RT-PCR), Northern blotting and microarrays. These advantages being its
higher sensitivity, specificity, broad quantification and avoidance of post-PCR processing [2-4].
Approaches such as array-based transcription profiling technologies allow the assessment of expression levels of thousands of genes in control and stress tissues. Gene redundancy is, however, a common trait of this type of analysis and requires removal. RT-qPCR technology, due to the higher sensitivity and specificity [2,4,5] is excellent to confirm non-redundant gene expression obtained through microarray analysis. However RT-qPCR itself presents several shortcomings, the most important and relevant being the need for data normalisation [1,6-9]. Normalisation and homogenization [10] are of the * Correspondence:[email protected]
Centro de Botânica Aplicado à Agricultura, Departamento de Recursos Naturais, Ambiente e Território, Instituto Superior de Agronomia, Universidade Técnica de Lisboa, Lisbon, Portugal
utmost importance in RT-qPCR as they allow the cor-rections of PCR reactions due to inaccurate quantifica-tion of RNA or problems related to RNA quality and purity [1,11].
RT-qPCR data normalisation is usually performed using the expression of an internal control gene [4,6,12,13]. Such a gene is also referred as a “reference gene” or sometimes a “housekeeping gene” i.e. a gene whose expression does not change under the different conditions or tissues under investigation [1,14,15]. Un-fortunately no such gene exists, and the universality of such an ideal gene is not valid, since the transcript levels of all genes show some degree of variability under differ-ent experimdiffer-ental conditions [5-7,16]. Initially, gene sta-bility was assessed with the ΔCq method. In this method, the Cq value of the gene of interest (either tar-get or reference) is related to a control/calibrator [17]. In order to overcome these flaws, statistical algorithms such as GeNorm [6] and NormFinder [18] have been developed to evaluate the best suited reference gene or a combination of genes for normalisation of RT-qPCR data in a specific set of biological data [6].
The identification of suitable reference genes can be difficult. Several attempts have been made, all with dif-ferent outcomes. Studies usually allocate difdif-ferent “model”genes to be used in data normalisation. Usually the allocated genes vary with the plant species, as well with the experimental conditions. Also the method to select the reference candidate varies with the availability of data for the plant species under study. Studies regard-ing reference genes often employ a variety of methods to chose possible reference genes; such as searching the bibliography for published references [19], using ortho-logs of Arabidopsis reference genes [20], cDNA libraries [21] or analysis of EST libraries [22]. Genes that are fre-quently identified to be good references include elong-ation factors 1-α (eEF-1α) [23-26], actin (act) [8,15,21,23], ubiquitin (ubiq) [8,25,27-29], glyceraldehyde 3-phosphate dehydrogenase (GAPDH) [7,25,27,28], ribo-somal proteins [7,21,25,30-32], SAND family protein (SAND) [20,27,33] and, other less common genes have been identified to be particularly good references in very specific contexts.
Czechowski et al. [5], using data from Affymetrix ATH1 whole-genome GeneChip, proposed not only the typical reference genes for RT-qPCR but also new ones. After that study, microarrays, when available, have been used for identifying reference genes [34,35], with new genes being found for RT-qPCR data normalisation.
In grapevine, several attempts have been made in iden-tifying reference genes. Gamm et al. [36] indicated two genes (V-type proton ATPase 16 kDa proteolipid subunit and 60S ribosomal protein L18) as being optimal refer-ence genes for the study of the expression of genes
involved in pterostilbene synthesis in grapevine leaves infected byP. viticolaand berries infected by B. cinerea. Reid et al. [23] also tested possible reference genes spe-cifically suitable for use in grapevine berry development studies and suggested GAPDH, act, eEF-1α and SAND as the most stable.
Whatever the method used for choosing possible refer-ence genes for data normalisation, stability analysis should always be performed in the optimal conditions.
Grapevine (Vitis viniferaL.) is a sessile organism and therefore cannot avoid abiotic stress. Plants have been developing mechanisms to cope with environmental changes and help to overcome them. The most relevant abiotic stresses that can affect the production of a Medi-terranean crop such as grapevine are: drought, excessive light and excessive heat. In fact, climate models predict an intensification of extreme conditions, which can re-duce production to below the threshold for optimal grapevine growth [37]. This represents a serious chal-lenge for Mediterranean agriculture.
The pattern of gene expression in response to abiotic stress has been monitored in ex vitro grapevine plants by comparing the use of the grapevine Affymetrix Gene-Chip with extensive RT-qPCR analysis [38]; and in greenhouse and field plants through genechip micro-array (results under analysis).
In this paper we report several putative reference genes chosen from a grapevine microarray analysis and identify the genes to be used as references for RT-qPCR normalisation, after obtaining the“optimal combination” of reference genes using three different methods. We also apply the three “optimal combinations” obtained to quantify the expression of a set of stress-marker genes.
Results and discussion
Choice of reference genes
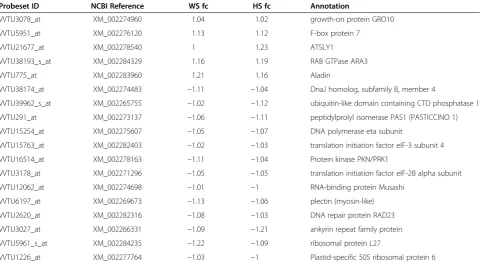
Candidate reference genes were chosen from a micro-array analysis using an micro-array composed of 23 096 uni-gene sequences [39]. All the uni-genes that did not meet the selection criteria (100% presence in control and in stress samples and both probesets present in all the stress sam-ples of the array) were discarded. Fold-change was then analysed and all probesets outside the fold-change inter-val of −1.25 to 1.25 were also discarded. This range was the minimum interval in which an acceptable number (eighteen) of possible reference genes could be found (Table 1).
described reference genes were also added to the study for comparison,actandL2(Table 2).
Selection of the best reference genes
The first approach used to verify the stability of the eight reference genes was the ΔCq method [17] (Table 3). In this method, the control/calibrator can be any sample, e.g. a real untreated control, or the sample with the high-est level of expression (lowhigh-est Cq value). The method generates raw (non-normalised) expression values, which need to be normalised by dividing with a proper normal-isation factor. The ΔCq method has several advantages, namely, it allows an easy inclusion of multiple reference genes for normalisation. In this research, the best
reference genes for RT-qPCR data normalisation
obtained with this method werePADCP, withactranked second, whilstaladin-relatedwas the worst choice.
[image:3.595.58.542.101.364.2]The GeNorm application for Microsoft Excel deter-mines the most stable reference genes from a group of genes. The application also calculates a normalisation factor of gene expression for each sample, based on the geometric mean of a user-defined number of reference genes. It is based on the assumption that the expression of two ideal reference genes will always have the same ratio among samples regardless of the experimental con-ditions [6]. This average expression stability value (M) is calculated using the expression data for each gene. M is the average pairwise variation (V) of one gene compared Table 1 Possible reference genes retrieved from the microarray analysis
Probeset ID NCBI Reference WS fc HS fc Annotation
VVTU3078_at XM_002274960 1.04 1.02 growth-on protein GRO10
VVTU5951_at XM_002276120 1.13 1.12 F-box protein 7
VVTU21677_at XM_002278540 1 1.23 ATSLY1
VVTU38193_s_at XM_002284329 1.16 1.19 RAB GTPase ARA3
VVTU775_at XM_002283960 1.21 1.16 Aladin
VVTU38174_at XM_002274483 −1.11 −1.04 DnaJ homolog, subfamily B, member 4
VVTU39962_s_at XM_002265755 −1.02 −1.12 ubiquitin-like domain containing CTD phosphatase 1
VVTU291_at XM_002273137 −1.06 −1.11 peptidylprolyl isomerase PAS1 (PASTICCINO 1)
VVTU15254_at XM_002275607 −1.05 −1.07 DNA polymerase eta subunit
VVTU15763_at XM_002282403 −1.02 −1.03 translation initiation factor eIF-3 subunit 4
VVTU16514_at XM_002278163 −1.11 −1.04 Protein kinase PKN/PRK1
VVTU3178_at XM_002271296 −1.05 −1.05 translation initiation factor eIF-2B alpha subunit
VVTU12062_at XM_002274698 −1.01 −1 RNA-binding protein Musashi
VVTU6197_at XM_002269673 −1.13 −1.06 plectin (myosin-like)
VVTU2620_at XM_002282316 −1.08 −1.03 DNA repair protein RAD23
VVTU3027_at XM_002266331 −1.09 −1.21 ankyrin repeat family protein
VVTU5961_s_at XM_002284235 −1.22 −1.09 ribosomal protein L27
VVTU1226_at XM_002277764 −1.03 −1 Plastid-specific 50S ribosomal protein 6
Probeset ID, NCBI Reference, Water Stress fold change (WS fc), Heat Stress fold change (HS fc) and annotation of the 18 genes retrieved from the microarray analysis [39]. The presence call is 100% in all genes in both treatments.
Table 2 Primers used for the reference genes chosen after analysis of Table 1
Probeset ID Name Sense primer Anti-Sense primer pb
VVTU3078_at PADCP 5' ATTCATTAAAGTACCTTTCTTT 3' 5' AACACCCAAAAGATGTCGTA 3' 240
VVTU39962_s_at ubiq 5' CAATTTCCTGAGTTCTACAGTT 3' 5' CCTCATTGTATGACTCCCAGT 3' 229
VVTU15763_at TIF 5' AAAGCAGAAGAAACCAAGATT 3' 5' TTGCCAGTGCCTGTAGTAGCC 3' 206
VVTU3178_at TIF-GTP 5' AGCAGCACAGAATAAGAAACT 3' 5' CCATCAGCCCCAACAAATACC 3' 177
VVTU3027_at VH1-IK 5' CAGGGATTATGATAGTAGGA 3' 5' TTGTTTGGTAGAGGAGGTGG 3' 252
VVTU775_at aladin-related 5' CCTACACTTATTCATCTTCG 3' 5' ACTTGTGGCGGTTGCTCTGC 3' 224
- act 5' TGGATTCTGATGGTGTGAGTC 3' 5' CAATTTCCCGTTCAGCAGTAGTGG 3' 167
- L2 5' TCTACTTCAACCGATATGC 3' 5' CAACCTGTCCGACTG 3' 196
[image:3.595.57.540.590.716.2]with each of the other reference genes tested. Stepwise exclusion of the gene with the highest M value allows the ranking of the tested genes according to their ex-pression stability, until the two most stable genes in the remaining set cannot be ranked any further. GeNorm also allows estimating the optimal number of reference genes which should be used for normalisation. It calcu-lates the normalisation factor (NF) based on the geomet-ric mean of the expression of more than one reference gene. GeNorm calculates the NFnof the two most stable reference genes based on the geometric mean of the ex-pression data, and then the NFn+1 with the next most stable gene. To determine how many genes should be used for accurate normalisation, the pair-wise variation (Vn/n+1) is calculated for each two sequential normalisa-tion factors (NFn) and NFn+1[6].
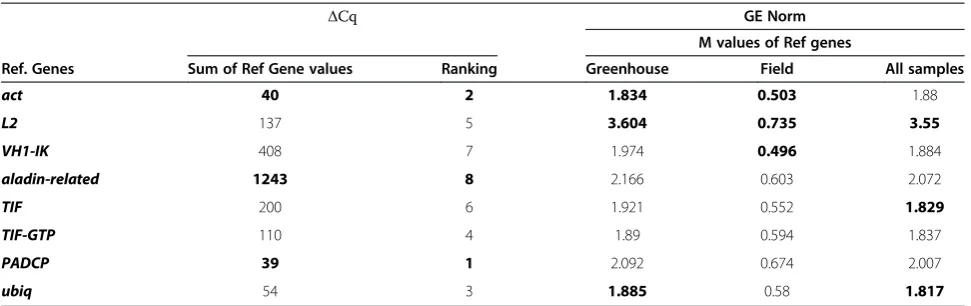
As GeNorm does not allow the analysis of results within groups, our samples were divided manually in three groups: “all samples”, “greenhouse” and “field” (Table 3). The stability values of the eight reference genes were calculated for those three groups (Figure 1). With all samples considered, the two best possible refer-ence genes were ubiq, ranked first and TIF, ranked sec-ond (Table 3). However, when the stepwise exclusion of the genes with the highest M value was performed, act andubiqwere considered the best option for normalisa-tion, with a stability value around 1.00 (Figure 1A). When the greenhouse plants were considered alone,act ranked first and ubiq ranked second (Table 3). Also, after the stepwise exclusion of the genes with the highest M value, the remaining best two genes were act and ubiq (Figure 1B). When only the field plants were con-sidered,actranked first and VH1-IKwas second, and M values were lower than those of the previous analyses (Table 3). In this case, the best group of genes included
VH1-IK and aladin-related (Figure 1C). In all these
comparisons, L2 ranked as the least stable reference gene (Table 3).
While GeNorm stepwise finds the two genes whose expression ratio shows the least variation in relation to the other genes; NormFinder finds the single gene with the most stable expression and the best pair of genes with the most stable combined expression [18]. The NormFinder pair can compensate in a way that, for best performance, a gene that is slightly overexpressed in a treatment group, and slightly underexpressed in the un-treated group, can be combined with a gene with the op-posite bias. Furthermore, NormFinder can account for the heterogeneity in the tested samples, allowing the comparison of different treatment groups. It can thus distinguish between stability and bias [18] eventually being able to discard a candidate reference gene that is excellent for all treatment groups but one. This indicates that the particular treatment affects that reference gene, which is then not such a good candidate. These are the most striking differences between the two analysis soft-wares, and that they can account for different results when comparing them.
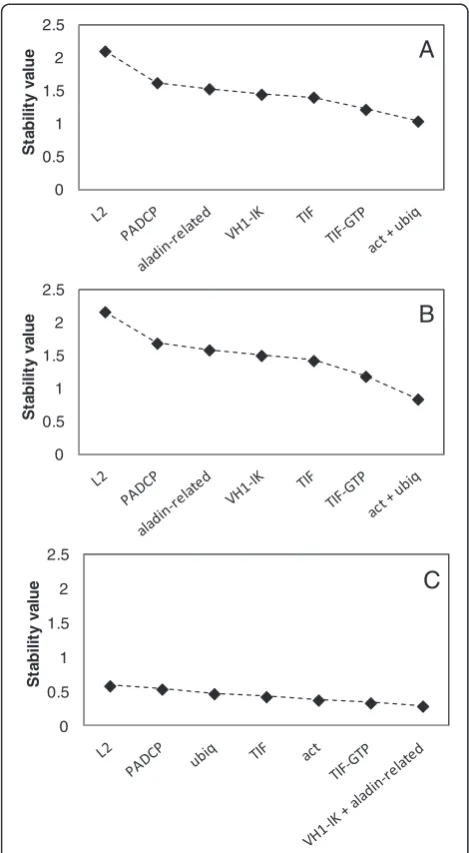
NormFinder analysis when performed without groups ranked TIF as the best gene for data normalisation (Table 4) as shown by the stability values (Figure 2A). The second most stable gene in this analysis was
TIF-GTP. When only the greenhouse plants were
ana-lysed, the best and the second best ranked genes were the same (Figure 2B). By analysing field plants, the best gene wasTIF-GTPwhileactranked second (Figure 2C). When “Greenhouse “and “Field” groups were intro-duced, the most stable gene was ubiq, while PACDP ranked second (Figure 2D). However NormFinder also calculates the best combination within a group and
indi-cated TIF-GTP and TIF as the best combination
(Table 4).
In all the GeNorm analysesL2was the worst perform-ing reference gene (Table 3 and Figure 1) while
aladin-related was the worst performing reference gene in the
[image:4.595.56.542.99.252.2]ΔCq and NormFinder analyses (Table 3 and Figure 2). Table 3 Ranking of reference genes usingΔCq and GeNorm
ΔCq GE Norm
M values of Ref genes
Ref. Genes Sum of Ref Gene values Ranking Greenhouse Field All samples
act 40 2 1.834 0.503 1.88
L2 137 5 3.604 0.735 3.55
VH1-IK 408 7 1.974 0.496 1.884
aladin-related 1243 8 2.166 0.603 2.072
TIF 200 6 1.921 0.552 1.829
TIF-GTP 110 4 1.89 0.594 1.837
PADCP 39 1 2.092 0.674 2.007
ubiq 54 3 1.885 0.58 1.817
Optimal number of genes for RT-qPCR data normalisation
There is an adequate number of reference genes to be used in each experiment, which depends on the balance between stability, accuracy and some practical aspects such as time and costs [6]; because when the majority of
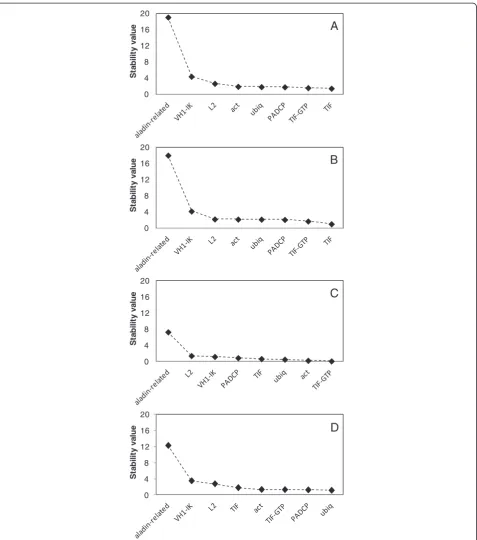
genes is stable, the addition of further genes would be a waste of resources. It is therefore essential to find the optimal number of reference genes. It has been sug-gested that three is the minimal number required for a correct normalisation [6]. Further addition of reference genes should be halted when the normalisation with NFn and NFn+1 have similar values [6]. GeNorm performs this analysis automatically by calculating the Vn/n+1 values between each combination of sequential NF. A cutoff of 0.15 is recommended, the inclusion of an add-itional reference gene below this value does not result in a significant improvement of the normalisation. Yet this is not an absolute value and can change according to the data [6]. In our experiment, the pairwise variation values for all samples and greenhouse samples were above the recommended cutoff value. When the analysis was per-formed using the field plants, there was no increase or decrease of relevance in adding more than two genes, possibly indicating that these plants have a very stable gene expression (Figure 3). This result, although unex-pected, is in agreement with the results obtained with microarrays performed in grapevine field plants at sum-mer with high light exposure, high temperature and water shortage conditions which showed higher gene stability than greenhouse plants that were individually subjected to the same types of stresses (Rocheta et al, in preparation). One explanation for this outcome is the better adaptation capacity of fully grown and well rooted plants.
The analysis performed by GeNorm were established based on a Spearman correlation between NFnand NFn+1, in which low variation values correspond to high correl-ation coefficients. As the pairwise varicorrel-ation values for “all samples” and “greenhouse” samples were above the recommended cutoff value (Figure 3) we per-formed Spearman correlation tests ourselves and obtained the results shown on Figure 4. These results show that the addition of a third reference gene to perform normalisation does not provide relevant in-formation, so the use of two genes is enough to ac-curately normalise the expression of genes of interest in those conditions.
Specific markers of abiotic stress
For the normalisation tests, we chose as best combina-tions of reference genes (BC) the following: GeNorm:
act + ubiq; NormFinder: TIF + TIF-GTP; ΔCq: PADCP +
0 0.5 1 1.5 2 2.5
St
a
b
ilit
y va
lu
e
A
0 0.5 1 1.5 2 2.5
St
a
b
ilit
y va
lu
e
B
0 0.5 1 1.5 2 2.5
St
a
b
il
it
y va
lu
e
C
[image:5.595.56.291.88.515.2]Figure 1Stability values of the putative reference genes using the software GeNorm.Stability values of reference genes calculated using the software GeNorm, A: all samples; B: greenhouse samples; C: field samples. Because GeNorm does not analyse samples in groups, these were obtained manually.
Table 4 Ranking of reference genes using NormFinder
All samples Greenhouse Field Greenhouse vs field
Best gene TIF TIF TIF-GTP ubiq
Best Combination - - - TIF + TIF-GTP
act. L2 was also used for comparison as the most un-stable gene.
For the more up and down-regulated genes, we used probesets with the highest or lowest fold change in each stress condition. That is to say, the most up or
down-regulated expressed probesets in drought could not be within the significantly expressed probesets in heat stress and vice-versa. From the two probesets chosen for drought (WS) and heat stress (HS) one was up-regulated and the other down-regulated (Table 5). The expression 0
4 8 12 16 20
St
a
b
ilit
y va
lu
e
A
0 4 8 12 16 20
St
a
b
ilit
y va
lu
e
B
0 4 8 12 16 20
St
a
b
ilit
y
va
lu
e
C
0 4 8 12 16 20
St
a
b
ilit
y va
lu
[image:6.595.61.539.87.628.2]e
D
of these genes was tested in the leaves of plants under WS, HS or a combination of both stresses (WSHS). Pri-mers for those genes are shown in Table 6.
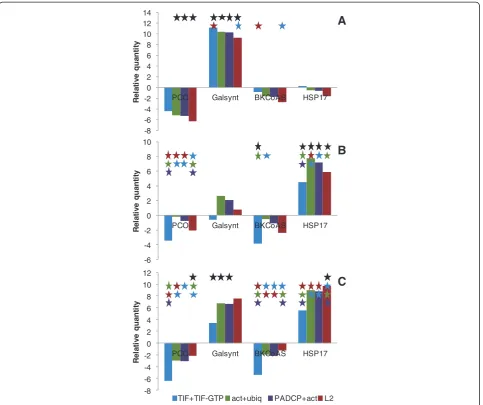
PCO (protochlorophyllide oxidoreductase) catalyses one of the steps of chlorophyll biosynthesis [40]. In the microarray analysis that supports this experiment,PCO was the most down-regulated gene under WS and therefore, it was chosen as a down-regulation marker of WS. In this experiment, PCO was down-regulated in both WS and HS (Figure 5A and B, respectively), but statistically significant differences of PCO expres-sion in both treatments were only found when PCO was normalised with the combinations act + ubiq,
PADCP + act and L2. In this case the use of those two
BCs would be preferred to the TIF + TIF-GTP combin-ation, which was unable to detect differences in PCO expression between both treatments (Figure 5A and B respectively).
GalSynt (Galactinol synthase) catalyses the first
com-mitted step in the biosynthesis of the rafinose
oligosaccharide family (RFOs) and plays a key regulatory role in carbon partitioning between sucrose and RFOs [41]. In Arabidopsis the GalSyntisoform AtGalSynt 1 is induced by drought and salinity [42]. In the microarray analysis this experiment was based upon, GalSynt was the most up-regulated gene under WS, and was there-fore chosen as an up-regulation marker of WS. Indeed
GalSynt showed significant up-regulation with all the
BCs and L2 under WS (Figure 5A); while in HS it was down-regulated when normalised with theTIF + TIF-GTP combination and showed a slight up-regulation when nor-malised with the remaining BCs andL2(Figure 5B). The results obtained in HS were significantly lower than the expression levels verified in WS with all the BCs and L2. This suggested that not only this gene responds well to the treatment imposed, but that all the BCs are stress in-sensitive and therefore suitable for data normalisation.
BKCoAS (β-ketoacyl-CoA synthase) is one of the
enzymes responsible for the elongation of fatty acid chains. Very-long-chain fatty acids (VLCFAs) are fatty
NF
3 All samples
r= 0.949438 V2/3 = 0.254
NF2
NF
3 Greenhouse
r=0.948001 V2/3 = 0.302
[image:7.595.59.540.90.218.2]NF2
Figure 3Optimal number of reference genes required for effective normalisation.Optimal number of reference genes required for effective normalisation. The pairwise variation (Vn/Vn/n+1) was analysed between the normalisation factors NFn and NFn + 1 using the software GeNorm to determine the optimal number of reference genes required for RT-qPCR data normalisation in three different situations (n and n + 1 as in the ranking of Table 3).
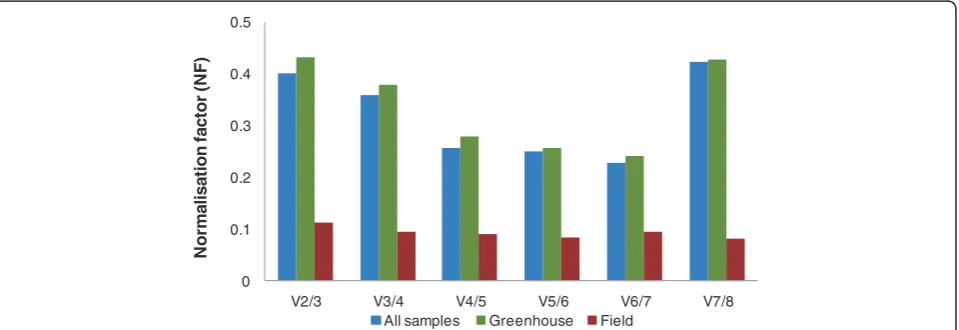
0 0.1 0.2 0.3 0.4 0.5
V2/3 V3/4 V4/5 V5/6 V6/7 V7/8
All samples Greenhouse Field
No
rm
a
li
s
a
ti
o
n
fa
c
to
r (N
F
)
[image:7.595.60.540.532.697.2]acids that have 20 or more carbon atoms. In plants, VLCFAs are the precursors of several lipids, such as cu-ticular waxes, and their derivatives act as protection bar-riers, they also provide energy storage in the seeds and act as signalling molecules, responding to several stress stimuli [43]. In this work, the down-regulation ofBKCoAS was studied as a possible marker of HS. The expression of
BKCoASunder HS was down-regulated when normalised
with all BCs and L2, as expected (Figure 5B). However under WSBKCoAS also displayed down-regulation when normalised with all BCs and L2 (Figure 5A). Statistical analysis showed significant differences in the expression of
BKCoAS between WS and HS (with the expression of
BKCoAS being lower in HS) only when the gene
expres-sion was normalised with theTIF + TIF-GTPcombination; making this combination ideal as a reference for RT-qPCR data normalisation in this case.
The accumulation of heat shock proteins (HSPs), under the control of heat stress transcription factors (HSFs), is known to play a central role in the response to heat stress and in acquired thermotolerance in plants and other organisms [44,45]. We have used the gene
HSP17 as an up-regulation marker of HS. Under HS
HSP17was up-regulated with all the BCs andL2(Figure 5B).
Under WS HSP17 showed differential expression,
being up-regulated when normalised with the TIF +
TIF-GTP combination and down-regulated with the
remaining BCs and L2 (Figure 5A). Statistical analysis showed that the expression of HSP17 was significantly higher in HS than in WS, when normalised with all BCs and L2, therefore making any BC andL2 suitable for RT-qPCR data normalisation.
Gene expression of the chosen markers was also tested under combined WS and HS conditions (Figure 5C) in
order to evaluate the reliability of the genes chosen as stress markers in a complex environment when more than one factor is at stake. All the genes used as stress
markers responded as expected, with PCO
down-regulated in response to WS and BKCoAS was down-regulated due to HS. Similarly, GalSynt was significantly up-regulated in WS, whilst HSP17 was up-regulated in HS. When statistical analysis was performed between the expression values of the stress marker genes under WSHS and their expected individual stress response; we found thatPCOexpression, when normalised with the combina-tions act + ubiq, PADCP + act and L2, was significantly lower when compared with its expression under WS. In this case, the best combination for data normalisation would beTIF + TIF-GTP. Under WSHS,GalSynt expres-sion showed significant differences in relation to WS when normalised with the three BCs. In this occasion,L2would be the most suitable gene for data normalisation, probably due to the expression stability of GalSynt. Under WSHS no significant differences were found in BKCoAS when compared to the expression of this gene in HS; rendering all BCs suitable for data normalisation. Under WSHS
HSP17 showed a significantly higher level of expression
when compared to HS, only whenL2 was used as refer-ence, making it a desirable reference gene in such situation.
Most works propose different combinations of refer-ence genes for different experimental conditions after combining the best reference genes that present a rank-ing consensus between different methods [15,25,27]. Conversely, our reference genes were selected to be used in analysing gene expression after different treatments. We used the BCs obtained and tested them individually by method. In fact, if we had used the four best ranking genes of all treatments and the three methods, we would have obtained the same four reference genes that com-prise the three BCs. Therefore we propose that the BCs obtained with any of the methods are suitable reference genes for transcription studies and this option is obvi-ously less time and resource consuming than the use of all four genes.
[image:8.595.55.291.112.180.2]Regarding the most stable genes,ubiq is referred as a reference gene in scientific works [8,21,25,27], as con-firmed in the microarray analysis, although its presence was recorded in only one combination. actwas chosen Table 5 Putative stress marker genes retrieved from the
microarray analysis
Name Probeset ID Accession Regulation WS fc HS fc
PCO VVTU27646_s_at XM_002284733 Down −12.14 −1.44
GalSynt VVTU3450_at XM_002262615 Up 49.98 22.25
BKCoAS VVTU16209_at XM_002284475 Down −3.44 −14.53
HSP17 VVTU13941_at XM_002267919 Up 2.92 292.07
Gene name, probeset identification (ID), NCBI reference, fold change of the most differentially expressed genes (i.e.,highest and lowest fold change values) in (WS) and heat (HS) obtained from the analysis of the microarray [39].
Table 6 Primers for the putative stress marker genes
Name Sense primer Anti-Sense primer pb
PCO 5' GCGTCTCATTATCGTTGGTTC 3' 5' CAGTGTCCTCGTGGTATCG 3' 233
GalSynt 5' CCAATCCCTTCTGAATACAACC 3' 5' TTTCCCACCATTTCCTCACC 3' 184
BKCoAS 5' TGCGACAAGGGCTTTCATC 3' 5' CAGGCTCCAGATCATACTCAG 3' 245
HSP17 5' AGAAGAAGAGCCAGAAGAGAAG 3' 5' ACACACGAAGCGACCAAG 3' 250
[image:8.595.57.538.656.724.2]due to its common use as reference gene [8,21,23] and was present in two of the three combinations. Transla-tion initiaTransla-tion factors have been tested by other authors but without success [17,19], while in our study TIFand
TIF-GTP showed good stability and their combination
was selected by NormFinder. PADCP is, to our know-ledge, referred to for the first time as a potential refer-ence gene and not only showed stable expression in the microarray analysis, but was also selected as reference gene by the GeNorm software. Ribosomal protein genes have been used as references in several studies [7,19,31] while in others they were ruled out as not stable enough
[24,29].L2, as one of those genes, was considered a good reference in one study [46] but did not perform so well in another [26]. In our workL2ranked as the least stable gene; however in some situations when normalizing stress markers, it outperformed the BCs, highlighting its major problem of being inconsistent.
Conclusions
This study attempts to provide the validation of refer-ence genes in grapevine leaves under abiotic stress con-ditions for RT-qPCR data normalisation. The availability of a custom microarray for grapevine was of great
TIF+TIF-GTP act+ubiq PADCP+act L2
-8 -6 -4 -2 0 2 4 6 8 10 12 14
PCO Galsynt BKCoAS HSP17
R
e
la
ti
ve q
u
an
ti
ty
A
-6 -4 -2 0 2 4 6 8 10
PCO Galsynt BKCoAS HSP17
R
e
la
ti
ve q
u
an
ti
ty
B
-8 -6 -4 -2 0 2 4 6 8 10 12
PCO Galsynt BKCoAS HSP17
Re
la
ti
v
e
q
u
a
n
ti
ty
[image:9.595.58.542.88.493.2]C
assistance in the choice of candidates. We used plants submitted to water and heat stresses, as well as a com-bination of both. Six genes that presented high levels of stability in the microarray were tested in RT-qPCR, as well as two other genes commonly used in RT-qPCR data normalisation. Through the use of GeNorm, Norm-Finder and ΔCq methods, we obtained three possible reference gene combinations: act + ubiq; TIF + TIF-GTP
and PADCP + act. With regards in obtaining the best
combination of genes resulting from the analysis with the different softwares and methods, it was not possible to appoint a single optimal combination lining off from the others. All combinations of reference genes were able to normalise the putative stress markers; but not without flaw. Therefore we can conclude that any of the combinations tested is suitable to be used as reference for RT-qPCR data normalisation of grapevine leaf sam-ples under abiotic stress; we prove that microarray ana-lysis can be a powerful tool to obtain reference genes. When microarrays are not available some of the most commonly used references (act and ubiq) are in fact good options, but this choice must be taken with caution because some are not (e.g. L2). The careful testing of reference genes also comes out as paramount when compared to the test method. In fact, the three alterna-tives evaluated here performed equally well.
Methods
Greenhouse plant material and stress treatments
Cuttings from pruned wood of pre-selected plants of the variety Trincadeira were grown in pots in the green-house under the following controlled conditions: 200 μmol quanta m-2s-1irradiance, 16 h light/8 h dark photoperiod, temperature of 25°C day/ 23°C night and well watered with nutrient solution whenever necessary.
Individual stresses were applied when shoots were 50 to 60 cm high. The stresses applied were: HS – 1 hour at 42°C; WS – stop irrigation until the pre dawn leaf water potential (Ψw) was−0.9 MPa and WSHS–a com-bination of both. Ψw was measured with a pressure chamber, Model 600, PMS Instruments Company (Al-bany, OR). Samples consisted of the third, fourth and fifth totally expanded leaves and were taken immediately after the end of the stress (or, in the case of WS, after the measurement of the pre dawn leafΨw), frozen in li-quid nitrogen and stored at−80°C until RNA extraction. Total RNA extraction and cDNA synthesis
Samples were ground with a mortar and pestle in the presence of liquid nitrogen. Total RNA was extracted with the RNA Plant Total RNA Kit (Sigma-Aldrich, Inc) following the manufacturer’s instructions. Nucleic acid concentration of each sample was quantified by spectro-photometry using the software Gen5 1.09 (Synergy HT,
Bio-Tek Instruments, Winooski, USA). Total RNA qual-ity was assessed using the A260/A280and A260/A230. Only RNA samples with A260/A280 between 1.8 and 2.1 and A260/A230between 2.0 and 2.2 were used. Total RNA in-tegrity was checked through 1% agarose gel electrophor-esis under denaturing conditions.
RNA samples were treated with RQ1 RNase-Free DNase (Promega, Madison, WI). cDNA was synthesized from 2 μg of total RNA using oligo(dT)20 in a 20 μ L-reaction volume using RevertAid Reverse Transcriptase (Fermentas Life Science, Helsingborg, Sweden) according to the manufacturer’s recommendations. cDNA was tested for gDNA contamination in PCRs using the intron span-ning primersubiq(Table 2) that yield a 229 bp amplicon in cDNA and a 547 amplicon in gDNA. Amplicon sizes were compared in 2% agarose gels together with the mo-lecular weight marker 1Kb + (Invitrogen) and no gDNA contamination was detected. cDNA was stored at −20°C until further use.
Selection of reference genes and primer design
The selection of the possible reference genes for RT-qPCR was made based on a previous microarray analysis per-formed with two biological replicates for each experimen-tal condition (data not shown) using a 23 096 unigene sequences array [39] based on the lower fold-change, function, category and presence in all replicates. The fold-change chosen was within the interval of −1.25 to 1.25, which is the smallest interval where sufficient possible reference genes could still be detected. The possible refe-rence genes were selected from this pool, taking into ac-count their category and function in order to obtain a mix of genes. This included members of families commonly used as reference genes in RT-qPCR data normalisation and other putative genes which do not have a clearly described function or which function remains unknown in grapevine but nevertheless displayed high stability on the microarray analysis. Six possible reference genes were selected from this group and two typically used reference genes were added to the study for comparison, act (AF369525.1) andL2(AJ441290.2).
Primers for these eight putative reference genes were designed using the software Primer Premier 5.0 (Premier Biosoft International) using a primer length of 20 ± 2 bp, melting temperature of 60°C ± 2°C, a guanine-cytosine content of circa 50% and an expected amplicon size of 180–280 bp.
Real-Time PCR
50-fold, 0.5 μM of each gene-specific primer and 10 μL master mix (SsoFast_EvaGreen Supermix, Bio-Rad, Hercules, CA). Amplification of PCR products was mon-itored via intercalation of Eva-Green (included in the master mix). The following program was applied: initial polymerase activation, 95°C, 3 min; then 40 cycles at 94°C 10 s (denaturation), 60°C 20 s (annealing), 72°C 15 s (extension). The PCR products were run on 2% agarose gels to make sure that there was only one ampli-con of the expected size. PCRs with each primer pair were also performed on samples lacking cDNA template, in triplicate (no template controls).
To assess amplification efficiency of the candidate genes, identical volumes of cDNA samples were diluted and used to generate five-point standard curves based on a five-fold dilution series (1;1:5;1:25;1:125;1:625), in triplicate. Ampli-fication efficiency (E) is calculated as E = 10(−1/a)-1, “a” being the slope of the linear regression curve (y = a log (x) + b) fitted over the log-transformed data of the input cDNA dilution (y) plotted against the respective quantifi-cation cycle (Cq) values (x). E-values of the target genes were considered comparable when they did not exceed 100 ± 10%, corresponding to a standard curve slope of 3.3 ± 0.33. All cDNA samples were diluted 50 fold and were amplified in duplicate in two independent PCR runs.
To generate a baseline-subtracted plot of the logarith-mic increase in fluorescence signal (ΔRn) versus cycle number, baseline data were collected between the cycles 5 and 17. All amplification plots were analysed with an Rnthreshold of 0.2, at the beginning of the region of ex-ponential amplification, to obtain Cq (quantification cycle) and the data obtained were exported into a MS Excel workbook (Microsoft Inc.) for further analysis.
Statistical analysis
For the relation between the expressions of the different marker genes with the different best combination genes the relative quantity values were transformed into log2 (thus rendering them parametric) and tested through ANOVA in the program SAS 9 for Windows, SAS Insti-tute Inc., Cary, NC, USA. When the p value of the ANOVA was lower than 0.05 a Tukey test was per-formed and statistically significant differences were accepted for a p value lower than 0.05.
Competing interests
All authors declare they have no financial or non-financial competing interests.
Authors' contributions
JLC selection of the criteria to retrieve the reference genes from the microarray; statistical analysis; experimental greenhouse and lab work; MR statistical analysis of the Grapegen Affymetrix microarray; LC Application of the softwares andΔCq method; writing the manuscript; SA project PI; revision of the manuscript. All authors read and approved the final manuscript.
Acknowledgements
The authors thank Prof. Leonor Morais for critical reading of the manuscript and Frederic Cobb for revising the English writing. The research was funded by Fundação para a Ciência e Tecnologia (FCT): project PTDC/AGR-GPL/ 099624/2008 that includes a reaserch grant to JLC; CBAA (PestOE/AGR/ UI0240/2011), and the post-doc grant SFRH/BPD/64905/2009 to MR.
Received: 31 January 2012 Accepted: 18 April 2012 Published: 7 May 2012
References
1. Bustin SA, Benes V, Nolan T, Pfaffl MW:Quantitative real-time RT-PCR–a perspective.J Mol Endocrinol2005,34:597–601.
2. Gachon C, Mingam A, Charrier B:Real-time PCR: what relevance to plant studies?J Exp Bot2004,55:1445–1454.
3. Ginzinger DG:Gene quantification using real-time quantitative PCR: an emerging technology hits the mainstream.Exp Hematol2002,30:503–512. 4. Guénin S, Mauriat M, Pelloux J, Van Wuytswinkel O, Bellini C, Gutierrez L:
Normalization of qRT-PCR data: the necessity of adopting a systematic, experimental conditions-specific, validation of references.J Exp Bot2009, 60:487–493.
5. Czechowski T, Stitt M, Altmann T, Udvardi MK:Genome-Wide Identification and Testing of Superior Reference Genes for Transcript Normalization.
Plant Physiol2005,139:5–17.
6. Vandesompele J, De Preter K, Pattyn F, Poppe B, Van Roy N, De Paepe A, Speleman F:Accurate normalization of real-time quantitative RT-PCR data by geometric averaging of multiple internal control genes.Genome Biol2002,3:research0034.1–research0034.11.
7. Barsalobres-Cavallari CF, Severino FE, Maluf MP, Maia IG:Identification of suitable internal control genes for expression studies inCoffea arabica under different experimental conditions.BMC Mol Biol2009,10:1. 8. Artico S, Nardeli SM, Brilhante O, Grossi-de-Sa MF, Alves-Ferreira M:
Identification and evaluation of new reference genes inGossypium hirsutumfor accurate normalization of real-time quantitative RT-PCR data.BMC Plant Biol2010,10:49.
9. Derveaux S, Vandesompele J, Hellemans J:How to do successful gene expression analysis using real-time PCR.Methods2010,50:227–230. 10. Bustin SA, Beaulieu J-F, Huggett J, Jaggi R, Kibenge FSB, Olsvik PA, Penning
LC, Toegel S:MIQE précis: Practical implementation of minimum standard guidelines for fluorescence-based quantitative real-time PCR experiments.BMC Mol Biol2010,11:74.
11. Huggett J, Dheda K, Bustin S, Zumla A:Real-time RT-PCR normalisation; strategies and considerations.Genes Immun2005,6:279–284.
12. Bustin SA, Nolan T:Pitfalls of quantitative real-time reverse-transcription polymerase chain reaction.J Biomol Tech2004,15:155–166.
13. Dheda K, Huggett JF, Chang JS, Kim LU, Bustin SA, Johnson MA, Rook GAW, Zumla A:The implications of using an inappropriate reference gene for real-time reverse transcription PCR data normalization.Anal Biochem
2005,344:141–143.
14. Olsvik PA, Lie KK, Jordal A-EO, Nilsen TO, Hordvik I:Evaluation of potential reference genes in real-time RT-PCR studies of Atlantic salmon.BMC Mol Biol2005,6:21.
15. Hu R, Fan C, Li H, Zhang Q, Fu Y-F:Evaluation of putative reference genes for gene expression normalization in soybean by quantitative real-time RT-PCR.BMC Mol Biol2009,10:93.
16. Thellin O, Zorzi W, Lakaye B, De Borman B, Coumans B, Hennen G, Grisar T, Igout A, Heinen E:Housekeeping genes as internal standards: use and limits.J Biotechnol1999,75:291–295.
17. Brunner AM, Yakovlev IA, Strauss SH:Validating internal controls for quantitative plant gene expression studies.BMC Plant Biol2004,4:14. 18. Andersen CL, Jensen JL,rntoft TF:Normalization of real-time
quantitative reverse transcription-PCR data: a model-based variance estimation approach to identify genes suited for normalization, applied to bladder and colon cancer data sets.Cancer Res2004, 64:5245–5250.
19. Condori J, Nopo-Olazabal C, Medrano G, Medina-Bolivar F:Selection of reference genes for qPCR in hairy root cultures of peanut.BMC Res Notes2011,4:392. 20. Demidenko NV, Logacheva MD, Penin AA:Selection and Validation of
21. Pellino M, Sharbel TF, Mau M, Amiteye S, Corral JM:Selection of reference genes for quantitative real-time PCR expression studies of
microdissected reproductive tissues in apomictic and sexual Boechera.
BMC Res Notes2011,4:303.
22. Paolacci AR, Tanzarella OA, Porceddu E, Ciaffi M:Identification and validation of reference genes for quantitative RT-PCR normalization in wheat.BMC Mol Biol2009,10:11.
23. Reid KE, Olsson N, Schlosser J, Peng F, Lund ST:An optimized grapevine RNA isolation procedure and statistical determination of reference genes for real-time RT-PCR during berry development.BMC Plant Biol2006,6:27. 24. Obrero A, Die JV, Román B, Gómez P, Nadal S, González-Verdejo CI:
Selection of reference genes for gene expression studies in zucchini (Cucurbita pepo) using qPCR.J Agric Food Chem2011,59:5402–5411. 25. Martin RC, Hollenbeck VG, Dombrowski JE:Evaluation of Reference Genes
for Quantitative RT-PCR inLolium perenne.Crop Sci1881,2008:48. 26. Nicot N, Hausman J-F, Hoffmann L, Evers D:Housekeeping gene selection
for real-time RT-PCR normalization in potato during biotic and abiotic stress.J Exp Bot2005,56:2907–2914.
27. Selim M, Legay S, Berkelmann-Löhnertz B, Langen G, Kogel K-H, Evers D: Identification of suitable reference genes for real-time RT-PCR normalization in the grapevine-downy mildew pathosystem.Plant Cell Rep2011,31:205–216.
28. Wan H, Yuan W, Ruan M, Ye Q, Wang R, Li Z, Zhou G, Yao Z, Zhao J, Liu S, Yang Y:Identification of reference genes for reverse transcription quantitative real-time PCR normalization in pepper (Capsicum annuum L.).
Biochem Biophys Res Commun2011,416:24–30.
29. Tong Z, Gao Z, Wang F, Zhou J, Zhang Z:Selection of reliable reference genes for gene expression studies in peach using real-time PCR.BMC Mol Biol2009,10:71.
30. Jain M, Nijhawan A, Tyagi AK, Khurana JP:Validation of housekeeping genes as internal control for studying gene expression in rice by quantitative real-time PCR.Biochem Biophys Res Commun2006,345:646–651.
31. Kim B-R, Nam H-Y, Kim S-U, Kim S-I, Chang Y-J:Normalization of reverse transcription quantitative-PCR with housekeeping genes in rice.
Biotechnol Lett2003,25:1869–1872.
32. Yan J, Yuan F, Long G, Qin L, Deng Z:Selection of reference genes for quantitative real-time RT-PCR analysis in citrus.Mol Biol Rep2011, 39:1831–1838.
33. Remans T, Smeets K, Opdenakker K, Mathijsen D, Vangronsveld J, Cuypers A: Normalisation of real-time RT-PCR gene expression measurements in Arabidopsis thalianaexposed to increased metal concentrations.Planta
2008,227:1343–1349.
34. Libault M, Thibivilliers S, Bilgin DD, Radwan O, Benitez M, Clough SJ, Stacey G:Identification of Four Soybean Reference Genes for Gene Expression Normalization.Plant Genome J2008,1:44.
35. Hruz T, Wyss M, Docquier M, Pfaffl MW, Masanetz S, Borghi L, Verbrugghe P, Kalaydjieva L, Bleuler S, Laule O, Descombes P, Gruissem W, Zimmermann P: RefGenes: identification of reliable and condition specific reference genes for RT-qPCR data normalization.BMC Genomics2011,12:156. 36. Gamm M, Héloir M-C, Kelloniemi J, Poinssot B, Wendehenne D, Adrian M:
Identification of reference genes suitable for qRT-PCR in grapevine and application for the study of the expression of genes involved in pterostilbene synthesis.Mol Genet Genomics2011,285:273–285. 37. Jones GV, White MA, Cooper OR, Storchmann K:Climate Change and
Global Wine Quality.Clim Chang2005,73:319–343. 38. Carvalho LC, Vilela BJ, Mullineaux PM, Amâncio S:Comparative
Transcriptomic Profiling ofVitis viniferaUnder High Light Using a Custom-Made Array and the Affymetrix GeneChip.Mol Plant2011, 4:1038–1051. In press.
39. Pontin MA, Piccoli PN, Francisco R, Bottini R, Martinez-Zapater JM, Lijavetzky D:Transcriptome changes in grapevine (Vitis vinifera L.) cv. Malbec leaves induced by ultraviolet-B radiation.BMC Plant Biol2010,10:224. 40. Kumar Tewari A, Charan Tripathy B:Temperature-stress-induced
impairment of chlorophyll biosynthetic reactions in cucumber and wheat.Plant Physiol1998,117:851–858.
41. Saravitz DM, Pharr DM, Carter TE:Galactinol synthase activity and soluble sugars in developing seeds of four soybean genotypes.Plant Physiol
1987,83:185–189.
42. Taji T, Ohsumi C, Iuchi S, Seki M, Kasuga M, Kobayashi M, Yamaguchi-Shinozaki K, Yamaguchi-Shinozaki K:Important roles of drought- and cold-inducible
genes for galactinol synthase in stress tolerance in Arabidopsis thaliana.
Plant J2002,29:417–426.
43. Lee S-B, Jung S-J, Go Y-S, Kim H-U, Kim J-K, Cho H-J, Park OK, Suh M-C:Two Arabidopsis 3-ketoacyl CoA synthase genes, KCS20 and KCS2/DAISY, are functionally redundant in cuticular wax and root suberin biosynthesis, but differentially controlled by osmotic stress.Plant J2009,60:462–475. 44. Kim DH, Xu Z-Y, Na YJ, Yoo Y-J, Lee J, Sohn E-J, Hwang I:Small heat shock
protein Hsp17.8 functions as an AKR2A cofactor in the targeting of chloroplast outer membrane proteins in Arabidopsis.Plant Physiol2011, 157:132–146.
45. Queitsch C, Hong SW, Vierling E, Lindquist S:Heat shock protein 101 plays a crucial role in thermotolerance in Arabidopsis.Plant Cell2000, 12:479–492.
46. Løvdal T, Lillo C:Reference gene selection for quantitative real-time PCR normalization in tomato subjected to nitrogen, cold, and light stress.
Anal Biochem2009,387:238–242.
doi:10.1186/1756-0500-5-220
Cite this article as:Coitoet al.:Microarray-based uncovering reference genes for quantitative real time PCR in grapevine under abiotic stress.
BMC Research Notes20125:220.
Submit your next manuscript to BioMed Central and take full advantage of:
• Convenient online submission
• Thorough peer review
• No space constraints or color figure charges
• Immediate publication on acceptance
• Inclusion in PubMed, CAS, Scopus and Google Scholar
• Research which is freely available for redistribution