RESEARCH NOTE
Self-organizing scale-free patterns
in a phase-modulated periodic connecting
system
Tsutomu Matsunaga
1*and Masaaki Muramatsu
2Abstract
Objective: The regularity of scale-free patterns in rank-size relations has been observed in word frequency, city size distribution, firm size distribution, and gene expression. Because of the common emergence of this regularity, under-standing its mechanisms has been of great interest. For obtaining the scale-free pattern regularity, various models based on the rich-get-richer mechanism have been proposed; however, the overarching procedure of searching for the “rich” is in disagreement with the locally interacting behaviors seen in the aforementioned natural and social phenomena.
Results: We implemented a computational model of a resource distribution system inspired by observations of word connectivity, which is created by local constraints with periodic and phase modulatory features. Here, we empirically demonstrated that a phase-modulated periodic connecting system can reach a dynamic equilibrium state as the most probable case, with the self-organizing scale-free patterns. The regularity could be a result of the configurational balance in spatiotemporal inequity during the resource distribution process with an adaptive constrained connectiv-ity. Our results suggest that investigations of interferences of oscillating fluctuations in the system will elucidate the autoregulatory dynamic behavior.
Keywords: Self-organizing scale-free pattern, Dynamic equilibrium state, Oscillating fluctuation
© The Author(s) 2019. This article is distributed under the terms of the Creative Commons Attribution 4.0 International License (http://creat iveco mmons .org/licen ses/by/4.0/), which permits unrestricted use, distribution, and reproduction in any medium, provided you give appropriate credit to the original author(s) and the source, provide a link to the Creative Commons license, and indicate if changes were made. The Creative Commons Public Domain Dedication waiver (http://creat iveco mmons .org/ publi cdoma in/zero/1.0/) applies to the data made available in this article, unless otherwise stated.
Introduction
The regularity of scale-free patterns [1] has been observed in word frequency [2], city size distribution [3], firm size distribution [4], gene expression [5], and hyper-links on the World Wide Web [6]. According to this regu-larity, rank-size relations could be exhibited for which the frequencies of words or the populations of cities follow the same pattern in relation to their rank on a list. The emergence of global regularity is considered the outcome of collective behaviors in an open system that consists of a set of many locally interacting elements [7, 8]. In a sys-tem that has a continuous external energy supply, regu-larity can be observed when the system reaches a stable state, which is a balance between the energy supplied
from outside the system and the energy dissipated inside the system [9, 10]. The balance can be implemented by the effects of fluctuations amplified through chain reac-tions [11] among the interacting elements in a competi-tive manner [12]. Although the system can spontaneously reach and adaptively self-sustain the stable state [13], understanding the self-organizing behaviors has been of great interest [14, 15].
For regularity, the network model based on the rich-get-richer mechanism [16] was developed in a study of the formation of the World Wide Web network [17] by Barabási and Albert (called the BA model). In the BA model, network node distributions provide scale-free patterns with network growth settings, where a succes-sively increasing node preferentially links to a node hav-ing a larger link. Since then, various models based on the rich-get-richer mechanism have been proposed [18,
19]. However, the overarching procedure of searching for the “rich” (called the “hub” in network models) is in
Open Access
*Correspondence: [email protected]
1 Research and Development Headquarters, NTT DATA Corporation, 3-3-9, Toyosu, Koto-ku, Tokyo 135-8671, Japan
Page 2 of 8 Matsunaga and Muramatsu BMC Res Notes (2019) 12:122
disagreement with the behaviors of locally interacting elements observed in the aforementioned natural and social phenomena [20]. To understand the behaviors of a dynamic system, we implemented a computational model for the distribution of resources [21] such as words, peo-ple, and money. Then, we explored whether the recursive process of a resource distribution system can reach a sta-ble state with the regularity of scale-free patterns.
Main text
Results and discussion
Word connectivity in text
We first took words as elements and analyzed the text of the Online Mendelian Inheritance in Man (OMIM) data-base [22] as an example of a resource distribution sys-tem. The OMIM text, which contains 268,006 words and a total word frequency of 15,358,228, was analyzed for connectivity [23] between the words and the subsequent words (see "Methods"). The distributions of words and their connection frequencies are shown in Additional file 1: Figure S1. As expected, the word frequency distri-bution exhibits a clear linearity on a log-log plot (Addi-tional file 1: Figure S1a), and the scaling exponent (see "Methods") was confirmed to be about one. As the top 20 words (Additional file 1: Table S1a) show, the number of connections is not associated with the word frequency. Interestingly, the connection frequency also exhibits a linear-like relation (Additional file 1: Figure S1b), sug-gesting that only a few of the combinations can have large connection frequencies. As observed for the top 20 most frequent connections (Additional file 1: Table S1b), word connections are created by local constraints such as compounds, stock phrases, and grammatical rules. These indicate that words are connected by an adaptive regula-tion with periodic and phase modulatory features.
Rank‑size relations of resource distribution systems
Considering that the connectivity can give rise to the appearance of the scale-free pattern regularity, we implemented two types of resource distribution systems employing the urn model [24]: a periodic connecting sys-tem and a phase-modulated periodic connecting syssys-tem. In the systems, balls were randomly set in urns arranged in a horizontal number line. In the periodic connecting system, an urn from which a ball is taken and an urn to which the ball is moved, were chosen by a one-dimen-sional periodical mapping devised by a linear congru-ential generator [25]. In the phase-modulated periodic connecting system, the urn to which a ball is moved, was adaptively regulated to be an adjacent urn to the right or left of the urn from which the ball is taken, by suc-cessively utilizing the one-dimensional periodical map-ping (see "Methods" for the procedures of the systems).
By using the urn model, a set of urns and the balls in the urns respectively represent the elements and the energy of the elements [26].
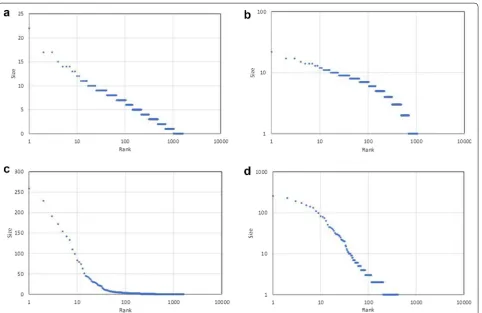
Figure 1 shows the rank-size relations for the case of a total of 3200 balls and 1600 urns at the 25-millionth iter-ation. The periodic connecting system corresponds to a closed system of particle elements studied in the field of equilibrium statistical mechanics [10, 26] when the urn choices by the one-dimensional periodical mapping are regarded as being pseudo-random. The appearance of the linearity in the log-linear plot (Fig. 1a) is in agreement with studies where a system has reached and sustained a thermodynamic equilibrium state as the most prob-able case, having an exponential distribution (known as the Boltzmann distribution) for the energy distribution of oscillating particles through energy exchange among particles [26]. By introducing the phase-modulation, the near linearity in the log-log plot (Fig. 1d) is observed ( (scaling exponent) = 1.15 and R2=0.957 ),
indicat-ing the emergence of the scale-free pattern regularity. The scaling exponent and adjusted R2 (see "Methods")
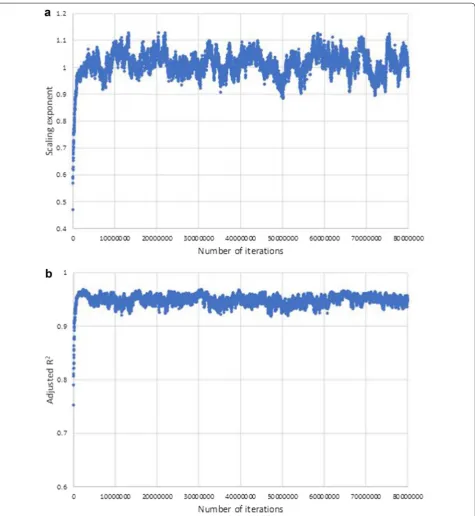
of the phase-modulated periodic connecting system are stable after about the 5-millionth iteration at around one (Fig. 2a) and greater than 0.9 (Fig. 2b), indicating that a dynamic equilibrium state with the formation of scale-free patterns has been self-sustained.
Dynamic behavior of the phase‑modulated periodic connecting system
To grasp the state transitions of ball distributions for the phase-modulated periodic connecting system, we studied the dynamic behaviors of the numbers of balls in the urns arranged in numerical order. Additional file 1: Figure S2 represents the numbers of balls as bar lengths for the case of a total of 500 balls and 250 urns. From the ini-tial setting in which the numbers of balls in the urns are almost the same (Additional file 1: Figure S2a), the ball movements create such a heterogeneity [27] that balls are admeasured into the modules [28] of the arranged urns (Additional file 1: Figure S2b), and a few urns with large numbers of balls have co-appeared with the larger dispar-ity (Additional file 1: Figure S2c). See Additional file 2: Movie S1 for five million iterations.
(Fig. 3a) are scattered, and the relations of the balls with the urns are independent, the plots of the phase-mod-ulated periodic connecting system (Fig. 3b) show a belt-like relationship, indicating that the balls have suc-cessively circulated among their associated urns. This observation is reminiscent of the entrained synchroni-zation of interacting phase-modulated oscillators [30], taking the moving balls as oscillators. We infer that the resonance phenomenon [31] arising in the synchronized ball movement could be relevant to the emergence of scale-free pattern regularity.
The systems we have studied are the so-called com-plex systems whose behaviors are determined by the current states of the system, and the behaviors define
[image:3.595.60.543.86.399.2]Page 4 of 8 Matsunaga and Muramatsu BMC Res Notes (2019) 12:122
Methods
Computational models of resource distribution systems
Two types of resource distribution systems, a periodic connecting system and a phase-modulated periodic
connecting system, were implemented by employing the urn model [24]. The procedure for the periodic connect-ing system is as follows:
Fig. 2 Changes in the a scaling exponent and b adjusted R2 of the phase-modulated connecting system (N= 3200, K= 1600) over 80 million
[image:4.595.63.539.86.603.2]Nballs are randomly placed inKurnsm(i)(i 1, ,K) loop
The urnm(ir)from which a ball is taken is calculated by a one-dimensional periodical mapping
whilethe number of balls inm(ir) 0do
A randomly chosen ball in urn m(ir) is moved to an urn calculated by a one-dimensional periodical mapping
end while end loop
[image:5.595.62.537.89.472.2]Page 6 of 8 Matsunaga and Muramatsu BMC Res Notes (2019) 12:122
The procedure for the phase-modulated periodic con-necting system is as follows:
Nballs are randomly placed inKurnsm(i)(i=1,· · ·,K) loop
The urnm(im)from which a ball is taken is calculated by a one-dimensional periodical mapping
whilethe number of balls inm(im)>0do
A numberpm(0≤pm<1) is produced using a one-dimensional periodical mapping
if pm<0.5then
A randomly chosen ball in urnm(im)is moved to an adjacent urnm(im+1)
else if pm≥0.5then
A randomly chosen ball in urnm(im)is moved to an adjacent urnm(im−1) end if
end while end loop
In these systems, a ball can be moved from one urn to another during an iteration. The difference between the two systems is the introduction of a simple adaptive reg-ulation of urn choices in the phase-modulated periodic connecting system. When an adjacent urn has no corre-sponding urn beyond the boundary, a ball is placed into an urn of another boundary in a circular manner.
A one-dimensional periodical mapping is implemented by adopting a linear congruential generator [25], which is often used to generate pseudo-random numbers. Num-bers Pk of period M can be generated successively by
The modM denotes a remainder operation with M. For example, numbers Pk of period M=16 are
by setting a=5,c=1,P0=1 . As shown above, every number from zero to M−1 cyclically appears once in a period. In the experiments, a one-dimensional periodi-cal mapping of period M=32768 was used by setting
a=12869 , c=6925 , P0=137.
The urn m(ir,m)(1≤m(ir,m)≤K ) is calculated by the range transformation as follows:
The number pm(0≤pm<1 ) in the phase-modulated periodic connecting system is provided by dividing Pm
(0≤Pm<M ) by M.
Analysis of word connectivity in text
An analysis was performed using the Online Mende-lian Inheritance in Man (OMIM) database [22], which is a well-known catalog of human genetic and generic disorders. The text for analysis was taken from a set of “*FIELD* TX” parts of the disease and gene descriptions with the entries numbered from #100050 to #613763 (as
Pk=(a×Pk−1+c)modM a,c,M:constant
6, 15, 12, 13, 2, 11, 8, 9, 14, 7, 4, 5, 10, 3, 0, 1, 6, 15, 12,. . .
m(ir,m)=K×(Pk/M)+1
of March 2017). The number of words and the total word frequency are 268,006 and 15,358,228, respectively. Here,
words are counted including isolated punctuation char-acters such as commas, full stops, and parentheses. The connections between words were acquired by extracting their adjacent occurrences while ignoring punctuation. Then, the connection frequencies were established by counting the number of connections between the words and the subsequent words. The different connections resulted in 2,192,828 combinations, which correspond to 0.0031% of all possible combinations (268,006 × 268,006 combinations).
Analysis of scale‑free pattern regularity
For n values observed for some phenomenon,
X= {x1,x2,· · ·,xn} (x1≥x2≥ · · · ≥xn>0 ), the
rela-tion between X and rank N
gives the regularity of scale-free patterns, i.e., the so-called power law (so-called Zipf’s law for word frequency when =1) [1]. Here, (>0 ) is a scaling exponent.
Scale-free patterns are identified when the rank-size relation forms a straight line on a graph with logarith-mic axes. The scaling exponent is estimated by least-squares regression in log–log coordinates. The degree to which the targeted distribution follows the regularity is quantified by using the adjusted R2 (0≤R2≤1 ), which indicates the degree of approximation [4]. A value of R2
greater than 0.7 is considered a good approximation, and it approaches one for a well-approximated distribution.
Correspondence analysis
Correspondence analysis [29] is a method used to analyze the relations between variables called cases and items. This analysis yields an arrangement in which similar cases and items are placed close to each other. By intro-ducing a data matrix whose rows and columns are vari-ables (cases and items) with element values depending
on the relations between the variables, the rows (items) and columns (cases) are arranged by sorting the scores calculated using the second-largest eigenvalue and the corresponding eigenvector. In the work presented in this paper, items and cases respectively represent balls and urns. The data matrix contains values of the frequencies of the urns to which balls have been moved.
Limitations
While providing evidence using a decentralized mecha-nism due to an adaptive constrained connectivity for yielding the scale-free pattern regularity, the current study could not include investigations regarding the con-sistency of the connectivity with actual dynamics of word occurrences and people movements. Additionally, we do not report on the statistical test [33] for forming power-law distributions, although we have examined scale-free pattern formation using the adjusted R2 in least-squares
fitting.
Additional files
Additional file 1: Table S1a. The 20 most frequent words in the OMIM text (terms are sorted in descending order according to their frequencies).
Table S1b. The 20 most frequent connections in the OMIM text
(con-nections are sorted in descending order according to their frequencies).
Figure S1. A rank-ordered frequency distribution in the OMIM text: (a)
word frequency and (b) connection frequency. The least-squares fitting of the word frequency plot yields λ (scaling exponent) = 1.26 and R2= 0.993 to obey Zipf’s law. For the connection frequency plot, λ (scaling expo-nent) = 0.909 and R2= 0.988 are obtained. Figure S2. Examples of distrib-uting a resource of the phase-modulated connecting system for the case of a total of 500 balls and 250 urns (N= 500, K = 250): (a) initial setting, (b) after 0.5 million iterations, and (c) after 4.8 million iterations. The vertical bars show the number of balls in the 250 urns. The ball movements create such a heterogeneity that balls are admeasured into the three modules which are around 20, 100, and 180 of the numbered urns (b), and then a few urns with larger numbers of balls have co-appeared (c).
Additional file 2: Movie S1. Visualization of distributing a resource of the phase-modulated connecting system for the case of a total of 500 balls and 250 urns (N = 500, K = 250). The bar lengths show the number of balls in the urns. The dynamic changes in the numbers of balls are shown up to five million iterations. A few urns having large numbers of balls co-appeared through the ball movement process, whereas the numbers of balls in the other urns were small and fluctuated during iterations.
Authors’ contributions
TM and MM designed the research. TM analyzed the data. TM and MM wrote the paper. Both authors read and approved the final manuscript.
Author details
1 Research and Development Headquarters, NTT DATA Corporation, 3-3-9, Toyosu, Koto-ku, Tokyo 135-8671, Japan. 2 Medical Research Institute, Tokyo Medical and Dental University, 1-5-45, Yushima, Bunkyo-ku, Tokyo 113-8510, Japan.
Acknowledgements
T. Matsunaga—currently seconded to the Japan Science and Technology Agency.
Competing interests
The authors declare that they have no competing interests.
Availability of data and materials
The datasets generated and analyzed during this study are available from the corresponding author upon reasonable request.
Consent to publish Not applicable.
Ethics approval and consent to participate Not applicable.
Funding None.
Received: 16 October 2018 Accepted: 22 February 2019
References
1. Newman MEJ. Power laws, Pareto distributions and Zipf’s law. Contemp Phys. 2005;46(5):323–51.
2. Zipf GK. Selected studies of the principle of relative frequency in lan-guage. Cambridge: Harvard Univ. Press; 1932.
3. Rosen KT, Resnick M. The size distribution of cities: an examination of the Pareto law and primacy. J Urban Econ. 1980;8(2):165–86.
4. Axtell RL. Zipf distribution of US firm sizes. Science. 2001;293(5536):1818–20.
5. Ueda HR, Hayashi S, Matsuyama S, Yomo T, Hashimoto S, Kay SA, Hogenesch JB, Iino M. Universality and flexibility in gene expression from bacteria to human. Proc Natl Acad Sci USA. 2004;101(11):3765–9. 6. Albert R, Jeong H, Barabási AL. Diameter of the World-Wide Web. Nature.
1999;401:130–1.
7. Buchanan M. Ubiquity: why catastrophes happen. New York: Three Rivers; 2000.
8. Johnson S. Emergence: the connected lives of ants, brains, cities. New York: Scribner; 2001.
9. Prigogine I. Order through fluctuation: self-organization and social system. London: Addison-Wesley; 1976.
10. England JL. Dissipative adaption in driven self-assembly. Nat Nanotech-nol. 2015;10:919–23.
11. Eigen M, Schuster P. The hypercycle: a principle of natural self-organiza-tion. New York: Springer; 1979.
12. Kauffman SA. The origins of order: self-organization and selection in evolution. Oxford: Oxford University Press; 1993.
13. Bak P, Tang C, Wiesenfeld K. Self-organized criticality. Phys Rev A Gen Phys. 1988;38(1):364–74.
14. Mitzenmacher M. Editorial: the future of power law research. Internet Math. 2005;2(4):525–34.
15. Barabási AL. Network science: luck or reason. Nature. 2012;489:507–8. 16. Simon H. On a class of skew distribution functions. Biometrika.
1955;42(3–4):425–40.
17. Barabási AL, Albert R. Emergence of scaling in random networks. Science. 1999;286(5439):509–12.
18. Goldwater S, Griffiths TL, Johnson M. Interpolating between types and tokens by estimating power-law generators. Adv Neural Inf Process Syst. 2006;18:459–66.
19. Simkin MV, Roychowdhury VP. Re-inventing Willis. Phys Rep. 2011;502(1):1–35.
20. Klarreich E. Scant evidence of power laws found in real-world networks. Quanta Magazine. Feb 15, 2018.
21. Sayama H, Pestov I, Schmidt J, Bush BJ, Wong C, Yamanoi J, Gross T. Modeling complex systems with adaptive networks. Comput Math Appl. 2013;65(10):1645–64.
Page 8 of 8 Matsunaga and Muramatsu BMC Res Notes (2019) 12:122
•fast, convenient online submission •
thorough peer review by experienced researchers in your field • rapid publication on acceptance
• support for research data, including large and complex data types •
gold Open Access which fosters wider collaboration and increased citations maximum visibility for your research: over 100M website views per year •
At BMC, research is always in progress.
Learn more biomedcentral.com/submissions
Ready to submit your research? Choose BMC and benefit from: 23. Matsunaga T, Kuwata S, Muramatsu M. Empirical analysis of scale-free
patterns of connectivity in medical term occurrence. Jpn Soc Fuzzy Theor Intell Inform. 2015;27(2):616–20.
24. Tria F, Loreto V, Servedio VDP, Strogatz SH. The dynamics of correlated novelties. Sci Rep. 2014;4:5890.
25. Tang HC. Modulus of linear congruential random number generator. Qual Quant. 2005;39(4):413–22.
26. Sharda V, Bhardwaj J, Sastri OSKS, Jha A. Learning to construct Boltzmann distribution concept: using computer simulation activity. In: International education conference. 2015 Feb: IEC15-1181.
27. Ediger MD. Spatially heterogeneous dynamics in supercooled liquids. Annu Rev Phys Chem. 2000;51:99–128.
28. Pritykin Y, Singh M. Simple topological features reflect dynamics and modularity in protein interaction networks. PLoS Comput Biol. 2013;9(10):e1003243.
29. Benzecri JP. Correnpondence analysis handbook. New York: Marcel Dek-ker; 1992.
30. Kuramoto Y. Self-entrainment of a population of coupled non-linear oscillators. In: International symposium on mathematical problems in theoretical physics. 1975;39:420–2.
31. Masoller C. Noise-induced resonance in delayed feedback systems. Phys Rev Lett. 2002;88(3):034102.
32. Dorigo M, Bonabeau E, Theraulaz G. Ant algorithms and stigmergy. Future Gener Comput Syst. 2000;16(8):851–71.