Rochester Institute of Technology
RIT Scholar Works
Theses Thesis/Dissertation Collections
7-2010
Optimizing and Benchmarking Returnable
Container Processes within an Automotive
Distribution System
Camille Chism
Follow this and additional works at:http://scholarworks.rit.edu/theses
Part of theIndustrial Engineering Commons
This Thesis is brought to you for free and open access by the Thesis/Dissertation Collections at RIT Scholar Works. It has been accepted for inclusion in Theses by an authorized administrator of RIT Scholar Works. For more information, please [email protected].
Recommended Citation
Optimizing and Benchmarking Returnable
Container Processes within an Automotive
Distribution System
Camille Chism, CPP
Master of Science
Rochester Institute of Technology
Packaging Science, College of Applied Science and Technology
2 Committee signature page
Thomas Kausch (Graduate Advisor) Date
Rochester Institute of Technology – Packaging Science Professor
Jalonne L. White-Newsome Date
University of Michigan - School of Public Health Doctoral Candidate, Environmental Health Sciences
Deanna Jacobs Date
Rochester Institute of Technology – Packaging Science Graduate Program Chair
The thesis/dissertation must be signed and dated by the Department Chair and/or your Graduate Advisor before binding takes place.
3
Abstract
Optimizing/Benchmarking Returnable Container Processes within an Automotive Distribution System
An analysis of Reusable Packaging in automobile manufacturing facilities, as well
as a comparison to other industries, shows that returnable container systems are not
being fully utilized.
In this study, methods to return and track packaging materials for reuse are
examined. Issues identified through surveys and interviews are summarized, and a
recommendation to more fully utilize systems currently in place is proposed. An
evaluation based on utilizing the current system will enable us to assign a cost to
current operations, and may support an investment in improved systems and
technologies.
Most of the companies surveyed gauge functionality based on whether or not
there are shortages severe enough to stop production. This fact is determined through
Gap Analysis, Benchmarking, and Case Studies. A process by which to track losses,
costs, turnaround time, etc. of container return systems is currently not seen as a critical
function of production, consequently no justification exists for investing in upgrading
these systems.
A Closed Loop Packaging System refers to a well-defined circuit of shipping and
delivery points. This closed circuit is essential to ensure that containers flowing through
the system do not get lost (www.returnables.com). Locating and rerouting stray or
replacing lost containers can be a significant, unplanned cost related to packaging
returns. The automotive industry estimates a minimum of seven percent (7.00%) of
4
(page 5 – AIAG 2008), therefore improvements to this part of the process could result
5
Table of Contents
Page
Introduction – Standardized Packaging Return System Analysis/Review 1
Background 1
Packaging Components 4
Packaging Return Systems 5
Research Methods (Quantitative & Qualitative) 6
Sample – Methodologies to Determine Robustness of Systems 7
Measures 14
Surveys 14
Case Studies – Plant Comparisons 15
Questionnaires 22
Results 25
Standardized Container Return Statistics
Systems Ranked by Users
Comparison of Return Systems Based on Measures
Discussion 27
Reasons to Implement Return or Reuse Systems
Other Considerations
Possible Barriers or Reasons to Not Implement or Dismantle Return System
Conclusion 29
Appendices 31
6
Table of Contents (continued)
B - Additional Background 38
C - System Comparisons 39
D - Case Study Notes 41
E - Interview Notes 46
1
Introduction – Standardized Packaging Return System Analysis and Review
Closed Loop Packaging Systems are created to gain cost savings and deliver a
product as efficiently as possible to the end user. The following questions are asked to
determine the level of efficiency of a system:
• Can package return rates be measured accurately and consistently?
• How can return systems be improved with existing tracking and recording
methods?
• What are the current methods in practice?
• Do these techniques improve transit time, packaging turnaround rates, and
tracking accuracy, leading to additional cost justification of closed loop packaging
systems?
This thesis provides a quantitative comparison of packaging reuse in automotive
production by comparing the processes for return and reuse in other industries. In
addition, the factors that determine whether to use returnables and the methods and
challenges to track containers are presented.
Background
Generally, packaging designed for multiple trips is defined as reusable packaging.
Most industries refer to multi-use containers as "reusable packaging, pallets or shipping
containers." Reusable packaging is referred to as dunnage in the automotive industry,
and is used to transport and deliver parts throughout the entire distribution system. The
same package may be used for a part from the beginning of production at the supplier
2
repeatedly, returned and cycled through the system, with the intent of reducing
packaging expenditures and waste.
A Closed Loop Container System refers to a well-defined circuit of shipping and
delivery points. Returnables are defined as packaging or containers designed to be
reused in manufacturing and distribution systems. They eliminate the need to purchase
packaging which must be disposed of or placed in a landfill. Returnable containers can
be designed to be more durable than corrugated or other expendable packaging for
added protection.
Expendable packaging is usually designed and manufactured for single trips and
short-term storage. It is disposable, and made of materials such as corrugated paper,
plywood, or similar resources. The majority of products are packaged with expendable
packaging. Sometimes expendable packaging is reused or recycled, turns (i.e. number
of times packaging can be used) are less, and regular disposal of packaging materials
is necessary.
Efficient container return programs benefit companies by reducing the long term
cost of packaging. The recurring cost to purchase packaging is eliminated once the
original outlay to purchase the containers is complete. Parts are well protected,
3
Effective management of container inventories depends on the quality of data
collection, resources and priorities at each location. Robust systems facilitate record
management and asset tracking, account for volume fluctuations, reduce occurrences
of misdirected containers, and prevent locations from holding or stockpiling containers
to avoid shortages. Tracking systems may not be uniform between facilities, even
within the same division of a company that processes similar parts from the same
source.
Issues that cause a closed loop system to be less effective are:
• shrinkage due to damage
• transit times different than calculated
• banking excess parts
• not having a sufficient amount of packaging (due to an increase in
production or not enough ordered originally)
These issues lead to increased, unbudgeted costs such as non-scheduled trucks, late
shipments and line stoppages. Unbudgeted packaging costs include repacking and use
of non-standard packaging.
Returnable shipping containers should be considered a corporate asset rather
than an expensed item. Since packaging has always been considered an expense,
thinking of packaging as a long-term asset is a new idea for most packaging and
logistics professionals. Even suppliers of returnable containers usually emphasize the
4
The abstract should summarize the entire manuscript and its arguments for readers. It
Packaging Components - Definition
Per the Institute of Packaging Professionals IoPP Glossary of Packaging
Terminology: dunnage is defined as (a) any blocking, lining, strapping, tie-downs, or
similar bracing or support used to hold a load in position during shipment. In some
transport vehicles, adjustable braces and barriers are a permanent fixture.
(b) Sometimes loosely applied to cushioning materials placed into the interior of a
package to protect fragile articles from shock and vibration. (Soroka)
Returnables are packaging or containers designed to be reused in manufacturing
and distribution systems. The need to purchase disposable packaging, which must be
routed to a landfill or recycled, is eliminated or reduced. Returnable packaging can be
designed to be more durable than corrugated or other expendable packaging for added
protection and increased life through the distribution system.
Expendable packaging is generally designed and manufactured to protect products
destined for single trips and short-term storage. It needs to be disposable, made of
materials such as corrugated, plywood, paper or similar materials that can be land filled
or recycled. The majority of consumer goods are packaged with expendable packaging.
These types of products and packs are traditionally viewed in most manufacturing
industries as single use packaging. Sometimes, expendable packaging is reused or
recycled. This means that turns are fewer compared to returnable packaging, and a
regular disposal process for packaging materials must be incorporated in the lifecycle of
5
Packaging Return Systems – History
One of the first applications of packaging reuse in automotive production was put
into practice by Ford Motor Company. Ford’s Rouge Returnable Container return
department was in place as early as 1930. Parts were received in special crates so the
wood could be reused to make bumpers and running boards for vehicles (Thomas,
2001).
The use of returnable packaging increased when many companies began to use
plastic pallets and containers regularly for reuse after 1985 (Grande, 2008). Industries
incorporating returnable packaging into their manufacturing and distribution processes
include Automotive, Produce and Dairy, Beverages, Chemicals, Medical Device,
Computers/Electronics/Technology, Postal and Small Parcel Delivery, Military, and
Fiber Optic/Communications Cable. Manufacturers that do not commonly practice
container return programs are consumer based, such as end user Pharmaceutical,
Medical Device, food and consumer goods. These packs are intended to protect,
preserve and/or dispense the product directly to the end user.
Closed Loop Packaging Return Systems can be an integral part of the Lean
Manufacturing Process. Lean Manufacturing is a business system used to organize
and manage product development, operations, suppliers, and customer relations.
Business and other organizations use lean principles, practices, and tools to create
precise customer value of goods and services, with higher quality and fewer defects,
6
production. (www.lean.org) Returnable packaging fits into Lean Manufacturing because
it delivers material to customers with robust packaging that is designed to protect
specific parts while reducing expenditures. The effective use of returnable packaging
systems requires a structured and organized method that aids in part delivery; this ties
directly into the Lean Manufacturing Process.
Methods
A combination of qualitative and quantitative methods is used to evaluate
container return systems within the automotive industry. These methods are also used
to compare and contrast the systems to those of other industries.
• Quantitative Research – Non-Experimental Design and Evaluation
• Qualitative Research – Case Studies (Determination of System Robustness)
Quantitative Research
Non-Experimental Design, Comparison, and Evaluation are methods of research
which are used to determine whether a program or project researched for this thesis
follows the prescribed procedures and achieves the stated outcomes. The methods
outline existing needs and environments, i.e. Gap Analysis (C Δ V - Current vs. Vision -
where we want to be/Kanban) and Value Stream Mapping (Current State vs. Future
State) are utilized to gather information and evaluate the effectiveness of closed loop
7
Three surveys are conducted for the purpose of this thesis to identify common
characteristics, processes, cost analysis, as well as strengths and weaknesses of
returnable container systems. Using the surveys’ results, the beliefs and observations of
specific groups are identified, reported and interpreted.
Qualitative Research
Case Studies give a background of systems, development and history, and
explain current conditions as described by subject matter experts. This data is used to
give detailed feedback on existing systems. A Case Study attempts to shed light on
phenomena by studying, in-depth, a single example. The studies, obtained through
literary reviews of case studies, professional experience, and a single personal
interview, combine benchmarking, and detail the process through a Gap Analysis.
Automotive container return systems are compared to processes instituted in other
industries that are similar and manage reusable packaging programs.
Methodologies to Determine Robustness of Systems
Gap Analysis
The Gap Analysis lists, describes, and prioritizes the current state as well as
future requirements desired in closed loop returnable container system. The C Δ V
section, Current versus Vision, illustrates where the organization wants to be in regard
to the system under study. This analysis determines whether a gap exists between the
current state and the future requirements. Once gaps are established, the next step is
8
solution meets the needs, it indicates the process under evaluation will be implemented
with a higher level of success than the current method in use.
A Gap Analysis is a tool used to define requirements, rank priorities, set goals,
plan, and execute changes in existing processes, or develop brand new systems to
replace existing processes. Employing this method enables organizations to make
decisions based on data analysis, surveys, actual costs, etc. The more detailed a GAP
analysis is, (i.e. one which includes historical data, data on existing processes, as well
as competitors’ processes) the greater the chance of setting up a system according to
true requirements, so that all pitfalls and potential problems are minimized.
There are three main objectives of the study:
1. Define the ideal state, desired results;
2. Pursue questions which will guide decision makers to the desired results and
eliminate unwanted and unproductive issues;
3. Make an informed decision and conduct process implementation based on the
framework provided during the examination process.
The Gap Analysis consists of the following sections:
1. Requirements or Needs
2. Questions
3. Points of Change
9
Each section of the analysis contains a consistent set of questions related to the desired
state or end result. For this study, the selected questions are categorized in terms of:
• Complexity
• Cost
• Commonality
• Protection
• Tracking
• Routing
• Availability
• Lean Manufacturing
The Requirements/Needs section lists key requirements from the research, and
are categorized related to performance and improvements of returnable container loops.
Each requirement has an indicator of whether the organization's current solution meets
that requirement, and whether the aspects researched will meet that requirement in the
future. Based on benchmarking, surveys, the interview, and data of excess charges
within one automotive company’s container return system, the following factors were
listed as conditions or criteria that affect the ability of systems to meet future
requirements:
• Quantity of Parts in returnable packs
• Expendable container needs
• Shortages of packaging
• Common returnable containers
• Return rate
• Expected rate of loss/time
• System days
10
• Route
• Misrouted loads
• Transportation Mode
• Number of Distribution Centers
• Customs Issues
• Volume Fluctuation
• Costs/Investments vs. Payback
• Custom packaging vs. standard totes
• Who should manage container tracking records/ who are responsible parties?
• What methods are used to track dunnage?
• Other Issues/Requirements
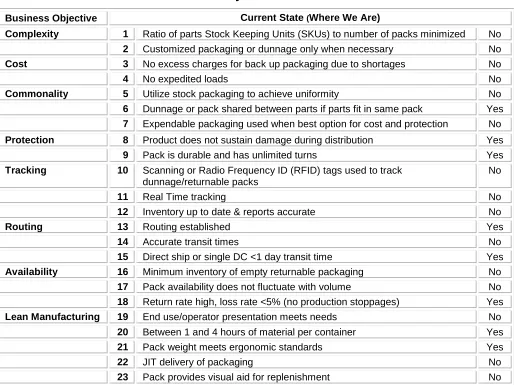
GAP Analysis Needs
Business Objective Current State (Where We Are)
Complexity 1 Ratio of parts Stock Keeping Units (SKUs) to number of packs minimized No
2 Customized packaging or dunnage only when necessary No
Cost 3 No excess charges for back up packaging due to shortages No
4 No expedited loads No
Commonality 5 Utilize stock packaging to achieve uniformity No
6 Dunnage or pack shared between parts if parts fit in same pack Yes
7 Expendable packaging used when best option for cost and protection No
Protection 8 Product does not sustain damage during distribution Yes
9 Pack is durable and has unlimited turns Yes
Tracking 10 Scanning or Radio Frequency ID (RFID) tags used to track dunnage/returnable packs
No
11 Real Time tracking No
12 Inventory up to date & reports accurate No
Routing 13 Routing established Yes
14 Accurate transit times No
15 Direct ship or single DC <1 day transit time Yes
Availability 16 Minimum inventory of empty returnable packaging No
17 Pack availability does not fluctuate with volume No
18 Return rate high, loss rate <5% (no production stoppages) Yes
Lean Manufacturing 19 End use/operator presentation meets needs No
20 Between 1 and 4 hours of material per container Yes
21 Pack weight meets ergonomic standards Yes
22 JIT delivery of packaging No
[image:17.612.67.581.321.706.2]23 Pack provides visual aid for replenishment No
11
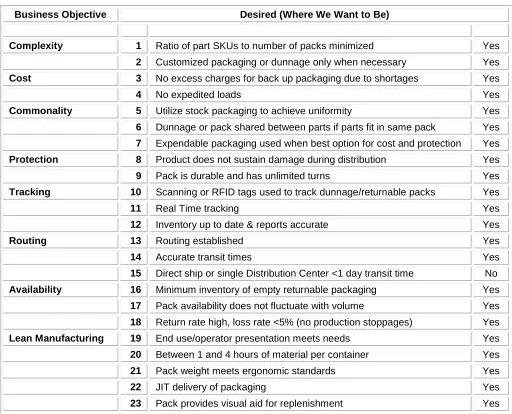
The Questions Section outlines the desired outcome of the characteristics
defined above. This describes what is preferred, and how the system should be
designed. The criteria listed in the Requirements section is used as a guide for
operation of the process. While the Requirements Sections describes the current state,
the Questions Section defines which of these factors is needed or what conditions to
avoid.
GAP Analysis - Questions
Business Objective Desired (Where We Want to Be)
Complexity 1 Ratio of part SKUs to number of packs minimized Yes
2 Customized packaging or dunnage only when necessary Yes
Cost 3 No excess charges for back up packaging due to shortages Yes
4 No expedited loads Yes
Commonality 5 Utilize stock packaging to achieve uniformity Yes
6 Dunnage or pack shared between parts if parts fit in same pack Yes
7 Expendable packaging used when best option for cost and protection Yes
Protection 8 Product does not sustain damage during distribution Yes
9 Pack is durable and has unlimited turns Yes
Tracking 10 Scanning or RFID tags used to track dunnage/returnable packs Yes
11 Real Time tracking Yes
12 Inventory up to date & reports accurate Yes
Routing 13 Routing established Yes
14 Accurate transit times Yes
15 Direct ship or single Distribution Center <1 day transit time No
Availability 16 Minimum inventory of empty returnable packaging Yes
17 Pack availability does not fluctuate with volume Yes
18 Return rate high, loss rate <5% (no production stoppages) Yes
Lean Manufacturing 19 End use/operator presentation meets needs Yes
20 Between 1 and 4 hours of material per container Yes
21 Pack weight meets ergonomic standards Yes
22 JIT delivery of packaging Yes
[image:18.612.63.575.260.674.2]23 Pack provides visual aid for replenishment Yes
12
The Points of Change section highlights areas that meet the required needs,
specifies what requirements are unmet, and what is needed to meet the requirements in
those areas, based on the original criteria. The areas that do not meet identified needs
represent gaps found during the analysis.
GAP Analysis - Points of Change
Needs & Questions Disparity Desired Results
1 Ratio of part SKUs to number of
packs minimized YES
Similar parts are consolidated, part numbers used for various end items
2 Customized dunnage only when
necessary YES
Dunnage is designed to enhance use of the part on line by the operator or automation
3 No excess charges for back up
packaging due to shortages YES
Sufficient amount of packaging is available to avoid fees additional costs for emergency dunnage or repacking
4 No expedited loads
YES Packaging delivered on scheduled routes, no
arrangement of special deliveries to meet production
5 Utilize stock packaging to achieve
uniformity YES
Reduced costs for tracking and sorting of dunnage
6 Dunnage shared between parts if
parts fit No Gap Meets Needs
7 Expendable packaging used when
best option for cost and protection YES
Expendable packaging can be managed and recycling can be planned
8 Product does not sustain damage
during distribution No Gap Meets Needs
9 Pack is durable and has unlimited
turns No Gap Meets Needs
10 Scanning or RFID tags used to track
dunnage YES
All tracking data captured automatically
11 Real Time tracking
YES Tracking data accurate and immediately to all container
users in system
12 Inventory up to date & reports
accurate YES
Tracking data accurate to assist all container users in system
13 Routing established No Gap Meets Needs
14 Accurate transit times YES Meets Needs
15 Direct ship or single DC <1 day
transit time No Gap Meets Needs
16 Minimum inventory of empty
dunnage YES
Need for excess dunnage to cover production shipments eliminated
17 Dunnage availability does not
fluctuate with volume YES
Packaging flow is level and does not need to be tracked down as volumes increase or decrease
18 Return rate high, loss rate <5% (no
production stoppages) No Gap Meets Needs
19 End use presentation meets needs YES Operator can access part on line for installation
20 Between 1 and 4 hours of material
13
21 Pack weight meets ergonomic
standards No Gap Meets Needs
22 JIT delivery of packaging YES Packaging delivered to production line when needed
23 Dunnage provides visual aid for
replenishment YES
[image:20.612.53.582.71.144.2]Operator and delivery driver are able to determine when additional parts are needed, preventing shortages Table 3: Gap Analysis Points of Change outlines areas that do not meet requirements
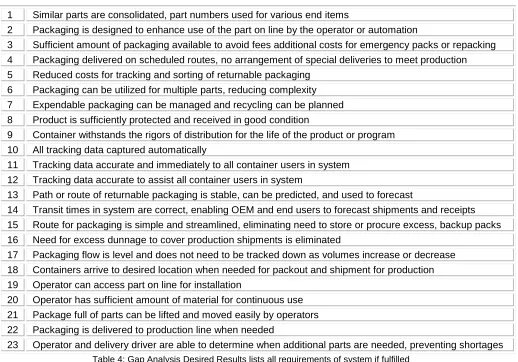
The last section, Desired Results, describes the ideal end result for all criteria,
based upon the original needs summarized when the study was initiated. The
objectives and criteria remain constant throughout the study as requirements are
defined and areas are identified as meeting the criteria, or a gap remains. This
information is used to develop a framework to build a system or environment that meets
all the needs.
Desired Results
1 Similar parts are consolidated, part numbers used for various end items
2 Packaging is designed to enhance use of the part on line by the operator or automation
3 Sufficient amount of packaging available to avoid fees additional costs for emergency packs or repacking
4 Packaging delivered on scheduled routes, no arrangement of special deliveries to meet production
5 Reduced costs for tracking and sorting of returnable packaging
6 Packaging can be utilized for multiple parts, reducing complexity
7 Expendable packaging can be managed and recycling can be planned
8 Product is sufficiently protected and received in good condition
9 Container withstands the rigors of distribution for the life of the product or program
10 All tracking data captured automatically
11 Tracking data accurate and immediately to all container users in system
12 Tracking data accurate to assist all container users in system
13 Path or route of returnable packaging is stable, can be predicted, and used to forecast
14 Transit times in system are correct, enabling OEM and end users to forecast shipments and receipts
15 Route for packaging is simple and streamlined, eliminating need to store or procure excess, backup packs
16 Need for excess dunnage to cover production shipments is eliminated
17 Packaging flow is level and does not need to be tracked down as volumes increase or decrease
18 Containers arrive to desired location when needed for packout and shipment for production
19 Operator can access part on line for installation
20 Operator has sufficient amount of material for continuous use
21 Package full of parts can be lifted and moved easily by operators
22 Packaging is delivered to production line when needed
23 Operator and delivery driver are able to determine when additional parts are needed, preventing shortages
[image:20.612.55.573.344.706.2]14
Measures
Surveys
Levels of effectiveness of container return rates and efficiency in closed loop
systems are measured based on: return rates, measured costs, loss, and production
interruption. The methods to create these measurements will be: Gap Analysis – points
of change to gain improvements in return rates, and Survey Results/Statistical Data –
major influences identified and noted in the survey.
Return Rate is an approximation of the number of pieces of packaging within the
system at any given time. This quantity is based on the replacement rate, how many
packs are lost due to misroutes, delays, and damage. This helps to determine how
much packaging is needed over the life of the product. Loss – shrinkage due to
misroutes, packs not reintroduced into system, and breakage contribute directly to the
return rate.
There are various types of initial and ongoing measured costs. Capital
investment is an initial cost, based on calculated needs. Pack replacement due to loss,
as well as shipping, warehousing, and back up packaging purchases are ongoing costs.
Ongoing costs vary, depending on the complexity of the system, and how the loop or
return system is managed. Some costs are not directly related to the purchase of
packaging, but are due to other packaging factors, and increase the costs of
manufacturing. For example, production stoppages caused by a shortage of packaging
15
from a cost standpoint, since it is not a standard entry in production reports or cost
structures. Many times, interruptions in manufacturing have multiple contributors, and
companies may not have a way to attribute the cause and cost to a packaging issue in
their accounting systems. Loss in terms of production can be quantified, however
understanding how much of that cost is due to an inadequate amount of packaging,
excessive attrition, or misrouting is more difficult.
Case Studies and Industry Analysis
Case studies based on literature reviews involving packaging systems for five
automotive industry companies are evaluated and summarized. Each company is
evaluated on the basis of usage of returnable containers to ship automotive or similar
parts. These studies were selected after completing literature searches documenting
companies that produce automotive or similar parts with established returnable
container practices within closed loop systems. Additionally, three other industries that
reuse packaging are analyzed and included as case studies, based on literature
reviews. Each company is evaluated on the basis of usage of returnable containers to
ship products. These studies were selected based on professional experience, as well
as literature obtained through research of company processes, trade journal articles,
and white papers of studies related to returnable containers and systems for packaging
16
Case Studies
Automotive
When feasible, common containers such as totes, trays, pallets, and rigid intermediate
bulk containers are used within a return system to maximize shared costs. Returnable
packaging is used to present parts in lineside displays, and as part of the production
process. Lineside displays are workstation setups with mini pick stations placed at the
point of part installation. The parts are available to operators in packaging designed to
act as a dispenser, or to be loaded for integration into the workstation. Lineside displays
hold a designated number of parts used in a pull system/Kanban based on usage to aid
in ordering, thus minimizing inventory levels by providing visual alerts for replenishment
and error proofing.
Distribution centers and direct route shipments provide one method to deliver
packaging through the closed loop system. Distribution centers may warehouse
containers; however in automotive production, the goal is to provide packaging on a
just-in-time basis (JIT). Cross-docking in distribution centers, and direct shipments from
supplier or OEM to assembly plants are used more often to move packaging through
distribution centers, versus long-term storage in warehouses. Tracking numbers, RFID
tags, key entry information, and barcodes are used to locate packaging when
necessary, or provide real time inventory information to assist in supplying containers to
17 New United Motor Manufacturing, Incorporated
New United Motor Manufacturing, Inc. (NUMMI) is a joint venture between
Toyota and General Motors. NUMMI reduces corrugated consumption 60% by
purchasing, using, and requiring suppliers to deliver parts in reusable containers.
Almost all parts shipped to NUMMI are transported in returnable containers, saving
millions of dollars. Protective plastic packaging is returned to suppliers for reuse,
resulting in an annual savings of $99,000. (Gilmore 2001)
Toyota Logistics Services (TLS)
TLS customizes vehicles for purchase after assembly. Carpet is shipped in
one-time-use corrugated boxes on pallets. Toyota Logistics Services has replaced
corrugated containers with large reusable plastic containers that collapse, stack, and
can be transported pallet-free. This change has eliminated 3,000 tons of combined
wood and cardboard waste and saved $3.5 million in expendable packaging for six (6)
facilities annually. (www.stopwaste.org, 2005).
TLS also installs custom floor mats in assembled vehicles. Expendable
packaging has been replaced with returnable totes to achieve an annual savings of
$28,000. The savings included annual container costs of $3,500 (amortized over 4
years) and a net annual savings $24,500. Corrugated use has been decreased by
17,000 pounds per year, and 37,000 pounds fewer wooden pallets are used. The labor
to process the return packaging was determined to be equivalent to the previous cost to
18 Automotive Valve Trays
Returnable Valve Trays are manufactured for use by Eaton, a major supplier of
engine valves in the Midwest United States. Parts are produced in Nebraska, packed in
returnable trays, and shipped to various automotive companies, located in Canada,
Michigan and elsewhere. The trays are custom designed for automated picking and
placement on engine assembly lines, and are strong enough to withstand unlimited trips
between the supplier and end user. The trays are labeled and color-coded for easy
identification and proper routing. (Whitt, Material Handling Management)
John Deere Industrial Vehicles & Parts
This manufacturer of industrial vehicles and farm equipment routes company
owned packaging through designated distribution centers in a closed loop returnable
container system in the industrial division. The system is highly controlled; containers
are tracked via software, RFID tags, and scanning. Each container is scanned as it is
received through designated points in the system. John Deere uses a computer system
named ContainerMate. This program captures information for every container, such as
inventory levels and inventory turns, provides tracking to locate lost containers, and
gives container shipment requirements in addition to container cleaning and repair
19 John Deere Turf Care
This division of John Deere set a goal to stop using non-returnable packaging in
order to achieve cost savings. Turf Care containers were bought and distributed within
their division. The Turf Care unit decided to utilize the Corporate Pool of containers,
described above. John Deere’s Worldwide Logistics (WWL) group manages this
returnable system. This program is focused on making generic Deere containers that
can be sent to any Deere unit, and containers are replenished from strategically located
areas. Deere is still working on the implementation; some units will always manage and
replenish their own containers (Horicon, Greeneville, and Augusta).
Food Products
Packaging for food and food processing is mainly single use. Most food is
packed specifically for use by the final consumer. The following products are examples
of food items commonly transported in a closed loop packaging system. Agricultural
and meat products such as fruits, vegetables, and seafood may be shipped in
Returnable or Reusable Plastic Containers (RPC). General guidelines for these
returnable containers are compiled and made available by the Reusable Container &
Pallet Association (RCPA). RPC Case Studies have been conducted by the Stopwaste
Partnership to demonstrate how the use of Reusable Plastic Containers (RPCs) can
20 Grocery (TPS JIT Benchmark)
Piggly Wiggly is the first self-serve supermarket, and was utilized as a JIT
benchmark by Toyota when the Toyota Production System (TPS) was in development
(Ohno, 1995). The grocery store only replenishes items as customers purchase them,
versus ordering based on purchase forecasts. This system of picking and ordering as
products are consumed became the basis for the TPS, which emphasizes tracking and
responses based on real time events. Other Grocery related Industries that use
returnable and reusable packaging include: Seafood, Bread, Produce,
Dairy/Beverage/Soft Drinks, and a limited amount of home delivery for dairy products.
Technology – Electronic Wire and Cable
Wood reels are collected and refurbished or recycled by cable manufacturers.
The end user ships reels back from job sites to the reel supplier. The reel supplier
inspects each reel and repairs, if needed, based on pre-determined criteria. Once
inspection is complete, the reels are marked with a code to signify repair and the
number of turns. The cable manufacturer pays to ship used reels to the single repair
facility, thus ensuring most reels remain in the return loop and complexity is reduced.
Technology – Computer Components and Hard Drive Manufacturing
Server hard drives are packed in corrugated boxes with Polyurethane foam
inserts. The parts are packed by the Outside Equipment Manufacturer (OEM), and
shipped approximately 15 miles to the customer facility for final assembly and
21
are transported back to the OEM for inspection and reuse. The corrugated portion of
the pack is durable enough to withstand a minimum of five turns. The PU insert is more
durable, and can be cycled an indefinite number of turns. The number of corrugated
turns is tracked by marking a pre-printed grid on the bottom of the box. There is one
design for the pack and the route is direct, so there is no complexity in this closed loop
process.
Small Parcel - United States Postal Service
Corrugated plastic totes, or tubs, and plastic pallets are used to transport letters,
small packages and bulk shipments through the United States Postal Service system.
Totes remain within the USPS, or are shuttled between final destinations and the local
post office (e.g. a shipping department or mailroom of companies processing bulk
deliveries or significant mail volumes). Because of the high volume of totes and pallets
utilized, and the relatively low cost to purchase the packaging, the cost to track with
RFID technology cannot be justified. The Post Office relies on their end users and
customers to return packs on their own. Occasionally, the USPS will promote mass
returns through amnesty programs that will not penalize customers who hold returnable
containers and use them for non-postal related applications. This enables them to
recapture pallets and totes previously removed from the return loop by customers at a
level that meets their requirements. It also allows customers to return the containers
and pallets without fines or other penalties, and reduces the cost when repurchases are
22
Small Parcel Distribution Systems - Includes Air Shipment Containers, Smalls
Shipments
Small packages are placed in reusable bags or canisters, which are routed and
redirected through the small parcel distribution system. Durable bags and totes are
standardized so they can be used in any location, if necessary, as needed. Canisters,
large custom containers made to fit in cargo planes, are used in aircraft, and stay with
designated aircraft, while customer parcels are unloaded and shuttled between airports
and distribution hubs throughout the country.
Industry Analysis
Questionnaires
Questionnaires were used to gather data regarding tracking, distribution cycles, and
desired features of closed loop system for returnable automotive and industrial
containers. Three unique questionnaires were distributed via “Survey Monkey” to 317
contacts at 98 different companies. Surveys were sent via email from November 21,
2008 to February 26, 2009, and collected until May 13, 2009. Each survey consisted of
10 questions, and the employee segments are as follows:
• Returnable Container Tracking
o Target population – part suppliers to end user of parts shipping
23
• Returnable Container Factors
o Target population – packaging designers, container maintainers and
managers, corporate information system users, and distribution center
personnel utilizing returnable packaging data for their job
• Distribution Cycle
o Target population – employees in distribution centers, responsible for
shipments, cross docking, and routing of returnable containers
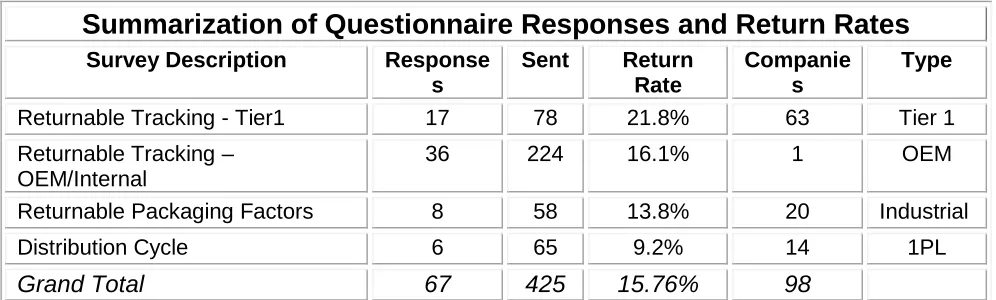
Summarization of Questionnaire Responses and Return Rates
Survey Description Response
s
Sent Return Rate
Companie s
Type
Returnable Tracking - Tier1 17 78 21.8% 63 Tier 1
Returnable Tracking – OEM/Internal
36 224 16.1% 1 OEM
Returnable Packaging Factors 8 58 13.8% 20 Industrial
Distribution Cycle 6 65 9.2% 14 1PL
[image:30.612.76.574.294.444.2]Grand Total 67 425 15.76% 98
24
Survey Criteria
Item Description
Number of Parts/SKUs Quantity of Parts in returnable dunnage/packaging - The amount of Stock Keeping Units (SKUs) can affect the type of returnable containers system that is selected and implemented
Expendable packaging needs How is the determination made to use returnable packaging in a closed loop packaging system?
Shortage of stock containers What causes container shortages?
Return rate/Expected loss rate returnable packs throughout the supply and production cycle
System days/Transit Time Amount of containers to be purchased for a closed-loop system can be based on several factors, time it takes to cycle the containers through the distribution cycle affects the amount of packaging needed to adequately supply the system and time it takes for packaging to cycle through the system one time is based on location, processing time
Route/Misrouted loads Can be attributed to human error such as incorrect manual placement or key entry into a system that designates direction of containers
Transportation Mode The mode of transport can affect transit time, handling environment, exposure to elements, cost, size of packs and pallet patterns
Number of Distribution Centers
Can determine the complexity of shipments, direct trucks vs. routing through multiple centers will increase handling, transit time, potential for lost containers, cost to handle, quantity needed to fill loop
Customs Issues Transporting containers between multiple countries requires additional documentation and possible delays due to border inspections, paperwork errors, or expiration of documentation
Volume Fluctuation Can lead to storage of containers during slower production intervals and possible shortages during peak production times
Costs to set up and maintain closed loop return system
Initial investments of packaging, equipment and systems and must be compared to the time it takes for payback. Each company must determine an acceptable timeline for recovery of their original expenditure. The justification of the ongoing return process must considered and outweigh the total cost to purchase and the resources set up the structure
Determination should be made regarding type of packaging used to transport containers
Custom packaging can be designed to accommodate the specific needs of the product and the environment. Standard packaging, such as stock totes or plastic pallets may be suitable and offer more flexibility.
Container tracking records A key element of container return systems
[image:31.612.79.572.88.559.2]25
Results
Standardized Container Return Statistics are summarized in charts below. Systems
were ranked by users, and the methods utilized for returnable container tracking were
recorded. Distribution cycles and key factors for returnable systems were also
captured.
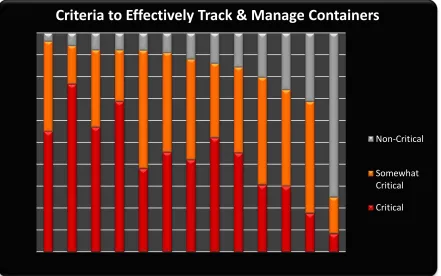
Graph 1: Ranking of criteria to determine effectiveness of container tracking systems by facilitators of returnable packaging receipts and returns at OEM facilities (end user of parts in containers)
Return System Measurements
Location Excess Pack $ Stockpiling Trailer Storage Part Inventory
Home $210,000 N N Low
Highest Charges $1,200,000 Y Y High
[image:32.612.89.530.228.504.2]Lowest Charges $150,000 N N Medium
Table 7: Comparison of Return Systems Based on Measures (cost, timing, etc.) - Intra Plant comparison
Criteria to Effectively Track & Manage Containers
Non-Critical
Somewhat Critical
26
Graph 2: Expendable packaging used to replace lost containers or supplement shortages. The chart is broken down
by each location to highlight the disparity between manufacturing facilities
Graph 3: Summary of unplanned and unbudgeted charges spent to purchase expendable packaging when
returnable containers are unavailable
27%
4%
13%
13% 9%
11% 6%
5% 12%
Annual Excess Use of Expendable Packs
Distribution by Location
Location A Location B Location C Location D Location E Location F Location G Location H Location I
$1,150,000
$150,000
$550,000 $530,000
$390,000 $460,000
$270,000
$230,000
$520,000
$0 $500,000 $1,000,000 $1,500,000
Location A Location B Location C Location D Location E Location F Location G Location H Location I
27
Discussion
Previous studies were examined to determine if algorithms could be used to
calculate the viability of container return systems. One such study was based on the
premise that reusable containers require maintenance during their life, and they may
need to be cleaned before re-using. (Yuan-Ting Cheng and Taho Yang 2005) These
factors were taken into account for the analysis. Damaged containers need to be
repaired or replaced, plus the company implementing the use of reusable containers
needs to keep enough empty containers in the loop to maintain production.
Storage space is also necessary, which leads to further costs. Additionally, costs
for labor and equipment are incurred in moving and storing the containers. When a
company switches to reusable containers, many of the company’s costs related to
handling, transporting, and tracking shipment and returning will be affected. In addition,
the correct reusable containers must be returned to the company promptly, and in
usable condition. Routes, frequency of reusable container shipments, and tracking of
reusable containers, impact the return rate, All these factors must be taken into
consideration in order for the data to be correct. The algorithm compares the costs for
labor, container purchases, transportation and damage across various scenarios and
concludes that a complete returnable system, such as a reverse logistics system,
constructed properly with accurate data, can reduce expenditures related to
28 The scenarios included:
1. 100% Corrugated use, recycled after use
2. 100% Corrugated use, disposed after use
3. 100% Returnable use (company owned), life cycle of three (3) years
4. 100% Returnable use (third party owned), life cycle of three (3) years
Reasons to Implement Return or Reuse Systems
• Cost effective
• Sustainable packaging
• Product Requirements
Possible Barriers or Reasons to Not Implement or Dismantle an Existing Return System
• Cost
• Systems & Tracking Accuracy
• Distribution Network
• Customer Acceptance
Graph 4: Reasons cited to dismantle an existing container return system or justification to not pursue a return system
25.0%
23.7% 21.1%
9.2% 21.1%,
System Dismantled or Not Implemented
Cost Prohibitive
Systems & Tracking Accuracy
29
Conclusion
Reusable Packaging Analysis (analyzing methods and materials/dunnage for
reusable packaging, identify issues, determine improvements, develop implementation
plan) demonstrate that the issues are identified, but not resolved satisfactorily. Both of
the original questions received negative answers in the surveys.
• Were container return rates improved or measured consistently with existing
tracking and recording methods? No
• Did these methods improve transit time, packaging turnaround rates, and
tracking accuracy, leading to additional cost justification of closed loop container
systems? No
Overall, Closed Loop and Non-Closed Loop container return rates are not
improved, nor are return rates measured consistently with existing tracking and
recording methods. Although end users acknowledge tracking and related technology
are proven methods to improve container return systems, in closed loops and
non-closed loop systems, most users do not believe the cost of the process can be justified.
Methods get bypassed during the container distribution process, so current systems are
not fully utilized. However if fully utilized, delivery processes and returnable rates will
improve.
Decisions are made to delay or not purchase additional technology primarily
because the current systems being utilized, while not ideal, do not cause interruptions
30
determining whether any system is effective or acceptable. As long as the needed parts
satisfactorily reach the end user when needed, the cost to add technology or system
improvements will not be justified or approved.
Most industries, companies, and plants that currently track container returns use
their systems to locate containers, but not necessarily to track or capture savings,
losses, or other ongoing costs related to the container return program. If new systems
are purchased, costs and savings may eventually be shown to be cost effective enough
to justify the initial investment or container replenishment quantities. Ongoing,
companies should continue with data collection and tracking in order to capture and
analyze costs for scheduling, repairs, cleaning, etc. This will help determine if there are
31
Appendices
A – Background – exploratory question used to develop Gap Analysis, surveys,
and resultant data
Survey Question formulation, areas of exploration
• Ease of data entry
• Problems entering data
• Ability to accommodate multiple users
• Ease of generating reports
• Accuracy of reports
• Ability to generate program section of [Insert here]
• Ability to generate unduplicated count
• Training
• Satisfaction
• The effectiveness of training
• Usefulness of support
• Overall quality of the software
• Overall accuracy of the reports
• Key points to making returnables work
• Cost and savings in a returnable system
How can you be sure the returnable isn't contaminated? How does it apply to
32
Survey 1 – Returnable Dunnage Factors
1. What type(s) of returnable containers are used at your facility? The types of
packaging used contribute to success of returning packaging. Standard versus custom
design determine whether packaging can be shared within a facility with numerous
parts, or if containers can be shared between facilities. Costs can be saved if sharing
containers by utilizing stock packaging is important. Identifying specific parts or
containers within a system would lead to a decision to use customized packaging.
Pallets can be custom designed to meet the needs of specific distribution networks,
based on product protection, cube utilization, special identification, and specialized
applications.
2. What materials are utilized for your returnables? This question helps gauge the
robustness, and level of customization or standardization. For example, wood pallets
are subject to breakage and need repairs, such are replacement of stringers. Plastic
pallets will be utilized for more turns, most likely the life of the product or several
products. Injection molded, thermoformed or metal packages can be designed for
specific uses, such as dispensing or strength, while corrugated plastic may be used for
applications such as totes or standard sized boxes. Standardization implies more
universal use of containers and less complexity in the closed loop system.
3. Rank these factors in order of importance when making a decision to implement a
closed loop container system. (Most Important, Very Important, Somewhat Important,
33
• Capital Investment
• Cost for Tracking and Accounting
• Environmental Impact
• Logistics and Warehousing
• Transportation vs. Packaging
4. Rate criteria listed as (1 - Non-Critical, 2 - Neither, 3 – Critical, N/A)
• Number of Parts/SKUs
• Part Protection Part
• Dunnage Shortages
• Return Rate
• Transit Time
• Misrouted Shipment
• Distribution
• Customs/International Shipments
• Volume Fluctuations
• Payback
• Systems/Tracking
• Scanning Capabilities
34
5. Which factors are important when tracking assets? (Very Useful, Useful, Not Useful)
• System/Technology
• Scanning/Bar-coding
• Data Accuracy
• Real-time Data
6. Do any of the factors contribute to the choice of returnables as the packaging of
choice? If so, specify whether it is for functional or cosmetic reasons?
• Shock/Impact
• Temperature
• Moisture
• Compression
• Vibration
7. Has the environmental impact in your organization been defined or measured?
• Yes
• No
8. What is your annual returnable loss rate? (damaged or never returned) Based on the
survey results, most packaging is not tracked for level of returns, but estimated to be
less than 5.00%. In turn, the return rate was not considered to be an issue until there
are production stoppages due to container shortages.
9. Please provide your contact information
Contact information was requested in case clarification was necessary; the ZIP codes
35
Illustration 1: Returnable Dunnage Factors Survey Respondent Location Plot
10. What is your industry?
• Automotive/Produce/Technology/Dairy/Soft Drink/Beverage/Other (please specify)
B – Desired Features of Dunnage Return Systems (Questionnaire)
Survey 2 – Distribution Cycle
36
Survey 3 – Dunnage Tracking
Illustration 3: Dunnage Tracking Survey Respondent Location Plot
Graph 5: Survey Participants – type of facility within returnable container loop
Distribution Center 19.6%
20%
Production Facility 15.7%
16%
Data Center/IT 11.8%
12%
Third Party 0.0%
0% Automated System
23.5% 23%
All of the Above 29.4%
29%
37
Graph 6: Distribution Cycle Survey Respondent Breakdown of Types of Tracking
Graph 7: Level of Tracking System Effectiveness
Bar Code Scanning, 5.9%
RFID Scanning, 0.0%
Software/ERP, 49.0%
Manual/Paper, 33.3%
Other/Kanban, 9.8%
No Response, 2.0%
Tracking Methods
Very Effective 17.6%
18%
Somewhat Effective 56.9%
57% Not Effective
23.5% 23% No Response
2.0% 2%
Tracking System Effectiveness
Very
Somewhat
Not
38
Graph 8: Distribution Cycle Survey Respondent Breakdown of Types of Tracking
B - Additional Background and History
Progress in Industrial Ecology, an International Journal, Issue: Volume 3, Number 4 /
2006, Pages: 302 - 328 Henry Ford, Industrial Conservationist? Take-back, waste
reduction and recycling at the Rouge Tom McCarthy A1 History Department, U.S. Naval
Academy, 107 Maryland Avenue, Annapolis, MD 21402, USA
Abstract: Many of the ideas and practices of industrial ecology are not new. Nowhere
is this more apparent than in the extensive waste reduction and recycling program
implemented by Henry Ford and the Ford Motor Company at the famous River Rouge
complex during the 1920s and 1930s. Perhaps the most noteworthy element of these
programs was an automobile disassembly line for end-of-life vehicles. Ford's efforts
occurred in the larger context of the USA’s 'industrial conservation' movement, which Yes
80.4% 80% No
17.6% 18%
No response 2.0%
2%
Calculated vs. Actual Tracking Times
Yes – accurate enough to meet production needs
39
the company epitomized while at the same time standing apart from it. Although Ford's
program was widely publicized, the company's dominance, the idiosyncratic motive
behind the program, and the arrival of the Great Depression, all worked against other
companies emulating Ford's commitment.
C – System Comparisons – Case Study Notes/Diagrams/VSM/Gap Analysis
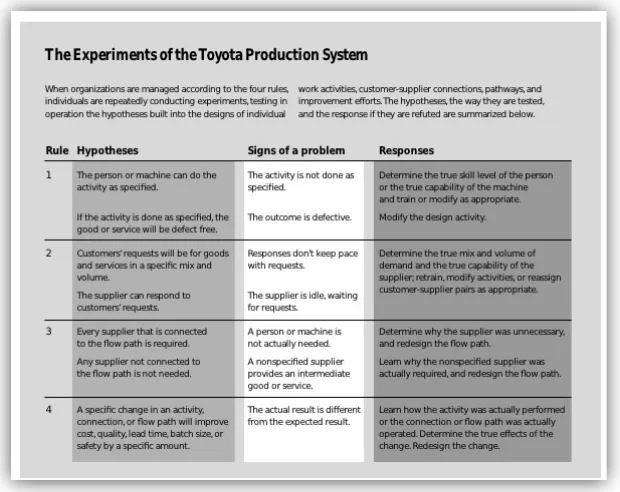
TPS 4 Rules (Spear, 1999)
• Rule 1: All work shall be highly specified as to content, sequence, timing, and outcome.
• Rule 2: Every customer-supplier connection must be direct, and there must be an
unambiguous yes-or-no way to send requests and receive responses.
• Rule 3: The pathway for every product and service must be simple and direct.
• Rule 4: Any improvement must be made in accordance with the scientific method,
[image:46.612.156.466.446.692.2]under the guidance of a teacher, at the lowest possible level in the organization.
40
Define a CRM profile – Customer Resource Management
Larry Caretsky, President Commence 732-380-9100 www.commence.com/mfg/
• How clearly can customers articulate your value proposition?
• How well do customers know products or services?
• What is the customers preferred method of purchasing products and services
supplied?
• Who do customers consider to be the preferred supplier products and services?
• When do customers typically purchase products and services?
• Why do customers typically purchase products and services?
• How do customers use products and services?
• Who is the decision maker? Who else influences the purchase?
• How do customers evaluate suppliers?
Definition of Sustainable Packaging - Sustainable Packaging Coalition
• Is beneficial, safe & healthy for individuals and communities throughout its life
cycle;
• Meets market criteria for performance and cost;
• Is sourced, manufactured, transported, and recycled using renewable energy;
• Maximizes the use of renewable or recycled source materials;
• Are manufactured using clean production technologies and best practices;
• Is made from materials healthy in all probable end-of-life scenarios;
41
• Is effectively recovered and utilized in biological and/or industrial cradle to cradle
cycles.
D - Case Studies
Value Stream Mapping – (www.lean.org) is used to establish the Identify the value
stream, the set of all specific actions required to bring a specific product through the
three critical management tasks of any business: the problem-solving task, the
information management task, and the physical transformation task. Create a map of
the Current State and the Future State of the value stream. Identify and categorize
waste in the Current State, and eliminate it! Values Stream Mapping determines
• What - A visual tool for identifying all activities of the planning, and manufacturing
process to identify waste.
• Why - Provides a tool to visualize what is otherwise usually invisible.
• Who - The leaders of each product family need to have a primary role in developing
the maps for their own area.
• When - Develop a current-state map before improvements are made so that the
efforts and benefits can be quantified.
• Where - On the shop floor, not from your office. You need the real information, not
42
43
Illustration 5: Value Stream Map for Internal Automotive Manufacturing Process – Distribution Center Shipments, Current State
Plant: Material General
Process: Flow Icons Icons
Name:
1suppliers Information
1 900parts/day Flow Icons
189 packs/week
1 54 1 5 3
Takt = 10 min Takt = 1.2 min Takt = 1.2 min Takt =1.2 min Takt =1.2 min C/T = 0.00min C/T =1314min C/T = 360min C/T =432min C/T =396min
Takt 60 minutes/route Trailer Load & Unload Work time calculation (min) 18 Trips per shift 1.4 minutes/pallet 10 hour shift 600 Lineside 22 pallets/truck lunch -30 19 parts/tray 30 minutes/truck huddle 0 18 trays/pallet Daily Volume @ 900 first break -15
342 parts/stop (pallet) 2 shifts/day second break -15 1 189
Transit Time Info 54 trays/shift third break 0 60 min/hr 3 pallets/shift cleanup 0
24 hrs/day 108 trays/day work time / shift 540 Takt = 60 min 1440 min/day 4 days/week shifts 2 C/T = 8.5min
7 days/week 432 trays/week work minutes/day 1080 ##### min/week
816 mins 418 mins 1374 mins 812 mins 606 mins 553 mins 76 Hrs
0 mins 1314 mins 360 mins 432 mins 396 mins 41.7 Hrs
Cycle Trays (A) Trays Pallets Trays
Value Stream Map
Current State
Production Plant Distribution Center Camille Chism
Part Receipt Part Consumed Empty Staging
Truck / day
Truck DC Empty Pickup Notes 1095.000 300.000 0.000 360.000 Cycle 0.141 DC Crossdock Pieces 330.000
Production Lead Time
DC Inbound Empty
Processing Time
Warehouse
DC #1 PackagingEmpty
Assembly
XYZ
C/T = 45 sec. C/O = 30 min. 3 Shifts 2% Scrap Manufacturing Process Outside Sources Truck Shipment PUSH Arrow Finished Goods to Customer First-In-First-Out Sequence Flow Supermarket Physical Pull 1 Weekly
Kaizen Lightning Burst
Uptime
Buffer or
Manual Information Flow
Electronic Information Flow weekly schedule Load Leveling XOXO Withdrawal Kanban Production Kanban Signal Kanban Kanban Post Sequenced-Pull Ball
Return Container Management System
Production Control
FIFO
M Tu W Th F Shipments Daily report Weekly Forecast Daily schedule (parts) Ship Notification Weekly report 52 week forecast
(parts)
2 totes
1254.8 min 12 totes310 min 449 min7 totes 440 min3 totes 2 totes
167 min
DAILY WINDOWS.
wip wip wip wip wip
44
Illustration 6: Value Stream Map for Internal Automotive Manufacturing Process – Distribution Center Shipments, Future State
Plant: Material General
Process: Flow Icons Icons
Name:
Information
900parts/day Flow Icons
189 packs/week
1 54 1 5 3
Takt = 10 min Takt = 1.2 min Takt = 1.2 min Takt =1.2 min Takt =1.2 min C/T = 0.00min C/T =1314min C/T = 360min C/T =432min C/T =396min
Takt 60 minutes/route Trailer Load & Unload Work time calculation (min) 18 Trips per shift 1.4 minutes/pallet 10 hour shift 600 Lineside 22 pallets/truck lunch -30 19 parts/tray 30 minutes/truck huddle 0 18 trays/pallet Daily Volume @ 900 first break -15
342 parts/stop (pallet) 2 shifts/day second break -15 1 189
Transit Time Info 54 trays/shift third break 0 60 min/hr 3 pallets/shift cleanup 0
24 hrs/day 108 trays/day work time / shift 540 Takt = 60 min 1440 min/day 4 days/week shifts 2 C/T = 8.5min
7 days/week 432 trays/week work minutes/day 1080 ##### min/week
816 mins 418 mins 1374 mins 812 mins 606 mins 553 mins 76 Hrs
0 mins 1314 mins 360 mins 432 mins 396 mins 41.7 Hrs
Production Lead Time
Processing Time Cycle 0.141 Pieces DC Crossdock Empty Pickup Notes 360.000 Trays 330.000
DC Inbound Empty
Empty Staging
1095.000 300.000 0.000
All Containers Camille Chism
Part Receipt Part Consumed
Value Stream Map
Future State
Production Plant
Truck ILC
Cycle Trays (A) Trays Pallets
Warehouse/ Supplier
Containers with
Parts PackagingEmpty
Assembly
XYZ
C/T = 45 sec. C/O = 30 min. 3 Shifts 2% Scrap Manufacturing Process Outside Sources Truck Shipment PUSH Arrow Finished Goods to Customer First-In-First-Out Sequence Flow Supermarket Physical Pull Daily
Kaizen Lightning Burst
Uptime
Buffer or
Manual Information Flow
Electronic Information Flow weekly schedule Load Leveling XOXO Withdrawal Kanban Production Kanban Signal Kanban Kanban Post Sequenced-Pull Ball
Return Container Management System
Production Control
FIFO
JIT
Shipments
Parts and Packaging Weekly Forecast Daily schedule (parts) Ship Notification Daily report
( return packaging)
2 totes
1254.8 min 12 totes310 min 449 min7 totes 440 min3 totes 2 totes
167 min
DAILY WINDOWS.
wip wip wip wip wip
45
46
E – Interview
Notes from meeting with S. Schmidt 4/21/2008, Container Management Supervisor
What are the top returnable items/issues faced in your Closed Loop Returnable
System?
• Charges for expendable packaging (corrugated replacement packs) are charged
back to the customer plants by suppliers. Cost of corrugated is excluded from
product cost and considered a production related cost, charged directly to the plant.
Additional recordkeeping is needed to track returnable packaging, expendable
backup, and payment system for suppliers. Transportation costs are incurred when
expedited orders are rush shipped to the customer or supplier site to meet
production schedules.
• Distribution Center Requirements – several pieces of information are used to
determine the requirements of returnable containers. The goal is compared to the
actual fill & pooling (High Volume Domestic Assembly and High Volume NAFTA
Assembly Locations greatest challenges)
• Direct Routes recordkeeping issues and volume fluctuations can lead to the need to
expedite returnable containers
• Plant Yards - Outbound Management notification needs to be followed up with
Stockpiling
Distribution Center Load Pickups – trucks are loaded at the distribution center
cross dock operation and the carrier is called for pickup. The time that pickup
occurs varies, due to schedules, routes, driver hours, etc. The load may be