City, University of London Institutional Repository
Citation:
Coates, R., Ayers, S. & de Visser, R. (2016). Factor Structure of the Edinburgh Postnatal Depression Scale in a Population-Based Sample. Psychological Assessment, doi: 10.1037/pas0000397This is the accepted version of the paper.
This version of the publication may differ from the final published
version.
Permanent repository link:
http://openaccess.city.ac.uk/15722/Link to published version:
http://dx.doi.org/10.1037/pas0000397Copyright and reuse: City Research Online aims to make research
outputs of City, University of London available to a wider audience.
Copyright and Moral Rights remain with the author(s) and/or copyright
holders. URLs from City Research Online may be freely distributed and
linked to.
2
Abstract
To demonstrate validity, questionnaires should measure the same construct in different groups and across time. The Edinburgh Postnatal Depression Scale (EPDS) was designed as a unidimensional scale, but factor analyses of the EPDS have been equivocal, and demonstrate other structures: this may be due to sample characteristics and timing of administration. We aimed to examine the factor structure of the EPDS in pregnancy and postpartum at four time-points in a large population-based sample. We carried out exploratory and confirmatory factor analysis on the Avon Longitudinal Study of Parents and Children sample (n = 11,195 – 12,166) randomly split in two. We used data from 18 and 32 weeks pregnancy gestation; and 8 weeks and 8 months postpartum. A three-factor solution was optimal at all time-points, showing the clearest factor structure and best model fit: Depression (four items) accounted for 43.5 - 47.2% of the variance; anhedonia (two items) 10.5 – 11.1%; and anxiety (three items) 8.3 – 9.4% of the variance. Internal reliability of subscales was good at all time points (Cronbach’s alphas: .73 - .78). The EPDS appears to measure three related factors of depression,
anhedonia and anxiety and has a stable structure in pregnancy and the first postnatal year.
3
Factor structure of the Edinburgh Postnatal Depression Scale in a population-based sample
In pregnancy and the first postnatal year 10-20% of women experience mental illness (Bauer et al., 2014) with detrimental effects on the whole family (Gavin et al., 2005). Interventions can ease symptoms and improve wellbeing of mothers (Dennis & Hodnett, 2007), however effective treatment is hampered by low levels of identification of perinatal mental illness with 50% of women with depression and anxiety not identified (Hewitt et al., 2009). Therefore clinical guidelines recommend screening for or assessing depression and anxiety in the perinatal period (American College of Obstetricians and Gynecologists, 2015; National Institute for Health and Care Excellence [NICE], 2014). The Edinburgh Postnatal Depression Scale (EPDS; Cox, Holden, & Sagovsky, 1987) is well-established, convenient, and probably the most common self-report questionnaire used to assess postnatal depression (Gibson, McKenzie-McHarg, Shakespeare, Price, & Gray, 2009). There is some evidence that the EPDS also measures anxiety with three items and that the summed score of these items can differentiate between anxiety and depressive disorders (Bowen, Bowen, Maslany, & Muhajarina, 2008; Matthey, Fisher, & Rowe, 2012; Ross, Evans, Seller, & Romach, 2003) although further research is needed to determine its acceptability, validity and reliability and psychometric properties as a measure of anxiety (Milgrom & Gemmill, 2014). A review of the criterion ability of the EPDS to detect antenatal and postnatal depression compared against clinical interviews showed substantial variability, with sensitivity ranging from 34 to 100% and specificity from 44 to 100% (Gibson et al., 2009).
4
predominant three-factor solution includes anxiety, depression and anhedonia factors, but there is variation within this.
The different models may reflect methodological differences. Some studies use principal components analysis (PCA) which may inflate the amount of variance accounted for by factors as compared with exploratory factor analysis (EFA; Costello & Osborne, 2005; Preacher & MacCallum, 2003). Additionally, orthogonal rotations (for situations in which factors are not expected to correlate) are unlikely to be suitable for factor analyses of the EPDS as anxiety and depression are highly comorbid in perinatal populations (Heron, O’Connor, Evans, Golding, & Glover, 2004). Oblique rotations which allow factors to correlate are thus more suitable. The decision on how many factors to retain may also have an effect on factor solutions. Factors with eigenvalues greater than one are often retained, but this can result in misleading solutions and further methods (e.g. use of the scree plot) should be used (Costello & Osborne, 2005; Velicer & Jackson, 1990). The value of the factor loading (the correlation between the variable and the factor) that authors deem appropriate will also determine whether an item is allowed to load onto a factor, changing the final structure. Choosing higher loadings results in excluding items that would be included in studies using a lower cut-off. Sample size and characteristics will also affect factor structure. Of the previous studies, almost half had a sample size smaller than 250. At least 300 is considered ‘good’ for factor analysis according to Comrey and Lee (1992), however multiple contested criteria exist concerning absolute sample size or ratio of subjects to variables suitable for factor analysis (MacCallum, Widaman, Zhang, & Hong, 1999). Concerning the perinatal period, the factor structure of the EPDS needs to be tested in both pregnancy and the postnatal period to show that the structure is the same (shows configural
5
1. Is the factor structure of the EPDS the same in the 2nd and 3rd trimesters of pregnancy and at 8
weeks and 8 months postnatally in a population-based sample (i.e., does it show configural invariance)?
2. Do previous factor models of the EPDS hold in a large population-based sample? If not,
which factor solution(s) provide the best fit to the data?
Method
Sample
The sample consisted of participants from the Avon Longitudinal Study of Parents and Children (ALSPAC), an on-going population-based study established to evaluate genetic and
environmental influences on health and development of mothers and children (Fraser et al., 2013). All women living in the Avon area of southwest England who were pregnant with an expected delivery date between 1 April 1991 and 31 December 1992 were eligible for enrolment. The initial number of women enrolled who had returned at least one questionnaire was 14,451. The sample has been described in full elsewhere (Boyd et al., 2013, Fraser et al., 2013). Please note that the study website contains details of all the data that is available through a fully searchable data dictionary
(http://www.bris.ac.uk/alspac/researchers/data-access/data-dictionary). Ethical approval for the study was obtained from the ALSPAC Ethics and Law Committee and the Local Research Ethics
Committees.
6
with both Avon and UK mothers with infants under one using the ALSPAC 8 months postnatal data and the 1991 census showed that ALSPAC mothers were more likely to: be white, live in owner-occupied accommodation, be married, and have a car in the household (Fraser et al., 2013).
The initial sample was randomly divided by ID code into two groups. Sample one was used to generate the factor structure. As we only included participants who had fully completed the EPDS, and this differed at each time point, its n ranged from 5551 – 5988. Sample two (n = 5688 – 6256) was used to cross-validate the results and test competing factor structures identified in previous research.
Measures
The EPDS includes ten items each scored on a 0-3 Likert scale, thus total scores can range from 0-30 with higher total scores indicating higher frequency or severity of symptoms. Full item wording is given in Table 4. For brevity, items are referred to in the text as: 1) laugh; 2) enjoyment; 3) blame; 4) anxious; 5) scared; 6) things getting on top of me; 7) sleep; 8) sad; 9) crying; 10) self-harm. Items 1, 2 and 4 are reverse-scored. Items 1 and 2 are worded positively with a response scale ordered from agree (scores 0) to disagree (3); item four is worded negatively with a response scale ordered from disagree (0) to agree (3); all other items are negatively worded with a response scale ordered from agree (3) to disagree (0).. Cox et al., (1987) suggested scores of 13 and above indicate that the mother is likely to be experiencing depressive illness; Murray and Carothers (1990) found that this cut-off predicted women with clinical depression in the postnatal period based on diagnostic criteria.
Statistical Analysis
Exploratory Factor Analysis (EFA). To test the number of factors and factor structure in the
7
definitive factor structure. As it was expected that factors would correlate, an oblique rotation (direct oblimin) was used. Eigenvalues, scree plots, and amount of variance explained were examined to determine number of factors to be retained. Traditionally factors with eigenvalues greater than one are retained (Kaiser, 1960), but many consider that this is likely to result in an incorrect solution and that the scree plot should also be examined (Cattell, 1966; Velicer & Jackson, 1990). A meaningful factor solution needs to explain at least 50% of the variance (Streiner, 1994). An item loading significantly on a factor was determined by a loading of ≥.3 (Tabachnick & Fidell, 2012). All resulting solutions were examined for the clearest factor structure: i.e., with items loading highly on only one factor and
with few cross-loadings. Data were analysed using IBM SPSS Statistics 20.
Confirmatory Factor Analysis (CFA). We conducted CFAs using AMOS version 21
(Arbuckle, 2012) on the second half of the sample. Four models including all ten items of the EPDS were tested:
(i) The three-factor model was found to have the clearest factor structure in the EFA. This comprised anhedonia (items 1[laugh] & 2[enjoyment]), anxiety (items 3[self-blame], 4 [anxious], 5[scared], 6[things getting on top of me]) and depression (items 7[sleep], 8[sad], 9[crying], 10[self-harm]) factors. Having run a forced three-factor solution using EFA, despite cross-loadings, item 6 [things getting on top of me] loaded most highly with the anxiety items).
(ii) The two-factor model found in the current EFA, with anhedonia (items 1[laugh]& 2[enjoyment]), and general distress (items 3-10) factors.
(iii) The two-factor anxiety / depression model (anxiety: items 3[self-blame], 4[anxious], 5[scared] and depression: items 1[laugh], 2[enjoyment], 3-10) found in Astbury, Brown, Lumley, & Small (1994), Matthey (2008), Phillips, Sharpe, Matthey, & Charles, (2009).
8
Three-factor models with item 10 [self-harm] comprising its own factor have been suggested (Brouwers, van Baar, & Pop, 2001, Ross et al., 2003) but as it is not possible to estimate a latent variable from one indicator, the two-factor solutions (ii and iii) above were tested.
Additional models from previously published research were also run but are not reported as model fit was poorer than all the models which have been reported. Fit indices for these models are available in the online supplementary material.
The maximum likelihood (ML) estimation procedure was used based on its modelling performance with non-normal data and potentially mis-specified models (Olsson, Foss, Troye, & Howell, 2000). Although different estimation methods may be more suitable for categorical data with few categories, as the present data have four categories, ML was deemed appropriate (Byrne, 2010; Green, Akey, Fleming, Herschberger, & Marquis, 1997). In all models, independence of error terms was specified for all variables; factors (if more than one) were allowed to correlate; each observed variable loaded on only one factor and no post-hoc model fitting (by correlating error terms or cross-loading items) was conducted in order not to overfit the model (Manian, Schmidt, Bornstein, & Martinez, 2013). Missing data were dealt with using the Full Information Maximum Likelihood (FIML) procedure in AMOS. Multiple goodness-of-fit indices were used to assess the models. These were the model Chi-square (χ2) test of exact fit, the Comparative Fit Index (CFI), the Root Mean Squared Error of Approximation (RMSEA), Tucker-Lewis Index (TLI), Parsimony Normed
Comparative Fit Index (PCFI), Akaike Information Criterion (AIC); optimal values for each index are given below Table 5 to aid interpretation. The model chi-square is sensitive to correlations and sample size, however it is reported for comprehensiveness. Each fit index indicates one aspect of model fit only, thus multiple fit indices have been considered (Cheung & Rensvold, 2002; Kline, 2005).
9 EPDS scores
No statistically significant differences were found between Samples one and two on EPDS total scores at any time point (p values ranged from .50 -.86), thus EPDS item and total scores are shown for the entire data set.
At both antenatal time-points the median EPDS score was 6 and the IQR 3-10 (18 week gestation range: 0-29, 32 week gestation range: 0-30). At 18 weeks gestation M = 7.00, 32 week gestation M = 7.07. At 18 weeks 13.9% of women scored 13 or above and could be considered to be suffering from depressive illness. At 32 weeks this increased to 15.2%.
Postnatally, the median EPDS score was 5 at 8 weeks (IQR 2-9, range 0-28; M = 6.06) and 10.1% scored 13 or above; at 8 months the median was 4 (IQR 2-8, range 0-29; M = 5.41) and 8.8% scored 13 or above.
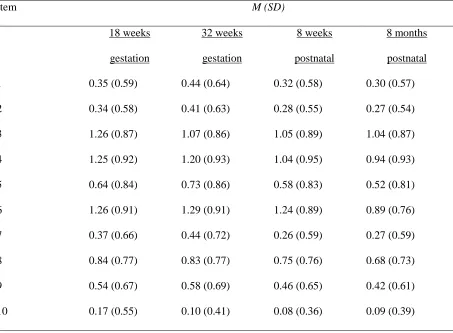
Item means and standard deviations are given in Table 2. Items 3 [self-blame]; 4 [anxious]; and 6 [things getting on top of me] consistently had the highest means across all time-points. Item 10 [self-harm] had the lowest mean at all time-points.
Exploratory factor analysis
Suitability. The data set was suitable for factor analysis: the Kaiser-Meyer-Olkin Measure of
Sampling Adequacy statistic ranged from 0.886 - 0.896 across time-points indicating compact patterns of correlations (possible range 0-1 with ≥0.5 considered appropriate for factor analysis (Tabachnick & Fidell, 2001)). Bartlett’s test of sphericity was significant (p < .001 at all time-points) indicating there were sufficient relationships within the data to be appropriate for factor analysis.
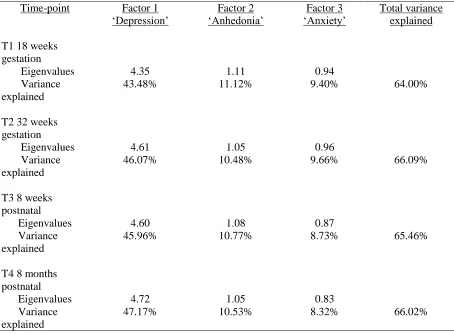
Factor solutions. The factor structure was stable across antenatal and postnatal time points.
At all time-points one factor accounted for a large proportion of the variance, followed by two further components with Eigenvalues near to 1 (see Table 3). The scree plots showed that two or three factors may be appropriately retained; both are reported here and subsequently were tested in the
10
Two-factor solution. Results revealed two components with Eigenvalues > 1. The first
Eigenvalue ranged from 4.35-4.72 and represented a factor consisting of items 3-10 which could be considered ‘general distress’ or combined anxiety and depression. The second Eigenvalue ranged
from 1.05 - 1.11 across time-points and comprised items 1 and 2 which describe a loss of pleasure or anhedonia. At each time point the two factors combined explained 54.6 – 57.7% of the variance. Item 10 [self-harm] consistently showed the lowest factor loading, and loaded below the cut-off of .3 at time 1. The two factors correlated between .55-.59 at each time point.
Internal reliability of the ‘general distress’ factor was very good at all time-points
(Cronbach’s alpha values ranged from .83-.85; Kline, 2005) and Pearson’s correlations between items
1[laugh] & 2[enjoyment] (the ‘anhedonia’ factor) ranged from .57-.67.
Three-factor solution. A third factor with an Eigenvalue of 0.83-0.94 increased the amount
of variance explained to 64.00 – 66.09% at different time-points (see Table 3). This solution
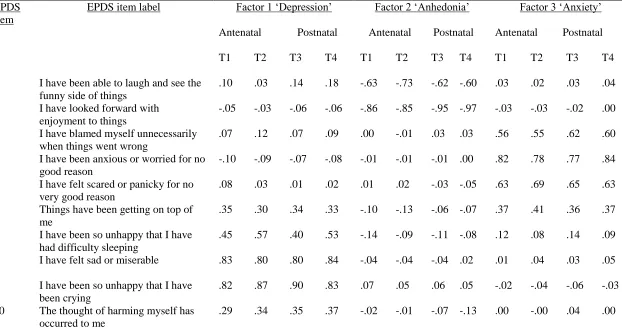
comprised the anhedonia factor (items 1[laugh] and 2[enjoyment]) and split the general distress items into anxiety (items 3[self-blame], 4[anxious], 5[scared] and 6[things getting on top of me]) and depression (items 7 [sleep], 8[sad], 9[crying], 10[self-harm]) factors. Item loadings were higher in the three- (as opposed to two-) factor solution for items 2[enjoyment], 4[anxious], 8[sad], 9[crying], 10[self-harm]. Items 1[laugh], 5[scared] and 7[sleep] had similar loadings in both factor solutions. Item 3[self-blame] loaded slightly more highly (.63-.67) on the ‘general distress’ factor in the 2 factor solution (as compared with .55-.62 on the anxiety factor in the three factor solution). Item 6 [things getting on top of me] was complex, loading more highly on the anxiety factor (.36-.41) at all time-points in the three-factor solution but loadings were only slightly lower on the depression factor (.30-.35). It loaded more strongly (.64-.68) on the ‘general distress’ factor in the two-factor solution. Table 4 shows factor loadings at each time-point for this factor structure.
Internal reliability was good: Cronbach’s alphas for the anxiety factor ranged from .77- .78
and from .73 – .78 for the depression factor, although this increased to .78-.82 if item 10 was
11
total scale at .28 at 18 week’s gestation. Correlations between depression and anhedonia factors
ranged from .62-.67; between depression and anxiety factors .69-.70; and between anhedonia and anxiety factors .48-.54.
Confirmatory factor analysis. Table 5 shows the factor models tested and their fit indices.
The model chi-square was significant for all models indicating a large proportion of the variance was left unexplained by each model, although this is to be expected with a large sample (Kline, 2005). Including all ten items, the current 3-factor model found in the EFA showed the best fit index values at each time point. The difference in χ2 values of the 3-factor model compared with the next best-fitting model was significant at all time-points (ps < .001) providing an indication that the 3-factor model best fit the data. The change in AIC value of each model relative to the minimum AIC value (given by the 3-factor model) was > 10 indicating substantial evidence for the 3-factor model
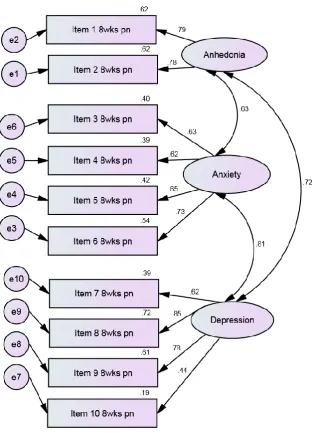
(Burnham & Anderson, 2002). Details of this model at time-point 3 (8 weeks postnatal) are shown in Figure 1. The 8 weeks postnatal time point is illustrated as this is likely to be when most mothers fill in the EPDS for screening purposes in practice in the UK.
One of the six fit indices (PCFI) suggested that the 2-factor anhedonia / general distress model best fit the data but RMSEA and TLI values were outside the range for good model fit for this model and other fit indices also were poorer. The PCFI values were low, indicating poor fit, for all models. After the three factor model, the anhedonia / general distress model showed the next best fit for all other fit indices, followed by variations of the depression/anxiety model. The poorest fit of the data was given by the original unidimensional model of the EPDS.
Discussion
12
indicating that antenatal and postnatal women conceptualise the constructs being measured by the EPDS in the same way (Cheung & Rensvold, 2002; Meredith, 1993). The EFAs and the CFAs implied that at all time-points a three-factor solution was optimal, comprising depression (items 7-10), anhedonia (items 1 and 2) and anxiety (items 3-6); and that the magnitude of factor loadings was similar across all time-points.
The factor structure in the present study was consistent with some other studies (EFA in Cunningham, Brown, & Page, 2015; Pop, Komproe, & van Son, 1992; Zhong et al., 2014) or similar (Kubota et al., 2014 ; Lee King, 2012; Reichenheim, Moraes, Oliveira, & Lobato, 2011; Tuohy & McVey, 2008). All but two of these papers had sample sizes over 400 which may suggest that as the pattern of correlations becomes more stable, items one (laugh) and two (enjoyment) separate out into a separate factor of anhedonia. The mean and median EPDS score in this sample was also comparable with studies that found the anhedonia factor. Furthermore, in our analysis the anhedonia factor explained more variance than the established anxiety factor, indicating that this factor is equally valid for future research.
The division of items into depression and anhedonia factors, explaining more variance than anxiety, could be clinically meaningful. Firstly, it may provide a more accurate assessment of the depressive symptomology of postnatal depression (Chabrol & Teissedre, 2004). Green (1998) used the term perinatal ‘dysphoria’ to describe poor perinatal wellbeing with combined depression and
13
(as presumably the authors of the scale intended), or in the context of well-being, as the only positively worded items (Cunningham et al., 2015). Another possible explanation for the existence of the anhedonia factor is that positively worded items are known to form a separate factor to negatively worded items and can thus alter the structure of a measure artificially (Mook, Kleijn, & Van der Ploeg 1991; Tomas & Oliver, 1999). Items one [laugh] and two [enjoyment] are also both reverse-scored (i.e. a high score indicates the opposite of depression, and a reverse-transformation is applied when scoring) and it is common for reversed items to cluster together (Carlson et al., 2011; Dunbar, Ford, Hunt, & Der, 2000). These two items also had low means and standard deviations compared to most items indicating high levels of agreement with these items. After items one and two on the EPDS, the response scale and valence of items changes, which may be confusing to respondents, as has been shown on other scales with items with mixed polarities (Dunbar et al., 2000). Further research is needed to ascertain whether the anhedonia factor is substantively meaningful or due to scale construction. It is also recognised that factors with at least three items are usually considered desirable, although the large sample size in this study may help compensate for the inclusion of two items on the anhedonia scale (Marsh, Hau, Balla, & Grayson, 1998).
14
depression than between anhedonia and depression, providing tentative evidence the concept of dysphoria. The magnitude of correlations also fits with the tripartite model of anxiety and depression in which both anxious and depressive moods can only be partially differentiated (Clark & Watson, 1991).
A few items were problematic in the analyses. In the EFA item six [things getting on top of me] consistently cross-loaded with low-loadings on both depression and anxiety factors. This is in line with previous research which has found low loadings or cross-loadings for this item on depression, anhedonia and / or anxiety factors (Bina & Harrington, 2015; Brouwers et al., 2001; Hartley, Barroso, Rey, Pettit, & Bagner, 2014; Jomeen & Martin, 2005, 2007; Odalovic, Tadic, Lakic, Nordeng, & Lupatelli, 2015; Reichenheim et al., 2011; Ross et al., 2003; Swalm, Brooks, Doherty, Nathan, & Jacques, 2010; Tuohy & McVey, 2008). When item six has been included in final factor solutions, some have included it in depression and others in anxiety factors, indicating that this item is not useful in discriminating either disorder. It could be argued that the wording of this item; ‘Things have been getting on top of me’ is open to interpretation and does not have face validity suggestive of either
depression or anxiety.
15
The large population-based sample is a strength of this study but the extent to which results are applicable to specific populations cannot be determined. For example, in contrast to our results, Cunningham et al. (2015) did not find longitudinal measurement invariance in their study of the EPDS at two time points in the postpartum with their factor structures differing by severity of EPDS scores. Interestingly when EPDS scores were lower, and more comparable with this study, the factor structure was exactly the same as in this study. Our study does not allow for conclusions about the appropriateness of using total or subscale scores. Women with mental health problems may also be under-represented due to attrition in the ALSPAC sample.
The results suggest that the EPDS could continue to be used as a screen to suggest women for further psychological assessment as raw total scores may be indicative of depression, anxiety or anhedonia. In research the use of total scores is more problematic - assertions that a particular cut-off score indicates postnatal depression may either miss out or wrongly classify women with anhedonia, anxiety and / or depression. Further research testing subsequent steps of measurement invariance to enable true comparisons between antenatal and postnatal women on the EPDS is also needed before true comparisons can be made between these groups. Qualitative research with ante- and postnatal women to ensure content validity, particularly of items one [laugh], two [enjoyment], and six [things getting on top of me] would be useful, as would the use of modern measurement techniques including item response theory to provide further evidence for removal of problematic items, and to elucidate which items on the EPDS are most useful at differentiating clinical groups would be beneficial.
16
childbearing period which do not have a psychiatric classification, such as fear of childbirth (tokophobia), bonding disorders and maternally focussed worry disorder.
Declaration of interest
All the authors declare that they have no conflicts of interest.
References
Adouard, F., Glangeaud-Freudenthal, N.M., & Golse, B. (2005). Validation of the Edinburgh postnatal depression scale (EPDS) in a sample of women with high-risk pregnancies in France. Archives of Women’s Mental Health, 8(2), 89-95. doi: 10.1007/s00737-005-0077-9
Agampodi, S.B., & Agampodi, T.C. (2013). Antenatal depression in Anuradhapura, Sri Lanka and the factor structure of the Sinhalese version of Edinburgh Post-Partum Depression Scale among Pregnant Women. PLoS One. 8(7) doi:10.1371/journal.pone.0069708
American College of Obstetricians and Gynecologists. (2015). Screening for perinatal depression. Committee Opinion No. 630. Obstetrics and Gynecology, 125, 1268-71. Retrieved from:
http://www.acog.org/Resources-And-Publications/Committee-Opinions/Committee-on-Obstetric-Practice/Screening-for-Perinatal-Depression
Arbuckle, J.L. (2012). Amos (Version 21.0) [computer Program]. Chicago: IBM SPSS.
Astbury, J., Brown, S., Lumley, J., & Small, R. (1994). Birth events, birth experiences and social differences in postnatal depression. Australian Journal of Public Health, 18(2), 176-184
17
Retrieved from:
http://eprints.lse.ac.uk/59885/1/__lse.ac.uk_storage_LIBRARY_Secondary_libfile_shared_repository
_Content_Bauer,%20M_Bauer_Costs_perinatal_%20mental_2014_Bauer_Costs_perinatal_mental_20
14_author.pdf
Berle, J.Ø, Aarre, T.F., Mykletun, A., Dahl, A.A., & Holsten, F. (2003). Screening for postnatal depression: Validation of the Norwegian version of the Edinburgh Postnatal Depression Scale, and assessment of risk factors for postnatal depression. Journal of Affective
Disorders, 76, 151-156. doi: 10.1016/S0165-0327(02)00082-4
Bina, R., & Harrington, D. (2015). The Edinburgh Postnatal Depression Scale: Screening tool for postpartum anxiety as well? Findings from a confirmatory factor analysis of the Hebrew version. Maternal and Child Health Journal. doi:10.1007/s10995-015-1879-7.
Bowen, A., Bowen, R., Maslany, G., & Muhajarina, N. (2008). Anxiety in a socially-high-risk sample of pregnant women in Canada. Canadian Journal of Psychiatry, 53, 435-440
Boyd, A., Golding, J., Macleod, J., Lawlor, D.A., Fraser, A., Henderson, J., … Davey Smith, G. (2013). Cohort Profile: the 'children of the 90s'--the index offspring of the Avon Longitudinal Study of Parents and Children. International Journal of Epidemiology, 42(1), 111-27. doi: 10.1093/ije/dys064.
Brouwers, E.P.M., van Baar, A.L., & Pop, V.J.M. (2001). Does the Edinburgh Postnatal Depression Scale measure anxiety? Journal of Psychosomatic Research, 51, 659-663. doi: 10.1016/S0022-3999(01)00245-8
Brown, T.A. (2015). Confirmatory factor analysis for applied research (2nd ed.). New York: The Guilford Press.
18
Byrne, B.M. (2010). Structural equation modeling with Amos: Basic concepts, applications, and programming (2nd ed.). London: Routledge.
Carlson, M., Wilcox, R., Chou, C.P., Chang, M., Yang, F., Blanchard, J.,…Clark, F. (2011). Psychometric properties of reverse-scored items on the CES-D in a sample of ethnically diverse older adults. Psychological Assessment, 23, 558–562. doi: 10.1037/a0022484.
Cattell, R. B. (1966). The scree test for the number of factors. Multivariate Behavioral
Research, 1, 245-276.
Chabrol, H., & Teissedre, F. (2004). Relation between Edinburgh Postnatal Depression Scale scores at 2-3 days and 4-6 weeks postpartum. Journal of Reproductive and Infant Psychology, 22(1),
33-39. doi: 10.1080/02646830310001643067
Cheung, G.W., & Rensvold, R.B. (2002). Evaluating Goodness-of-Fit Indexes for testing measurement invariance. Structural Equation Modelling, 9(2), 233-255. Retrieved from:
http://dns2.asia.edu.tw/~ysho/YSHO-English/1000%20China%20(Independent)/PDF/Str%20Equ%20Mod9,%20233.pdf
Clark, L.A., & Watson, D. (1991). Tripartite model of anxiety and depression: psychometric evidence and taxonomic implications. Journal of Abnormal Psychology, 100(3), 316-36. Retrieved from: https://ccbt.solutions/articles/tripartite-model-1991.pdf
Comrey, A.L, & Lee, H.B. (1992). A first course in factor analysis. Hillsdale, N.J: Erlsbaum.
19
Cox, J.L., Holden, J.M., & Sagovsky, R. (1987). Detection of postnatal depression: Development of the 10-item Edinburgh Postnatal Depression Scale. British Journal of Psychiatry, 150, 782-786.
Cunningham, N.K., Brown, P.M., & Page, A.C. (2015). Does the Edinburgh Postnatal Depression Scale measure the same constructs across time? Archives of Women's Mental Health,
18(6), 793-804. doi: 10.1007/s00737-014-0485-9
Davidson, K.W., Burg, M.M., Kronish, I.M., Shimbo, D., Dettenborn, L., Mehran, R.,… Reickmann, N. (2010). Association of anhedonia with recurrent major adverse cardiac events and mortality 1 year after acute coronary syndrome. Archives of General Psychiatry, 67(5), 480-488. doi:
10.1001/archgenpsychiatry.2010.36.
Dennis, C.L., & Hodnett, E. (2007). Psychosocial and psychological interventions for treating postpartum depression. Cochrane Database of Systematic Reviews, 2007 (4).
Dunbar, M., Ford, G., Hunt, K., & Der, G. (2000). Question wording effects in the assessment of global self-esteem, European Journal of Psychological Assessment, 16(1), 13-19.
doi:10.1027//1015-5759.16.1.13
Fraser, A., Macdonald-Wallis, C., Tilling, K., Boyd, A., Golding, J., Davey Smith, G.,… Lawlor, D.A. (2013). Cohort Profile: the Avon Longitudinal Study of Parents and Children: ALSPAC mothers cohort. International Journal of Epidemiology, 42(1), 97-110. doi: 10.1093/ije/dys066
Gavin, N.I., Gaynes, B.N., Lohr, K.N., Meltzer-Brody, S., Gartlehner, G., & Swinson. T. (2005). Perinatal depression: a systematic review of prevalence and incidence. Obstetrics and Gynecology, 106, 1071-83. doi: 10.1097/01.AOG.0000183597.31630.db
20
Goodchild, C.E., Treharne, G.T., Platts, R.G., & Booth, D.A. (2005). Excessive negative affect and deficient positive affect in anxiety and depression: balancing the valences in the Hospital Anxiety and Depression Scale (HADS). Health Psychology Update, 14(2), 45-50.
Green, J. (1998). Postnatal depression or perinatal dysphoria? Findings from a longitudinal community-based study using the Edinburgh Postnatal Depression Scale. Journal of Reproductive and
Infant Psychology, 16, 143-155. doi:10.1080/02646839808404565
Green, S.B., Akey, T.M., Fleming, K.K., Hershberger, S.L., & Marquis, J.G. (1997). Effect of the number of scale points on chi-square fit indices in confirmatory factor analysis. Structural
Equation Modeling, 4, 108-120. doi: 10.1080/10705519709540064
Guedeney, N., & Fermanian, J. (1998). Validation study of the French version of the Edinburgh Postnatal Depression Scale (EPDS): new results about use and psychometric properties. European Psychiatry, 13(2), 83-9. doi: 10.1016/S0924-9338(98)80023-0.
Hartley, C.M., Barroso, N., Rey, Y., Pettit, J.W., & Bagner, D.M. (2014). Factor structure and psychometric properties of English and Spanish versions of the Edinburgh Postnatal Depression Scale among Hispanic women in a primary care setting. Journal of Clinical Psychology, 70(12), 1240-50. doi: 10.1002/jclp.22101
Heron, J., O’Connor, T.G., Evans, J., Golding, J., & Glover, V. (2004). The course of anxiety
and depression through pregnancy and the postpartum in a community sample. Journal of Affective Disorders, 80 (1), 65 - 73. doi: 10.1016/j.jad.2003.08.004
Hewitt, C., Gilbody, S., Brealey, S., Paulden, M., Palmer, S., Mann, R.,… Richards, D. (2009). Methods to identify postnatal depression in primary care: an integrated evidence synthesis and value of information analysis. Health Technology Assessment, 36, 1-145, 147-230. doi:
21
Jomeen, J., & Martin, C.R. (2005). Confirmation of an occluded anxiety component within the Edinburgh Postnatal Depression Scale (EPDS) during pregnancy. Journal of Reproductive and Infant Psychology, 23, 143-154. doi:10.1016/j.jpsychores.2005.02.018
Jomeen, J., & Martin, C.R. (2007). Replicability and stability of the multidimensional model of the Edinburgh Postnatal Depression Scale in late pregnancy. Journal of Psychiatric and Mental
Health Nursing, 14, 319–324. doi: 10.1111/j.1365-2850.2007.01084.x
Kaiser, H.F. (1960). The application of electronic computers to factor analysis. Educational
and Psychological Measurement, 20, 141-151. doi.org/10.1177/001316446002000116
Kline, R.B. (2005). Principles and practices of structural equation modelling. New York:
Guilford Press.
Kubota, C., Okada, T., Aleksic, B., Nakamura, Y., Kunimoto, S., Morikawa, M., … Ozaki, N. (2014). Factor structure of the Japanese version of the Edinburgh Postnatal Depression Scale in the postpartum period. PLoS One. 9(8). doi: 10.1371/journal.pone.0103941.
Kwan, R., Bautista, D., Choo, R., Shirong, C., Chee, C., Mei Saw, S., … Chen, H. (2015). The Edinburgh Postnatal Depression Scale as a measure for antenatal dysphoria. Journal of Repoductive and Infant Psychology, 33(1), 28-41. doi:10.1080/02646838.2014.949642
Lee King, P.A. (2012). Replicability of structural models of the Edinburgh Postnatal
Depression Scale (EPDS) in a community sample of postpartum African American women with low socio-economic status. Archives of Womens Mental Health, 15(2), 77-86.doi: 10.1007/s00737-012-0260-8
22
Liu, C.H., & Tronick, E. (2014). Prevalence and predictors of maternal postpartum depressed mood and anhedonia by race and ethnicity. Epidemiology and Psychiatric Sciences, 23, 201-209. doi: 10.1017/S2045796013000413
MacCallum, R.C., Widaman, K.F., Zhang, S., & Hong, S. (1999). Sample size in factor analysis. Psychological Methods, 4, 84-99.
Manian, N., Schmidt, E., Bornstein, M.H., & Martinez, P. (2013). Factor structure and clinical utility of BDI-II factor scores in postpartum women. Journal of Affective Disorders, 149,
259-268. doi: 10.1016/j.jad.2013.01.039
Marsh, H.W., Hau, K.-T., Balla, J.R., & Grayson, D. (1998) Is more ever too much? The number of indicators per factor in confirmatory factor analysis. Multivariate Behavioral Research, 33, 2, 181-220. doi: 10.1207/s15327906mbr3302_1
Matthey, S. (2008). Using the Edinburgh Postnatal Depression Scale to screen for anxiety disorders. Depression and Anxiety, 25,926–931.doi: 10.1002/da.20415
Matthey, S., Fisher, J., & Rowe, H. (2012). Using the Edinburgh Postnatal Depression Scale to screen for anxiety disorders: Conceptual and methodological considerations. Journal of Affective Disorders, 146 (2), 224-30. doi: 10.1016/j.jad.2012.09.009.
Meredith, W. (1993). Measurement invariance, factor analysis and factorial invariance. Psychometrika, 58, 525-543. doi:10.1007/BF02294825
Milfont, R., & Fischer, R. (2010). Testing measurement invariance across groups:
23
Milgrom, J., & Gemmill, A. (2014). Screening for perinatal depression. Best Practice & Research Clinical Obstetrics and Gynaecology, 28, 13-23.doi:
http://dx.doi.org/10.1016/j.bpobgyn.2013.08.014
Montazeri, A., Torkan, B., & Omidvari, S. (2007). The Edinburgh Postnatal Depression Scale (EPDS): translation and validation study of the Iranian version. BMC Psychiatry, 7(1): 11. doi:
10.1186/1471-244X-7-11
Mook, J., Kleijn, W. C., & Van der Ploeg, H. M. (1991). Symptom-positively and -negatively worded items in two popular self-report inventories of anxiety and depression. Psychological Reports,
69 (2), 551-560. Retrieved from: http://prx.sagepub.com/content/69/2/551.full.pdf
Murray, L., & Carothers, A.D. (1990) The validation of the Edinburgh Post-natal Depression Scale on a community sample. British Journal of Psychiatry. 157, 288-90. doi: 10.1192/bjp.157.2.288
National Institute of Clinical and Health Excellence, (2014). Antenatal and Postnatal Mental Health: Clinical management and service guidance. Updated edition. National clinical guideline
number 192. Retrieved from https://www.nice.org.uk/guidance/cg192
Odalovic, M., Tadic, I., Lakic, D., Nordeng, H., & Lupatelli, A. (2015). Translation and factor analysis of structural models of Edinburgh Postnatal Depression Scale in Serbian pregnant and
postpartum women – Web-based study. Women and Birth, 28(3). doi:10.1016/j.wombi.2015.01.014
Olsson, U.H., Foss, T., Troye, S.V., & Howell, R.D. (2000). The performance of ML, GLS, and WLS estimation in structural equation modelling under conditions of misspecification and nonnormality. Structural Equation Modeling, 7(4), 557-595. doi: 10.1207/S15328007SEM0704_3
24
Phillips, J., Sharpe, L., Matthey, S., & Charles, M. (2009). Maternally focussed worry. Archives of Women’s Mental Health, 12(6), 409-18. doi: 10.1007/s00737-009-0091-4
Preacher, K.J., & MacCallum, R.C. (2003). Repairing Tom Swift’s electric factor analysis machine. Understanding Statistics, 2(1), 13-43. Retrieved from:
http://www.quantpsy.org/pubs/preacher_maccallum_2003.pdf
Pop, V.J., Komproe, I.H., & van Son, M.J. (1992). Characteristics of the Edinburgh Postnatal Depression Scale in The Netherlands. Journal Affective Disorders, 26(2), 105-10. doi:
10.1016/0165-0327(92)90041-4
Reichenheim, M. E., Moraes, C.L., Oliveira, A.S.D., & Lobato, G. (2011). Revisiting the dimensional structure of the Edinburgh Postnatal Depression Scale (EPDS): empirical evidence for a general factor. BMC Medical Research Methodology, 11, 93. doi: 10.1186/1471-2288-11-93
Ross, L.E., Evans, S.E.G., Sellers, E.M., & Romach, M.K. (2003). Measurement issues in postpartum depression 1: anxiety as a feature of postpartum depression. Archives of Women’s Mental Health, 6, 51-57. doi: 10.1007/s00737-002-0155-1
Small, R., Lumley, J., Yelland, J., & Brown, S. (2007). The performance of the Edinburgh Postnatal Depression Scale in English speaking and non-English speaking populations in Australia. Social Psychiatry and Psychiatric Epidemiology, 42 (1), 70-8. doi: 10.1007/s00127-006-0134-3
Streiner, D.L. (1994) Figuring out factors: The use and misuse of factor analysis. Canadian Journal of Psychiatry, 39, 135-140. Retrieved from:
https://www.researchgate.net/publication/15166264_Figuring_out_factors_The_use_and_misuse_of_f actor_analysis
Swalm, D., Brooks, J., Doherty, D., Nathan, E., & Jacques, A. (2010). Using the Edinburgh postnatal depression scale to screen for perinatal anxiety. Archives of Women’s Mental Health, 13 (6),
25
Tabachnick, B.G., & Fidell, L.S. (2012). Using multivariate statistics (6th ed.). Cambridge: Pearson.
Tomas, J. M., & Oliver, A. (1999). Rosenberg's Self-Esteem Scale: Two factors or method effects. Structural Equation Modeling, 6 (1), 84-98.doi:
http://dx.doi.org/10.1080/10705519909540120
Toreki, A., Andó, B., Dudas, R.B., Dweik, D., Janka, Z., Kozinszky, Z., & Keresztúri, A. (2014). Validation of the Edinburgh Postnatal Depression Scale as a screening tool for postpartum depression in a clinical sample in Hungary. Midwifery, 30(8), 911-8. doi:
10.1016/j.midw.2014.02.008.
Toreki, A., Andó, B., Keresztúri, A., Sikovanyecz, J., Dudas, R.B., Janka, Z., … Pal, A. (2013). The Edinburgh Postnatal Depression Scale: Translation and antepartum validation for a Hungarian sample. Midwifery, 29, 308-315. doi:10.1016/j.midw.2012.01.011
Truijens, S.E.M., Meems, M., Kuppens, S.M.I., Broeren, M.A.C., Nabbe, K.C.A.M., Wijnen, H.A…. Pop, V.J.M. (2014). The HAPPY study (Holistic Approach to Pregnancy and the first
Postpartum Year): design of a large prospective cohort study. BMC Pregnancy and Childbirth, 14: 312. doi: 10.1186/1471-2393-14-312
Tuohy, A., & McVey, C. (2008). Subscales measuring symptoms of non-specific depression, anhedonia, and anxiety in the Edinburgh Postnatal Depression Scale. British Journal of Clinical Psychology, 47, 153-169. doi: 10.1111/j.2044-8260.2008.tb00463.x
26
Vivilaki, V.G., Dafermos, V., Kogevinas, M., Bitsios, P., & Lionis, C. (2009). The Edinburgh Postnatal Depression Scale: Translation and validation for a Greek sample. BMC Public Health, 9, 329. doi: 10.1186/1471-2458-9-329.
Zhong, Q., Gelaye, B., Rondon, M., Sánchez, S.E., García, P.J., Sánchez, E., … Williams, M.A. (2014). Comparative performance of Patient Health Questionnaire-9 and Edinburgh Postnatal Depression Scale for screening antepartum depression. Journal of Affective Disorders, 2,1-7. doi:
27
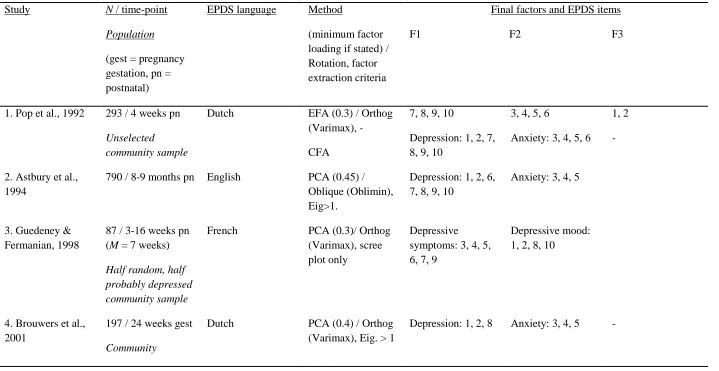
Table 1
Factor analyses of the EPDS in samples of perinatal women published in English.
Study N / time-point
Population
(gest = pregnancy gestation, pn = postnatal)
EPDS language Method
(minimum factor loading if stated) / Rotation, factor extraction criteria
Final factors and EPDS items F1 F2 F3
1. Pop et al., 1992 293 / 4 weeks pn Unselected community sample
Dutch EFA (0.3) / Orthog
(Varimax), - CFA
7, 8, 9, 10
Depression: 1, 2, 7, 8, 9, 10
3, 4, 5, 6
Anxiety: 3, 4, 5, 6
1, 2 -
2. Astbury et al., 1994
790 / 8-9 months pn English PCA (0.45) /
Oblique (Oblimin), Eig>1.
Depression: 1, 2, 6, 7, 8, 9, 10
Anxiety: 3, 4, 5
3. Guedeney & Fermanian, 1998
87 / 3-16 weeks pn (M = 7 weeks) Half random, half probably depressed community sample
French PCA (0.3)/ Orthog
(Varimax), scree plot only
Depressive symptoms: 3, 4, 5, 6, 7, 9
Depressive mood: 1, 2, 8, 10
4. Brouwers et al., 2001
197 / 24 weeks gest Community
Dutch PCA (0.4) / Orthog
(Varimax), Eig. > 1
28
5. Berle et al., 2003 411 / 6-12 weeks pn Community: routine pn visits
Norwegian PCA (-) / Oblique,
Eig. > 1
1-10 - -
6. Ross et al., 2003 150 / 6 weeks pn Community
obstetrical patients
English PCA (0.5)/ Orthog
(Varimax), Eig. > 1 and scree plot
Depression: 1, 2, 8, 9
Anxiety: 3, 4, 5 Suicide: 10
7. Chabrol & Teissedre 2004
299 / 2-3 days pn (PCA), 4-6 weeks pn(CFA)
Community
obstetrical patients
French PCA (-) /Orthog
(Varimax), Eig. > 1 and scree plot CFA
Anxiety: 3, 4, 5, 6, 7
CFA solution as above
Depressive mood/ self-harm: 8, 9, 10
Anhedonia: 1, 2
8. Adouard et al., 2005
60 / 28-34 weeks gest
High risk pregnancies
French PCA (0.4) / Orthog
(Varimax), -
Depression + other: 3, 4, 5, 6, 10
Depression: 1, 2, 7, 8, 9
-
9. Jomeen & Martin, 2005
101 / 14 weeks gest Community
antenatal clinic
English PCA (0.6) / Oblique
(Oblimin), Eig. > 1 CFA
1, 2, 6, 7, 8, 9 Depression: 1, 2, 8
3, 4, 5
Anxiety: 3, 4, 5
10
10. Jomeen & Martin, 2007
117 / M = 31.5 weeks gest Community
29
antenatal clinic
11. Montazeri et al., 2007
100 / 6-14 week pn Community health care centre
Persian PCA (0.4) / Orthog
(Varimax), -
Anxiety: 3, 4, 5, 8 Depression: 6, 7, 8, 9, 10
Euthymic mood: 1, 2
12. Small et al., 2007
103 / 6-9 months pn 104 / 6-9 months pn 106 / 6-9 months pn 1166 / 6-7 months pn Immigrant mothers in Australia Vietnamese Turkish Tagalog English
PCA (0.3) / Orthog (Varimax) and Oblique (not presented), scree plot
1, 2, 3, 6, 8, 9 3, 4, 5, 6, 7, 8 3, 4, 5, 8 3, 4, 5, 6, 7, 8
3, 4, 5, 7 9, 10 6, 7, 9, 10 1, 2
10 1, 2 1, 2 9, 10
13. Bowen et al., 2008
402 / 15 weeks gest Socially high-risk (Outreach program)
English EFA (0.5) / Orthog
(Varimax), -
Anxiety: 3, 4, 5 Depression: 1, 2, 8 Self-harm: 10
14. Matthey, 2008 238 / 6 weeks pn Women attending parenthood classes
English PCA (-) / Unrotated,
-
Anxiety: 3, 4, 5 Depression: 1, 2, 6, 7, 8, 9, 10
-
15. Tuohy & McVey, 2008
440 / 6 months pn Self-selected online
English EFA: PAF (-)/
Oblique (direct quartimin), parallel
Depressive symptoms: 6, 7, 8, 9, 10
30
analysis 16. Phillips et al.,
2009
309 / 1 wk – 12 months pn, M = 5.4 months
Mothers with unsettled infants
English EFA: MLE (0.3) /
Oblique (oblimin), Eig. > 1
CFA
Depression: 1, 2, 6, 7, 8, 9, 10
Anxiety: 3, 4, 5 -
17. Vivilaki et al., 2009
120 / 4 days-16 weeks pn Community maternity departments
Greek PCA (0.5) / Orthog
(Varimax), Eig. > 1 and scree plot CFA
Depression: 7, 8, 9 Anxiety: 4, 5,6 -
18. Swalm et al., 2010
4,706 / Mdn = 26 weeks gest 3,853 / Mdn = 7 wks pn
Representative community sample
English PCA (0.6) / Orthog
(Varimax), Eig. > 1 and scree plot
Anxiety: 3, 4, 5 Other: 1, 2, 10 -
19. Reichenheim et al., 2011
811 / < 5 months pn (M = 59 days) Random community sample
Brazilian Portuguese
E / CFA (-) / Oblique (geomin), forced 2-,3- and 4-factors
CFA
Anhedonia: 1, 2, 6 Bifactor model with general (g) factor
Anxiety: 3, 4, 5 items as above but conditional on the 3
31
20. Lee King, 2012 169 / 1wk – 9months pn (M = 1.51 months) Socially high risk pregnancies
English CFA Anhedonia: 1, 2 Anxiety: 3, 4, 5 Depression: 7-10
21. Agampodi & Agampodi, 2013
376 / 24-36wks gestation Community (antenatal clinics)
Sinhalese PCA (-) / Orthog
(Varimax), Eig. > 1
Anhedonia: 1, 2 Depression and anxiety: 3-10
22. Petrozzi & Gagliardi, 2013
594 / 2-3 days pn Cohort (hospital maternity department)
Italian EFA; PAF /
Oblique (Promax), Scree test
Depression: 7-10 Anxiety: 3-6 Anhedonia: 1-2
23. Toreki et al., 2013
219 / 12 weeks gest Random community sample (routine prenatal check, hospital)
Hungarian PCA (0.5) / Orthog
(Varimax), Eig.>1 and scree plot
2, 4, 5, 6, 10 3, 8, 9 1, 7
24. Hartley et al., 2014
M = 4 months pn
122 98
English Spanish
CFA
1, 2, 8, 9 1, 2, 8, 9
32
Community (pediatric primary care well/sick visit)
25. Kubota et al., 2014
690 / 1 month pn Community maternity program
Japanese EFA; MLE (0.45) /
Oblique (promax), scree plot
CFA
3, 4, 5
Anxiety: 3, 4, 5
1, 2
Anhedonia: 1, 2
7, 8, 9
Depression: 7, 8, 9
26. Toreki et al., 2014
266 / 6 weeks pn Community (routine postpartum check)
Hungarian PCA (0.5) /
Oblique, Eig.>1 and scree plot. CFA
3, 4, 5, 6
Anxiety: 3, 4, 5, 6
1, 2, 9, 10
Depression: 1, 2, 9, 10
27. Zhong et al., 2014
1517 / <16weeks gest (M = 9.8wks) Community (perinatal care establishment)
Spanish PCA (0.4)/
Orthogonal, Eig.>1 and scree plot CFA
Anxiety and Depression: 3 – 10 Anhedonia: 1, 2
Anhedonia: 1, 2
Anxiety: 3, 4, 5, 6 Depression: 7, 8, 9, 10
28. Bina & Harrington, 2015
715 / 6 weeks pn Community (hospital maternity department)
Hebrew CFA Depression: 1, 2, 7,
8, 9,10
Anxiety: 3, 4, 5
29. Cunningham et al., 2015
636 / 0-13 months pn
Admissions to
English EFA (0.3) / Oblique
33
Mother Baby Unit
Discharged patients
CFA 1, 2, 3, 6, 7, 8, 9, 10
1, 2
3, 4, 5
3, 4, 5, 6 6, 7, 8, 9, 10
30. Kwan et al., 2015
920 / 0-14 weeks gest
Population-based (antenatal clinics)
English (Chinese, Malay & Indian participants)
EFA / Oblique (Geomin), forced 1- 2- & 3-factors (multiple criteria for extraction)
CFAs showed poor fit
1-10
31. Odalovic et al., 2015
76 / M = 25.7 weeks gest
125 / 37% <28 weeks pn
Online, self-selected
Serbian EFA (0.4) / Orthog
(Varimax) & PCA, Eig.>1.
CFA
3, 4, 5
3, 4, 5
7, 9, 10
7, 9, 10
1, 2
1, 2
Note. EFA = Exploratory Factor Analysis; PCA = Principal Components Analysis; PAF = Principal Axis Factoring; CFA = Confirmatory Factor Analysis;
34
Table 2
EPDS Item Means and Standard Deviations (N = 11,291 – 12, 309 dependent on missing data)
Item M (SD)
18 weeks gestation
32 weeks gestation
8 weeks postnatal
8 months postnatal
1 0.35 (0.59) 0.44 (0.64) 0.32 (0.58) 0.30 (0.57)
2 0.34 (0.58) 0.41 (0.63) 0.28 (0.55) 0.27 (0.54)
3 1.26 (0.87) 1.07 (0.86) 1.05 (0.89) 1.04 (0.87)
4 1.25 (0.92) 1.20 (0.93) 1.04 (0.95) 0.94 (0.93)
5 0.64 (0.84) 0.73 (0.86) 0.58 (0.83) 0.52 (0.81)
6 1.26 (0.91) 1.29 (0.91) 1.24 (0.89) 0.89 (0.76)
7 0.37 (0.66) 0.44 (0.72) 0.26 (0.59) 0.27 (0.59)
8 0.84 (0.77) 0.83 (0.77) 0.75 (0.76) 0.68 (0.73)
9 0.54 (0.67) 0.58 (0.69) 0.46 (0.65) 0.42 (0.61)
35
Table 3
Exploratory factor analysis: initial eigenvalues and amount of variance explained at each time-point for three factors extracted.
Time-point Factor 1
‘Depression’ Factor 2 ‘Anhedonia’ Factor 3 ‘Anxiety’ Total variance explained T1 18 weeks
gestation Eigenvalues Variance explained 4.35 43.48% 1.11 11.12% 0.94
9.40% 64.00%
T2 32 weeks gestation Eigenvalues Variance explained 4.61 46.07% 1.05 10.48% 0.96
9.66% 66.09%
T3 8 weeks postnatal Eigenvalues Variance explained 4.60 45.96% 1.08 10.77% 0.87
8.73% 65.46%
T4 8 months postnatal Eigenvalues Variance explained 4.72 47.17% 1.05 10.53% 0.83
36
Table 4
Exploratory Factor structure of the EPDS using maximum likelihood extraction with oblique (direct oblimin) rotation (n = 5551-5988 due to missing data).
EPDS Item
EPDS item label Factor 1 ‘Depression’
Antenatal Postnatal
Factor 2 ‘Anhedonia’
Antenatal Postnatal
Factor 3 ‘Anxiety’
Antenatal Postnatal
T1 T2 T3 T4 T1 T2 T3 T4 T1 T2 T3 T4
1 I have been able to laugh and see the funny side of things
.10 .03 .14 .18 -.63 -.73 -.62 -.60 .03 .02 .03 .04
2 I have looked forward with
enjoyment to things
-.05 -.03 -.06 -.06 -.86 -.85 -.95 -.97 -.03 -.03 -.02 .00
3 I have blamed myself unnecessarily
when things went wrong
.07 .12 .07 .09 .00 -.01 .03 .03 .56 .55 .62 .60
4 I have been anxious or worried for no good reason
-.10 -.09 -.07 -.08 -.01 -.01 -.01 .00 .82 .78 .77 .84
5 I have felt scared or panicky for no very good reason
.08 .03 .01 .02 .01 .02 -.03 -.05 .63 .69 .65 .63
6 Things have been getting on top of me
.35 .30 .34 .33 -.10 -.13 -.06 -.07 .37 .41 .36 .37
7 I have been so unhappy that I have had difficulty sleeping
.45 .57 .40 .53 -.14 -.09 -.11 -.08 .12 .08 .14 .09
8 I have felt sad or miserable .83 .80 .80 .84 -.04 -.04 -.04 .02 .01 .04 .03 .05
9 I have been so unhappy that I have been crying
.82 .87 .90 .83 .07 .05 .06 .05 -.02 -.04 -.06 -.03
10 The thought of harming myself has occurred to me
.29 .34 .35 .37 -.02 -.01 -.07 -.13 .00 -.00 .04 .00
37
Table 5
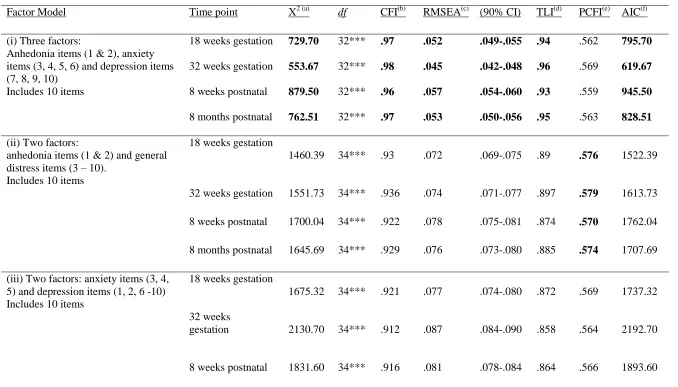
Fit indices for comparison of modelled CFA factor structures of 10-item EPDS.
Factor Model Time point Χ2 (a) df CFI(b) RMSEA(c) (90% CI) TLI(d) PCFI(e) AIC(f)
(i) Three factors:
Anhedonia items (1 & 2), anxiety items (3, 4, 5, 6) and depression items (7, 8, 9, 10)
Includes 10 items
18 weeks gestation 32 weeks gestation 8 weeks postnatal 8 months postnatal
729.70 553.67 879.50 762.51 32*** 32*** 32*** 32*** .97 .98 .96 .97 .052 .045 .057 .053 .049-.055 .042-.048 .054-.060 .050-.056 .94 .96 .93 .95 .562 .569 .559 .563 795.70 619.67 945.50 828.51
(ii) Two factors:
anhedonia items (1 & 2) and general distress items (3 – 10).
Includes 10 items
18 weeks gestation
1460.39 34*** .93 .072 .069-.075 .89 .576 1522.39
32 weeks gestation 1551.73 34*** .936 .074 .071-.077 .897 .579 1613.73
8 weeks postnatal 1700.04 34*** .922 .078 .075-.081 .874 .570 1762.04
8 months postnatal 1645.69 34*** .929 .076 .073-.080 .885 .574 1707.69
(iii) Two factors: anxiety items (3, 4, 5) and depression items (1, 2, 6 -10) Includes 10 items
18 weeks gestation
1675.32 34*** .921 .077 .074-.080 .872 .569 1737.32
32 weeks
gestation 2130.70 34*** .912 .087 .084-.090 .858 .564 2192.70
38
8 months postnatal 1986.39 34*** .914 .084 .081-.087 .860 .565 2048.39
(iv) One factor: items 1-10 Includes 10 items
18 weeks gestation 2459.87 35*** .883 .092 .089-.095 .817 .562 2519.87
32 weeks gestation 2876.04 35*** .881 .100 .097-.013 .813 .560 2936.04
8 weeks postnatal 2798.08 35*** .871 .099 .095-.102 .797 .554 2858.08
8 months postnatal 3042.62 35*** .867 .103 .100-.106 .791 .552 3102.62
40
Figure 1
The current 3-factor model at time-point 3 (8 weeks postnatal). Numerical values represent