Feasibility Study of Applicability of Recurrence
Quantification Analysis for Clustering of Power System
Dynamic Responses
Panagiotis N. Papadopoulos,
Member, IEEE
Jovica V. Milanović,
Fellow, IEEE
School of Electrical and Electronic Engineering The University of Manchester
Manchester, UK
[email protected], [email protected]
Pratyasa Bhui
Nilanjan Senroy,
Member, IEEE
Department of Electrical Engineering Indian Institute of Technology Delhi
New Delhi, India [email protected]
Abstract—A methodology based on Recurrence Quantification
Analysis (RQA) for the clustering of generator dynamic behavior is presented. RQA is a nonlinear data analysis method, which is used in this paper to extract features from measured generator rotor angle responses that can be used to cluster generators in groups with similar oscillatory behavior. The possibility of extracting features relevant to damping and frequency of oscillations present in power systems is studied. The k-Means clustering algorithm is further used to cluster the generator responses in groups exhibiting well or poorly damped oscillations, based on the extracted features from RQA. The effectiveness of RQA is investigated using simulated responses from a modified version of the IEEE 68 bus network, including renewable energy resources.
Index Terms—clustering, k-means, recurrence quantification
analysis, renewable energy resources.
I. INTRODUCTION
Due to various social, environmental economic and technical reasons, power systems may be driven to operate closer to their stability limit. New techniques and algorithms need to be implemented, that will facilitate close to real time identification of power system dynamic behavior that will in turn enable corrective control measures. Identifying generators with similar dynamic behavior is a key issue that can guide the implementation of special protection schemes for the prevention of impeding instabilities [1].
There are several clustering algorithms available in the literature that have been applied to identify coherent groups of generators, such as fuzzy C-means, principal and independent component analysis and support vector clustering [2]-[5]. Different features of time domain responses can be used to define similarity between generator responses before applying the clustering algorithms. Hierarchical clustering has been also applied in [1] to define groups of generators that exhibit instability together. The obtained clusters from this approach
are directly related to transient stability rather than to slow coherency. However, this method focuses on unstable cases and all stable generator responses are clustered in one group. Therefore, a further clustering approach for clustering the stable generators which are exhibiting oscillatory behavior is needed, that could be subsequently used to determine the appropriate stabilizing control actions for groups of generators exhibiting similar poorly damped oscillatory behavior.
In this paper, the application of Recurrence Quantification Analysis (RQA) is investigated as a tool to extract relevant features from measured responses that will help in clustering generators exhibiting oscillatory behavior. Most of the above mentioned methods have been applied in power systems with conventional synchronous generators. RQA has the advantage that it can be applied to noisy, nonlinear, non-stationary data, such as those usually obtained from power system dynamic responses after large disturbances. This becomes more important with the increasing penetration of Renewable Energy Resources (RES), which are mainly interfaced using power electronics and are expected to change the system dynamic behavior.
RQA has been used in power system dynamic studies in the past in order to define, among the other, a transient stability index based on voltage measurements [6]. In this study, RQA is applied on generator rotor angles to test the efficiency of the method in extracting useful features that are afterwards used to cluster the generator responses. The extracted features reflect changes in the damping and frequency of oscillation of the generators. This way, groups of generators with poorly or even negatively damped oscillatory behavior can be identified.
II. METHODOLOGY
RQA is a method of nonlinear data analysis which quantifies the number and duration of recurrences of a dynamical system presented by its state space trajectory [7].
Several measures of recurrence have been presented in [7], based on recurrent plots [8]. In this paper, the basic properties of Recurrence Rate (RR) and Determinism (DET) are used to investigate whether these measures are suitable for the extraction of relevant features to cluster the dynamic behavior of power systems.
RR is defined by (1) and DET by (2), where R is the recurrence matrix, N is the number of samples and P(l) is the number of times a diagonal of length l occurs. The recurrence matrix R is a matrix which stores the data points Ri,j of the measured response that are recurrent, i.e., the distance between the points is less than a specified threshold value. RR is the density of recurrent points and DET quantifies the percentage of recurrent points that form a diagonal of minimum length lmin. In this study a default valueof lmin is set to 2. More information on RQA can be found in [6]-[8].
𝑅𝑅 = 1
N2∑Ri,j
N
i,j=1
(1)
𝐷𝐸𝑇 =∑ l∙P(l)
N l=𝑙min
∑Ni,j=1Ri,j
(2)
A. Use of RQA on Typical Power System Responses
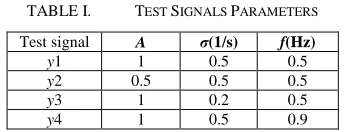
The aim of clustering generator responses is mainly to distinguish between three attributes: amplitude, damping and frequency of oscillations. RQA is therefore tested to investigate the effectiveness of the method in extracting the relevant features that can reflect changes in these three attributes. Most commonly, oscillations observed in power system responses have the form of damped sinusoids, defined by (3). Four signals, y1-y4, are used as an example to illustrate the ability of RQA to distinguish between signals with different amplitude, frequency and damping, as shown in Table I. RR and determinism are calculated for these four signals and the results are show in Fig. 1. RR varies mainly with the change in damping and very slightly with the change in frequency but it does not change when the amplitude changes. On the other hand DET mainly varies with the change in frequency. Therefore, the two RQA measures could be used as features that will distinguish between damping and frequency. Lower values of RR and DET are expected as the damping of oscillations becomes smaller and as the frequency increases, respectively.
[image:2.612.314.558.415.568.2]y=A∙ 𝑒−σtcos(2πf∙t) (3)
TABLE I. TEST SIGNALS PARAMETERS
Test signal A σ(1/s) f(Hz)
y1 1 0.5 0.5
y2 0.5 0.5 0.5
y3 1 0.2 0.5
y4 1 0.5 0.9
B. Clustering Generator Responses
The aim is to cluster generators into groups based on how oscillatory their behavior is after a disturbance. As a first step, the “first-swing” unstable cases can be identified using the
method proposed in [1]. For the cases that do not exhibit “first-swing” instability, RR and DET are calculated for the rotor angle responses of each one of the generators within the system. Clustering is then applied using RR and DET as features in order to group the generators according to how well or poorly damped oscillatory behavior they exhibit.
K-Means is used a simple partitioning method to cluster generators of a system into k groups based on the features extracted from RQA (i.e. RR and DET). K-Means is an iterative centroid based partitioning technique that uses the centroid ci of a cluster to represent that cluster. The centroid ci is defined as the mean value of the points within the cluster. Initially, k points are randomly selected as centroids and the rest of the points are assigned to the respective clusters for which they have the smallest Euclidean distance. The iterative partitioning method afterwards minimizes the sum, over all clusters, of the within-cluster sums of point to cluster-centroid distances [9]. The number of clusters can be defined by observing how RR and DET vary for a large number of simulated contingencies for a given system. A simple approach is to use two clusters (i.e. k=2) to distinguish between the generators exhibiting poorly damped and well damped oscillatory behavior. In case the number of groups is not predefined, different clustering techniques such as hierarchical clustering can be also used with RR and DET as features. However, a threshold value that will distinguish between well and poorly damped oscillations needs to be defined in this case. K-Means is chosen in this paper since the focus is to mainly distinguish between well and poorly damped oscillatory behavior and therefore the number of generator groups is predetermined.
Figure 1. a) RR and determinism for test signals b) Test signals.
III. APPLICATION RESULTS
A. Test System
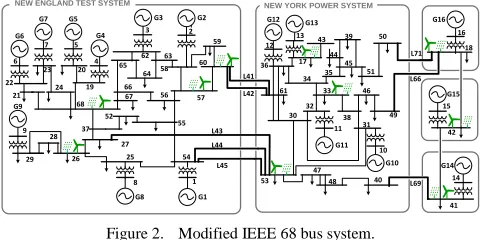
The test network used, is a modified version of the IEEE 68 bus/16 machine reduced order equivalent model of the New England Test System and the New York Power System (NETS – NYPS). The system consists of five areas, NETS, NYPS and three external areas represented by G14, G15 and G16 respectively. The conventional part of the test network is adopted from [10] and ten RES units are connected at the buses shown in Fig. 2. For each RES unit, two types of RESs are connected at each bus: Type 3 Doubly Fed Induction
1 2
0 0.2 0.4 0.6 0.8
1 a)
Recurrence Rate (1), Determinism (2) y1
y2 y3 y4
0 100 200 300 400 500 600 700 800 900 1000
-1 -0.5 0 0.5
1 b)
Samples
A
m
pl
itude
[image:2.612.89.261.601.667.2]Generators (DFIGs), representing wind generators and Type 4 Full Converter Connected (FCC) units, representing both wind generators and Photo-Voltaic (PV) units. The amount of connected RES (installed capacity) is considered to be equal to 20% of the installed conventional generation of each area. The instantaneous penetration of RES is varying according to the modeled uncertainties as described later. The models used are available in DIgSILENT/PowerFactory [11] software and are suitable generic RMS models for large scale stability studies following a similar approach to [12]. More information on the modified test network and RES modelling can be found in [13]. All RES units are considered to provide Fault Ride Through (FRT) capability.
Figure 2. Modified IEEE 68 bus system.
B. Monte Carlo Simulations
A large number of contingencies are simulated using Monte Carlo (MC) to generate representative dynamic responses for the system under study. 6000 contingencies are simulated in this study considering self-clearing three phase faults. Since the purpose of this paper is to investigate the dynamic behavior of the system for cases that do not exhibit non-oscillatory instability, these cases are identified and removed from the dataset. The effect of the intermittent behavior of wind generators and Photo-Voltaic (PV) units is modeled using appropriate probability distributions as explained below. The uncertainties related to the conventional part of the system such as system loading, fault location and duration are also included in this study.
For system loading and PV generation, typical daily curves are initially used, obtained from national grid data [14] and the literature [15], respectively. The system load is considered to vary from 0.6 to 1 pu. The hour of the day is sampled randomly and for each hour, an appropriate PDF is used to model the uncertainty within the hour. For system loading a normal distribution with mean value 1 pu and standard deviation 3.33% is used [1], while for PV generation, a beta distribution with a and b parameters 13.7 and 1.3 [16]. For wind generation, a Weibull distribution is used with φ =11.1 and k=2.2 [17], assuming constant wind speed for every hour within the day. For each load within the system and each RES unit, the PDFs are sampled separately, to consider independent behavior of each unit. For example, assuming the total load is 0.8 pu for a given hour of the day, one load might have a value of 0.75pu and another 0.85pu. The fault location is also sampled randomly following a uniform distribution along each line within the system. Moreover, the uncertainty of the fault duration is modeled using a normal distribution with mean value 13 cycles and standard deviation 6.67% [1].
After considering the uncertainties, Optimal Power Flow (OPF) is solved to determine the conventional generators dispatch Pig, where g=1…16 is the generator number for the specific test network and i=1…Ns is the number of simulated contingencies. The nominal capacity of each generator Sig is then adjusted by adding 15% spare capacity according to Sig =
Pig / 0.85 for each simulated case. In case the resulting Sig is larger than the nominal apparent power of the generators it is set to the nominal value. This means that there is no room for conventional generation disconnection in this case. The disconnection of conventional generation due to both load variations and RES penetration is considered in the following way. Since the generators are considered equivalent generators, reducing the nominal power, is equivalent to a reduction in the moment of inertia of the power plant and an increase in the generator reactance. It should be noted that introducing RES and disconnecting conventional generators is expected to cause changes in the dynamic behavior of the generators.
C. Application of RQA on Generator Rotor Angle Responses
Initially, three representative Test Cases (TCs) chosen from a large number of performed MC simulations are chosen as shown in Fig. 2. TC1 is well damped, TC2 is exhibiting oscillations with growing amplitude and TC3 has sustained oscillations indicating poor damping. RR and DET are calculated for all 16 generators in the system and presented in Fig. 3. In the specific studied system under the given operating conditions considered, the three TCs presented are representative rotor angle responses after a disturbance, which are “first-swing” stable.
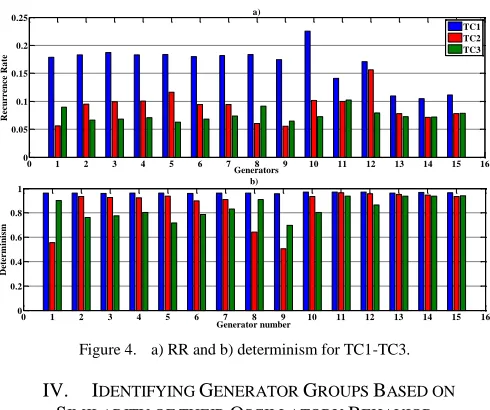
In Fig. 4, the values of RR and DET are presented for the three TCs. In cases TC2 and TC3 when growing or sustained oscillations are observed, low values for both RR and DET are obtained for the generators exhibiting this behavior. However, higher values are obtained for the well damped oscillations of TC1. More specifically G1, G8 and G9 in TC2 which exhibit growing oscillations, have the lowest RR and DET values. In a similar manner G2-G7, G9 and G10 in TC3, exhibit poorly damped oscillations and therefore have low values of RR and DET. On the other hand, G10 and G12 in TC2 are examples that exhibit well damped oscillations and therefore have higher RR and DET values. Furthermore, in TC1 G11 and G14-G16 have relatively low RR values (compared to the rest of the generators) but high DET values. The relatively low RR values indicate lower damping in the responses of these generators compared to the rest (G1-G10, G12) for this TC. However, the responses are still well damped and RR has larger value (more than 0.1) compared to oscillatory unstable cases in TC2 and TC3. It can be concluded that the information from the values of RR and DET could be useful to detect poorly damped and oscillatory behavior in the system.
In general, we can summarize three distinct behaviors of the specific test system under the operating conditions studied: 1) Generators that exhibit both low values of RR (lower than approximately 0.1) and low DET values at the same time. These generators either exhibit poorly, or negatively damped oscillations. 2) Generators that exhibit relatively low values of RR (but higher than 0.1) and high values of DET. This usually suggests damped oscillations but with higher settling time
G7
G6 G4
G5 G3 G2
G8 G1
G9
G16
G15
G14 G12 G13
G11
G10 NEW ENGLAND TEST SYSTEM NEW YORK POWER SYSTEM
9
29 28
26 25
8 54
1 53
47 48 40
10 31 46
49 11 30
32 33 34 61 36
12
17 13 43
44 39
45 35 51
50
60 59
57
55 52
27 37
3 2
4 5 7 6
22 21
23
68 24
20
19 62 65
63 58 64 66 67 56
16 18
15
42
14
41 L44
L43
L71
L66
L69 L41
L42
L45
(lower damping). 3) Generators that exhibit high RR and DET values at the same time which suggests well damped responses.
[image:4.612.53.298.286.491.2]Figure 3. Generator rotor angles for a) well damped response – TC1, b) growing oscillations – TC2 and c) sustained oscillations – TC3.
Figure 4. a) RR and b) determinism for TC1-TC3.
IV. IDENTIFYING GENERATOR GROUPS BASED ON SIMILARITY OF THEIR OSCILLATORY BEHAVIOR
A. Clustering Generator Responses
In order to identify groups of generators that exhibit similar oscillatory behavior for a given disturbance, the k-Means clustering algorithm is applied using RR and DET of the rotor angles of the 16 generators as features. The number of clusters is chosen as 2, in order to identify two groups of generators for each contingency; one with poorly or negatively damped oscillations and one with well damped oscillations. It should be noted that clustering the generators in two groups does not necessarily mean that one group is well damped and the other poorly damped. There are also cases when all generators exhibit well damped responses. In this case, one group will be relatively more oscillatory than the other, as for example in TC1. For this reason it is also important to observe the cluster centroids as presented later in this section.
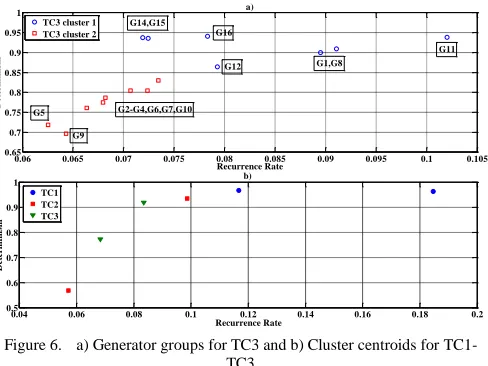
The clusters obtained match with the described behavior for all three TCs and are presented in Figs. 5 and 6. As mentioned before, in TC1 the responses of all generators are well damped. Both groups have high values of DET (greater
than 0.95) and RR values greater than 0.1. The first group, consisting of G1-G10 and G12, has better damped responses while the second group consisting of G11 and G14-G16 has relatively lower damping. In TC2, the second group consisting of G1, G8 and G9 exhibit responses with negative damping while the responses of the rest of the generators are positively damped. The second group has low values of both DET (lower than 0.65) and RR (lower than 0.07). G14-G16 also exhibit relatively low damping with RR values higher than 0.07. However, DET has values higher than 0.9. For TC3, the second group, consisting of G2-G7, G9 and G10 exhibit sustained oscillations with very low damping while the rest of the generators have better damped responses.
In general, values of RR lower than approximately 0.07 and DET lower than approximately 0.85 suggest the existence of either poorly or negatively damped oscillations. It should be mentioned that more than two groups of generators could have been defined in some cases as it can be seen in Figs 5 and 6. However, the number of clusters defined by k-Means is chosen to be 2 since the main aim is to identify the group of generators possibly requiring additional stabilizing control actions.
[image:4.612.314.562.508.670.2]Apart from the obtained groups through clustering, it is also essential to observe the position of the cluster centroids in order to draw conclusions about the behavior of the group. For example, some of the groups might not require additional stabilizing control actions and vice versa. The centroids of the two clusters for the three representative TCs are presented in Fig. 6b. For TC1 where all oscillations are well damped, both cluster centroids have high DET values and RR value is larger than 0.1. For TC2 one cluster has very low values of both RR and DET, indicating that this is the group with negatively damped oscillations. TC3 is similar to TC2 with the two clusters being closer. For the group exhibiting sustained oscillations (G2-G7, G9, G10) the cluster centroid has RR value lower than 0.07 and DET lower than 0.8. Therefore, by observing the cluster centroids for each case, information on the oscillatory behavior of the generator groups can be extracted.
Figure 5. Generator groups for a) TC1 and b) TC2
0 100 200 300 400 500 600 700 800 900 1000 0
20 40 60
80 a) TC1
Samples
R
o
to
r
a
ng
le
(deg
)
G1 G2 G3 G4 G5 G6 G7 G8 G9 G10 G11 G12 G13 G14 G15 G16
0 100 200 300 400 500 600 700 800 900 1000
0 20 40 60
80 b) TC2
Samples
R
o
to
r
a
ng
le
(deg
)
0 100 200 300 400 500 600 700 800 900 1000
0 50 100 150
c) TC3
Samples
R
o
to
r
a
ng
le
(deg
)
0 1 2 3 4 5 6 7 8 9 10 11 12 13 14 15 16
0 0.05 0.1 0.15 0.2
0.25 a)
Generators
R
ecurrence
R
a
te
TC1 TC2 TC3
0 1 2 3 4 5 6 7 8 9 10 11 12 13 14 15 16
0 0.2 0.4 0.6 0.8
1 b)
Generator number
D
eterm
ini
sm
0.1 0.12 0.14 0.16 0.18 0.2 0.22 0.24
0.955 0.96 0.965 0.97 0.975
0.98 a)
Recurrence Rate
D
eterm
ini
sm
TC1 cluster 1 TC1 cluster 2
0.04 0.06 0.08 0.1 0.12 0.14 0.16
0.5 0.6 0.7 0.8 0.9
1 b)
Recurrence Rate
D
eterm
ini
sm
TC2 cluster 1 TC2 cluster 2
G1-G8
G9 G1 G8
G14-G16 G11
G2-G7,G10-G11
G12 G9
G12
G10 G15
G16
Figure 6. a) Generator groups for TC3 and b) Cluster centroids for TC1-TC3
The proposed clustering procedure can be used in an online manner after a disturbance occurs. An online identification method of power system transient stability status as proposed in [1] can be initially used to distinguish between the stable and unstable cases. If a “first-swing” stable case is detected the clustering methodology presented in this section can be applied to identify groups of generators with poorly or well damped oscillations.
B. Application of Clustering to a Large Number of MC Simulations
The k-Means clustering algorithm (with k=2) is also applied to all the MC simulated contingencies. The overall number of distinct patterns identified is 323 due to the large number of possible combinations between the 16 generators of the system. The most common patterns (observed more than 50 times) and accounting for approximately 70% of all simulated cases are presented in Table II.
The three most common patterns are number 3, 6 and 5 which correspond to well damped responses with one group exhibiting better damped responses than the other. The group with better damped responses varies slightly between these patterns and consists mainly of generators of NETS and NYPS area (pattern 6), with some generators from NYPS area being removed from this group according to the specific pattern. For example, G11 is removed from the group exhibiting better damping in pattern 3 and both G11 and G12 in pattern 5. Patterns 1, 4, 9 and 12 are examples of patterns when poorly damped oscillations are observed. Patterns 1 and 12 are again slight variations with G10 and G12 being added to the group exhibiting poorly damped oscillations in pattern 12.
In Fig. 7 the cluster centroids for all the cases that pattern 1 is observed, are presented as an example. Group 1 and 2 are defined in the order shown in Table II. The two groups are clearly defined for all the cases. However, this might not be the case for all the patterns. Moreover, there can be variations in the location of the centroids from case to case. For the pattern shown in Fig. 7, the maximum variation of the RR value of the centroid is approximately 25%. It is therefore important to observe the centroids of the obtained clusters for each specific case in order to draw conclusions about the dynamic behavior of the generators belonging to each group.
TABLE II. GENERATOR GROUPING PATTERNS
Pattern Grouping % of
occurrences
1 (G2-G7,G9)/(G1,G8,G10-G16) 3.44 2 (G1,G8,G11-G16)/(G2-G7,G9,G10) 2.97 3 (G1-G10,G12)/(G11,G13-G16) 18 4 (G1,G8,G9)/(G2-G7,G10-G16) 2.13
5 (G1-G10)/(G11-G16) 5.44
6 (G1-G12)/(G14-G16) 15.88
7 (G1,G9)/(G2-G8,G10-G16) 1.5
8 (G1-G9,G14,G16)/(G10-G12,G15) 1.09
9 (G1-G8,G10-G16)/(G9) 3.65
10 (G1-G3,G8,G11-G16)/(G4-G7,G9,G10) 1.76
11 (G1-G11,G14-G16)/(G12) 3.57
12 (G1,G11,G14-G16)/(G2-G7,G9,G10,G12)
3.84
13 (G1,G9,G11,G14-G16)/(G2-G8,G10,G12)
0.97
14 (G1-G9,G14-G16)/(G10-G12) 1.29
15 (G1-G9)/G10-G16) 2.9
16 (G1-G4,G6-G8,G10-G16)/(G5,G9) 1.18 17
(G1,G2,G8-G11,G14-G16)/(G3,G4-G7,G12)
0.95
Figure 7. Cluster centroids for all the cases for which the pattern 1 occurs.
C. Dynamic Behavior of Individual Generators
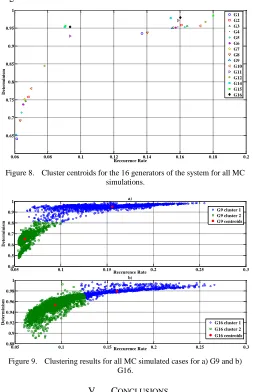
From the MC simulations performed, the dynamic behavior of each individual generator is also investigated. K-Means is used again but this time to cluster the rotor angle responses of each generator separately into poorly or well damped for all the MC simulated cases. RR and DET are again used as features but the observations this time are the Ns simulations for each generator separately. This way, two cluster centroids for each generator are obtained that describe its dynamic behavior, considering the uncertainties described earlier. The centroids for the 16 generators are shown in Fig. 8.
By observing the locations of the centroids of the two clusters for each generator we can conclude that G1-G10 exhibit poorly damped oscillations in some cases, since one of their cluster centroids is exhibiting low values of both RR and DET (as in TC2, TC3). On the other hand, for G11-G16 both clusters have relatively higher values of RR and especially DET which points to better damped oscillations (as in TC1). A representative example for G9 and G16 is also shown in Fig. 9 for all the simulated responses. It is concluded, that the cluster 0.06 0.065 0.07 0.075 0.08 0.085 0.09 0.095 0.1 0.105
0.65 0.7 0.75 0.8 0.85 0.9 0.95
1 a)
Recurrence Rate
D
eterm
ini
sm
TC3 cluster 1 TC3 cluster 2
0.04 0.06 0.08 0.1 0.12 0.14 0.16 0.18 0.2
0.5 0.6 0.7 0.8 0.9
1 b)
Recurrence Rate
D
eterm
ini
sm
TC1 TC2 TC3
G14,G15 G16
G12
G2-G4,G6,G7,G10
G1,G8
G5
G9
G11
0.05 0.055 0.06 0.065 0.07 0.075 0.08 0.085 0.09 0.095 0.1 0.65
0.7 0.75 0.8 0.85 0.9 0.95 1
Recurrence Rate
D
eterm
ini
sm
centroids are a rough indication of the generator dynamic behavior. Individual cases with different behavior extending relatively far from the cluster centroid might exist, as shown in Fig. 9.
Figure 8. Cluster centroids for the 16 generators of the system for all MC simulations.
Figure 9. Clustering results for all MC simulated cases for a) G9 and b) G16.
V. CONCLUSIONS
The paper presented a Recurrence Quantification Analysis based methodology to cluster generators based on similarity of their post disturbance oscillatory behavior. The methodology focuses on cases that do not exhibit aperiodic first-swing instability. It is shown that two RQA metrics (Recurrence Rate and Determinism) can be used to identify features relevant to frequency and damping but not the amplitude of the generator oscillatory responses. RR and DET of generator rotor angle responses can be used as parameters for the k-Means clustering algorithm to cluster generators in groups exhibiting well or poorly damped oscillations. The centroids of the clusters need to be observed in order to draw conclusions about the dynamic behavior of the generators belonging to each group. In general low values of RR and DET (lower than 0.07 and 0.85 respectively) suggest poorly or negatively damped oscillations. The methodology presented can be used online (following the disturbance) to trigger possible stabilizing control actions in cases that does not lead to aperiodic instability. The dynamic behavior of individual generators is also investigated by applying k-Means clustering
on a large number of rotor angle responses with RR and DET used as input parameters. The obtained centroids can provide a rough estimate of the oscillatory behavior of each generator, considering the uncertainties present in power systems.
In general, it is shown that RQA metrics can provide sufficient information that can be used by a clustering algorithm to distinguish between well damped and poorly damped oscillations. RQA can be directly applied to nonlinear non-stationary data and thus its application is straightforward. However, since RR and DET do not directly have a physical meaning related to damping, frequency and especially amplitude of oscillations, observation of a large number of disturbances for a given system is required to draw useful conclusions.
REFERENCES
[1] T. Guo and J. V Milanović, “Online Identification of Power System Dynamic Signature Using PMU Measurements and Data Mining,”
IEEE Trans. Electron Devices, 2015, available online.
[2] I. Kamwa, A. K. Pradhan, and G. Joos, “Automatic segmentation of large power systems into Fuzzy coherent areas for dynamic vulnerability assessment,” IEEE Trans. Power Syst., vol. 22, pp. 1974– 1985, 2007.
[3] K. K. Anaparthi, B. Chaudhuri, N. F. Thornhill, B. C. Pal, “Coherency identification in power systems through principal Component analysis,”
IEEE Trans. Power Syst., vol. 20, pp. 1658–1660, 2005.
[4] M. A. M. Ariff and B. C. Pal, “Coherency identification in interconnected power system – an Independent Component analysis approach,” IEEE Trans. Power Syst., vol. 28, pp. 1747–1755, 2013. [5] R. Agrawal, D. Thukaram, “Identification of coherent synchronous
generators in a multi-machine power system using support vector clustering,” in Proc. Int.Conf. Power and Energy Systems (ICPS), India, 22-24 Dec 2011.
[6] P. Bhui and N. Senroy, “Application of Recurrence Quantification Analysis to Power System Dynamic Studies,” IEEE Trans. Power Syst., vol. 31, no. 1, pp. 581–591, January 2016.
[7] N. Marwan,M. C. Romano, M. Thiel, and J.Kurths, “Recurrence plots for the analysis of complex systems,” Phys. Rep., vol. 438, no. 5–6, pp. 237–329, 2007.
[8] J. P. Eckmann, S.O.Kamphorst, D. Ruelle, “Recurrence plots of dynamical systems,” Europhys. Lett., vol. 4, pp. 973–977, 1987. [9] J. Han, M. Kamber, J. Pei, Data mining concepts and techniques.
Waltham, USA: Elsevier, 2012.
[10] G. Rogers, Power System Oscillations. Kluwer Academic, 2000. [11] DIgSILENT-PowerFactory User Manual, DIgSILENT GmbH, 2014. [12] WECC Wind Power Plant Dynamic Modeling Guide, WECC
Renewable Energy Modeling Task Force, January 2014.
[13] P. N. Papadopoulos, T. Guo, X. Wang, J. V Milanovic, “Impact of Penetration of Non-Synchronous Generators on Power System Dynamics,” PowerTech 2015, Eindhoven, June-July, 2015.
[14] Daily load curve data, National Grid, http://www2.nationalgrid.com/UK/Industry-information/Electricity-transmission-operational-data/Data-Explorer/.
[15] M. Fan, V. Vittal, G. T. Heydt, R. Ayyanar, “Probabilistic power flow analysis with generation dispatch including photovoltaic resources,”
IEEE Trans. Power Syst., vol. 28, no. 2, pp. 1797–1805, 2013. [16] Shi Tao, Yu Ruoying, Zhu Lingzhi, Gao Shan, "Power system
probabilistic production simulation containing large-scale wind power and photovoltaic power," in IEEE Asia-Pacific Power and Energy Engineering Conference (APPEEC), Beijing, 8-11 Dec. 2013. [17] R. Preece and J. V. Milanovic, “Tuning of a damping controller for
multiterminal VSC-HVDC grids using the probabilistic collocation Method,” IEEE Trans. Power Deliv., vol. 29, no. 1, pp. 318–326, 2014.
0.06 0.08 0.1 0.12 0.14 0.16 0.18 0.2
0.65 0.7 0.75 0.8 0.85 0.9 0.95 1
Reccurence Rate
D
eterm
ini
sm
G1 G2 G3 G4 G5 G6 G7 G8 G9 G10 G11 G12 G14 G15 G16
0.05 0.1 0.15 0.2 0.25 0.3
0.4 0.5 0.6 0.7 0.8 0.9
1 a)
Reccurence Rate
D
eterm
ini
sm
G9 cluster 1 G9 cluster 2 G9 centroids
0.05 0.1 0.15 0.2 0.25 0.3
0.88 0.9 0.92 0.94 0.96 0.98
1 b)
Reccurence Rate
D
eterm
ini
sm