City, University of London Institutional Repository
Citation:
Reid, B. A., Gavaises, M., Mitroglou, N., Hargrave, G. K., Garner, C. P. & McDavid, R. M. (2015). String cavitation formation inside fuel injectors. Journal of Physics: Conference Series, 656(1), 012099. doi: 10.1088/1742-6596/656/1/012099This is the published version of the paper.
This version of the publication may differ from the final published
version.
Permanent repository link:
http://openaccess.city.ac.uk/13554/Link to published version:
http://dx.doi.org/10.1088/1742-6596/656/1/012099Copyright and reuse: City Research Online aims to make research
outputs of City, University of London available to a wider audience.
Copyright and Moral Rights remain with the author(s) and/or copyright
holders. URLs from City Research Online may be freely distributed and
linked to.
City Research Online: http://openaccess.city.ac.uk/ [email protected]
String cavitation formation inside fuel injectors
B. A. Reid1
,
M. Gavaises2,
N. Mitroglou2,
G. K. Hargrave1,
C.P. Garner1,
and R. M. McDavid31 Wolfson School of Mechanical and Manufacturing Engineering, Loughborough University, Loughborough, Leicestershire LE11 3TU
2 School of Engineering and Mathematical Sciences, City University London, 10 Northampton
Square, London EC1V 0HB, UK
3 Caterpillar Inc., Product Development & Global Technology Division, Mossville IL USA
Abstract.
The formation of vortex or ‘string’ cavitation has been visualised at pressures up to 2000 bar in an automotive-sized optical diesel fuel injector nozzle. The multi-hole nozzle geometry studied allowed observation of the hole-to-hole vortex interaction and, in particular, that of a bridging vortex in the sac region between the holes. Above a threshold Reynolds number, their formation and appearance during a 2 ms injection event was repeatable and independent of upstream pressure and cavitation number. In addition, two different hole layouts and three-dimensional flow simulations have been employed to describe how, the relative positions of adjacent holes influenced the formation and hole-to-hole interaction of the observed string cavitation vortices, with good agreement between the experimental and simulation results being achieved.1. Introduction
Vortex or string cavitation structures have often been observed in the sac volume of enlarged nozzle replicas at fluid pressures of only a few bar (selectively [1-4] and only briefly observed in real-scale nozzle-holes operating at several hundred bar [5, 6]. The present work reports the presence of cavitation strings in a real-scale nozzle to pressures up to 2000bar and explores the influences on the formation of string cavitation at such conditions. In particular, the hole-to-hole interactions of the cavitation strings are investigated with respect to the position of the holes within the injector geometry and the prevailing fluid parameters. This work explores the hypothesis that, by better understanding the formation of string cavitation, the phenomenon can be ultimately be controlled.
2. Experimental set-up
of the nozzle-hole entrances. Two different multi-hole plates were used, having a different hole spacing distance between the two rearward, covered, holes of the triangle. A ‘standard’ spacing of 0.7 mm was complimented by a ‘wide’ spacing of 0.9 mm to investigate the effect of hole separation distance.
Fig 2. Layout and fluid flow path of the manufactured transparent nozzle.
Steady-state and 2 ms duration transient injections were delivered to the nozzle at pressures (Prail) up to
2000 bar. Nozzle back pressure, Pback, was created by injecting into a pressurised nitrogen chamber
downstream of the nozzle. Imaging of the internal nozzle flow was carried out using high speed imaging and single-shot photography, both utilising pulsed laser illumination of the nozzle flow to produce short-exposure images that ’froze’ the flow features being imaged.
3. CFD Simulations
In the absence of quantitative measurements of the pressure and velocity fields in the areas where cavitation forms and develops, the computational fluid dynamics (CFD) code of [7] was utilised; Use of CFD was considered essential not only for assisting in the interpretation of the acquired images but also during the design process of the specific test nozzles utilised here.
4. Results
The first stage of the investigation used the rig in its steady-state configuration running at a ‘low’ pressure of Prail = 150 bar.
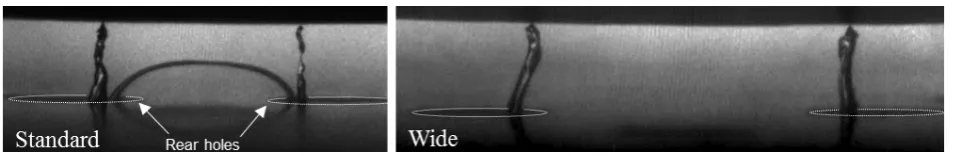
Fig. 3: Representative flow images obtained for the two different nozzles tested.
[P
rail= 150 bar, P
back= 20 bar]
Two distinct two-phase flow structures were observed: the ‘bridging’ string that connects the two holes and two vertical strings, one in each hole, appearing to the side of the bridging string. The absence of the bridging string in the wide case, indicated that the formation of the vortex depends on hole spacing and the subsequent interaction of vortices from both holes. It was noted that the absence of the bridging string in the wide case resulted in the increased stability of the vertical string
[image:3.595.71.548.584.662.2]formation, where the two vertical strings were observed in both holes in almost every frame of the high speed video contrasting with their frequent but intermittent appearance in the standard case.
Fig. 4. CFD simulations of the flow inside and upstream of the injection hole inlet (a) vortex core illustration for standard spacing and (b) vortex core illustration for wide spacing nozzles.
[Prail = 150 bar, Pback= 20 bar]
[image:4.595.177.419.414.493.2]Increasing the injection pressure to c.2000 bar and running under transient injection conditions resulted in no change in the appearance of the cavitation strings for the standard hole spacing, as shown in figure 5, with the two vertical strings and the bridging string still present and of similar dimensions; changes to back pressure, between 1 and 90 bar, at these elevated inlet pressures also had no apparent effect on the appearance of the cavitation.
Fig. 5. Image of the cavitation string formation in the sac volume for the standard hole-spacing geometry for Prail = 2050 bar. Pback = 90 bar. t = 1 ms ASOI
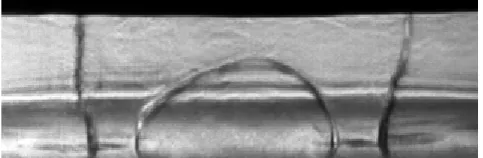
However, for the wide spacing case, when the injection pressure reached 2000 bar the formation of the bridging string was also observed to occur, as shown by the image in Figure 6. The formation of the bridging string at this injection pressure was also successfully captured by the CFD simulations.
Fig. 6. Frame grab of the cavitation string formation in the sac volume for the wide hole-spacing geometry for Prail = 2000 bar. Pback = 1 bar. t = 1 ms ASOI, and the corresponding CFD simulation
5. Conclusions
1. Cavitating flow structures have been visualised at a range of pressures up to 2050 bar in a real-scale flow geometry.
2. The occurrence of the hole-to-hole interaction of cavitation strings, observed here as the bridging string, was found to be affected by the spacing between adjacent holes and the respective flow rate through a particular geometry. As hole spacing was increased the flow rate, or injection pressure, required to form the bridging string was significantly increased. 3. Once formed, increases to the fluid pressure, or reductions in back pressure, have no influence
on the appearance of cavitation strings.
Acknowledgements
This work has been technically and financially supported by Caterpillar Inc. and the UK Technology Strategy Board. Project No, TP/3/DSM/6/I/15289. This project was co-funded by the Technology Strategy Board's Collaborative Research and Development programme, following an open competition.
The Technology Strategy Board is an executive body established by the Government to drive innovation. It promotes and invests in research, development and the exploitation of science, technology and new ideas for the benefit of business - increasing sustainable economic growth in the UK and improving quality of life.