City, University of London Institutional Repository
Citation
:
Berlanga, R., Jimenez-Ruiz, E. ORCID: 0000-0002-9083-4599 and Nebot, V.
(2012). Exploring and linking biomedical resources through multidimensional semantic
spaces. BMC BIOINFORMATICS, 13(Supp 1), S6. doi: 10.1186/1471-2105-13-S1-S6
This is the accepted version of the paper.
This version of the publication may differ from the final published
version.
Permanent repository link:
http://openaccess.city.ac.uk/id/eprint/22944/
Link to published version
:
http://dx.doi.org/10.1186/1471-2105-13-S1-S6
Copyright and reuse:
City Research Online aims to make research
outputs of City, University of London available to a wider audience.
Copyright and Moral Rights remain with the author(s) and/or copyright
holders. URLs from City Research Online may be freely distributed and
linked to.
City Research Online:
http://openaccess.city.ac.uk/
[email protected]
R E S E A R C H
Open Access
Exploring and linking biomedical resources
through multidimensional semantic spaces
Rafael Berlanga
1*, Ernesto Jiménez-Ruiz
2, Victoria Nebot
1From
Semantic Web Applications and Tools for Life Sciences (SWAT4LS) 2010
Berlin, Germany. 10 December 2010
Abstract
Background:The semantic integration of biomedical resources is still a challenging issue which is required for effective information processing and data analysis. The availability of comprehensive knowledge resources such as biomedical ontologies and integrated thesauri greatly facilitates this integration effort by means of semantic annotation, which allows disparate data formats and contents to be expressed under a common semantic space. In this paper, we propose a multidimensional representation for such a semantic space, where dimensions regard the different perspectives in biomedical research (e.g., population, disease, anatomy and protein/genes).
Results:This paper presents a novel method for building multidimensional semantic spaces from semantically annotated biomedical data collections. This method consists of two main processes: knowledge and data
normalization. The former one arranges the concepts provided by a reference knowledge resource (e.g., biomedical ontologies and thesauri) into a set of hierarchical dimensions for analysis purposes. The latter one reduces the annotation set associated to each collection item into a set of points of the multidimensional space. Additionally, we have developed a visual tool, called 3D-Browser, which implements OLAP-like operators over the generated multidimensional space. The method and the tool have been tested and evaluated in the context of the Health-e-Child (HeC) project. Automatic semantic annotation was applied to tag three collections of abstracts taken from PubMed, one for each target disease of the project, the Uniprot database, and the HeC patient record database. We adopted the UMLS Meta-thesaurus 2010AA as the reference knowledge resource.
Conclusions:Current knowledge resources and semantic-aware technology make possible the integration of biomedical resources. Such an integration is performed through semantic annotation of the intended biomedical data resources. This paper shows how these annotations can be exploited for integration, exploration, and analysis tasks. Results over a real scenario demonstrate the viability and usefulness of the approach, as well as the quality of the generated multidimensional semantic spaces.
Background
The ever increasing volume of web resources as well as generated data from automated applications is challen-ging current approaches for biomedical information pro-cessing and analysis. One current trend is to build semantic spaces where biomedical data and knowledge resources can be mapped in order to ease their explora-tion and integraexplora-tion. Semantic spaces are usually defined
in terms of widely accepted knowledge resources (e.g. thesauri and domain ontologies), and they are populated by applying (semi)automatic semantic annotation pro-cesses. This is the result of a decade of integration initiatives aimed at inter-linking and merging publicly available biomedical databases (see [1] for a recent review). Most of these initiatives have followed a ware-housing approach, where existing data are loaded into a central store under a common schema (e.g., BioMART [2], EcoCyC [3], and Ondex [4]). Recently, with the emergence of the Web of Data [5], this integration effort * Correspondence: [email protected]
1
Departamento de Lenguajes y Sistemas Informáticos, Universitat Jaume I, Campus Riu Sec s/n, E-12071 Castellón, Spain
Full list of author information is available at the end of the article
is being performed in the context of the Semantic Web under standard formats like RDF [6] and OWL [7].
Additionally to these integration projects, literature based discovery (LBD) [8] has aimed at inferring implicit knowledge by mining scientific papers. LBD approaches also take profit from knowledge resources in order to identify biomedical entities in the texts as well as their associations (see the recent reviews in [9], [10] and [11]).
Visualization tools play a very relevant role in integra-tion and LBD projects. This is because summarized visual information is required for analyzing the huge amount of data involved in these projects. In this con-text, visual inference has shown useful in many biomedi-cal research projects [11]. The main visual representation adopted in these projects is the concep-tual map, where entities (or concepts) and their asserted or inferred associations are visualized as a graph. Cytos-cape [12] and Ondex [4] are the main representatives for integration projects, and Telemakus [13] and LitLin-ker [14] are examples of visualization tools for LBD.
The main limitation of current visualization tools is that they have been developed as stand-alone applica-tions, requiring all the data to be locally loaded and pro-cessed. This makes it unfeasible to deal with very large data collections as well as to visualize the information in portable small devices such as mobile phones and tablets. Clearly, a web-based architecture is more appro-priate for performing visual analysis tasks over huge amounts of integrated data. However, as far as we know, there are no web-based interfaces providing rich and dynamic visualizations for analyzing biomedical data. Instead, web services are designed to provide discovered knowledge and biomedical data in plain formats (e.g., [15-17]). Our approach proposes the use of On-Line Analytical Processing (OLAP) techniques [18] to inte-grate and visualize large collections of biomedical data from conventional web browsers. OLAP technology has shown very successful for analyzing summarized data from different perspectives (dimensions) and detail levels (categories). Part of this success is due to its sim-plicity in data structures and its efficiency performing data summaries. In a typical OLAP architecture, data are integrated and pre-processed in the back-end (e.g., a data warehouse), so that the amount of data users receive in the client side (e.g., a web browser) is drama-tically reduced. Moreover, OLAP tools provide a series of operators that allow users to interact with the sum-marized information as well as to get more detailed information of those parts she wishes to explore. All these features overcome the previously mentioned lim-itations of current biomedical visualization tools. In this paper, we propose a novel method for building multidi-mensional semantic spaces from semantically annotated
biomedical databases. The main aims of these semantic spaces are: to provide a summarized view of the data sources, to find interesting associations between con-cepts present in the collection, and to visualize the col-lection contents for exploration purposes. As in most of the reviewed visualization tools, conceptual maps have been also adopted in our approach to visualize the inte-grated data. However, our conceptual maps have three main distinctive features: (1) concepts are arranged into a set of pre-defined biomedical research perspectives, (2) the visualization is oriented to perform OLAP-based operations, and (3) the visualization is rendered in a 3D scenario. The first feature enables a more structured visualization, where associations (called bridges) must involve entities of different levels (e.g., Disease versus Protein). The second feature is related to the interactiv-ity of the user with the visualized data. Finally, the latter feature allows a better use of the space to allocate as much data as possible. It must be pointed out that con-ceptual maps are dynamically built from the web brow-ser according to the ubrow-sers requirements, by selecting the appropriate levels to be visualized. The current imple-mentation of this method is publicly available in [19] for testing purposes.
The paper is organized as follows. First, the Methods Section is devoted to introduce the methodological aspects of our approach. First, we describe the normali-zation formalism to represent both the knowledge resources and the target data collections, and the OLAP-like operators defined over the normalized repre-sentation (i.e., multidimensional space). Afterwards, in the Results Section, we describe some use examples to show the functionality of the implemented prototype, and the experiments carried out to evaluate the quality of the visualized data. Finally, we give some conclusions and future work.
Methods
the data to provide an alternative presentation, and drill-through, which accesses the detailed data that is involved in the summary.
Since multidimensional models provide a friendly, easy-to-understand and intuitive visualization of data for non-expert end-users, we have borrowed the previous concepts and operations to apply them to the proposed conceptual maps.
This section is devoted to present the necessary meth-ods to generate and manage multidimensional semantic spaces.
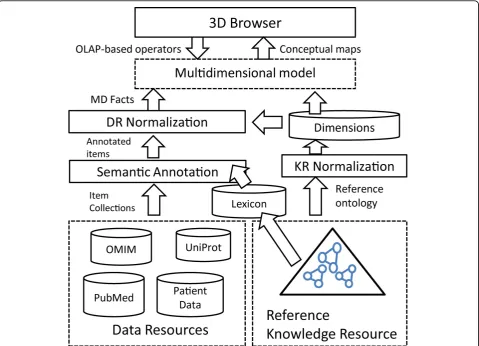
Overview of the architecture
Unlike other visual integration approaches like Ondex [4], in our approach knowledge resources (KRs) are dis-tinguished from data resources (DRs). KRs are well-structured databases consisting of concepts and their relationships (e.g., GO and UMLS), whereas DRs are any kind of biomedical database to be integrated under some reference KR. DRs are usually semi-structured and text-rich (e.g., PubMed abstracts, patient records, the
OMIM database [21], Uniprot, and so on). For the sake of simplicity, we assume that a DR consists of a collec-tion of uniquely identified items, whose contents can present arbitrary structures (e.g., relational, XML, plain text, etc.)
Figure 1 summarizes the proposed method for generat-ing browsable analytical semantic spaces. As a first step, the DRs and the reference KR must be normalized. KR normalization consists in organizing the KR concepts into a well-structured multidimensional schema, whereas DR normalization consists in representing the DR’s items under this schema. Multidimensional schemas are set up in terms of a series of predefined dimensionswhich roughly representsemantic groups. For example, in sys-tems biology, a semantic group can comprise entity types playing a specific role, for exampleGene,mRNA, Poly-peptide,Physiological_FunctionandMetabolite. In the biomedical domain, examples of dimensions are Popula-tion,Disease,Organ,Tissue, and so on.
[image:4.595.59.539.355.701.2]DR normalization is performed in two steps: (1) semantic annotation of the DR collection items with
concepts from the reference KR, and (2) normalization of each collection item to the multidimensional schema derived from the normalized KR. The subsequent sec-tions are devoted to describe in detail these normaliza-tion processes as well as the generanormaliza-tion of semantic bridges.
Semantic annotation
During the last years, we have witnessed a great interest in massively annotating biomedical scientific literature. Most of the current annotators rely on well-known lexi-cal/ontological resources such as MeSH, Uniprot, UMLS and so on. These knowledge resources usually provide both the lexical variants for each inventoried concept and the concept taxonomies.
In our work, the knowledge resource used for generat-ing semantic annotations is called reference ontology, denoted withO. The lexical variants associated to each ontology conceptc are denoted withlex(c), which is a list of strings. The taxonomic relations between two concepts aandb are represented asa≼b. A semantic annotation of a text chunk T is the task of identifying the most specific concepts inOsuch that they are more likely to represent the meaning ofT.
Most semantic annotation systems are dictionary look-up approaches, that is, they rely on the lexicon provided by the ontology in order to map text spans to concept lexical variants. Some popular annotation systems in the biomedical domain are Whatizit [22] and MetaMap [23], which rely on GO and UMLS resources respectively.
It must be pointed out that MetaMap has been widely used in literature-based discovery to identify biomedical entities in the mined texts. However, this kind of tool does not scale well for very large collections. To overcome this limitation, annotations are restricted to a few entity types
or to the MeSH controlled vocabulary. Another limitation of this tool is that it is not extensible with new concepts and lexical variants coming from other KRs.
In our work we have adapted an annotation system called Concept Retrieval (CR) [24], which scales well over large collections as well as large KRs. Moreover, this system can easily include any kind of KR and deal with merged KR lexicons. This annotation system was tested in the two CALBC competitions [25,26] over a collection of 864 thousand PubMed abstracts about immunology [27], which is annotated in less than 8 hours.
The idea behind the CR system consists in ranking the lexical strings of the lexicon with respect to each target text chunkTby applying the following formula:
rank(Si,T) =
idf(Si)−idf(Si−T)
idf(Si) ·
|Si∩T|
ambiguity(Si)
Concept strings Siand text chunks T are represented as bags of words. The function idf(S) represents the amount of information contained in the concept string S, which is estimated as follows:
idf(S) =− w∈S
p(w|Background)
In the current implementation we use the whole Wiki-pedia as theBackground collection for estimating word probabilities. Finally, the functionambiguity(S) returns the number of concepts that have S as lexical variant. To sum up, the formula above promotes those strings with high information amount, long matches, and low ambiguity degree.
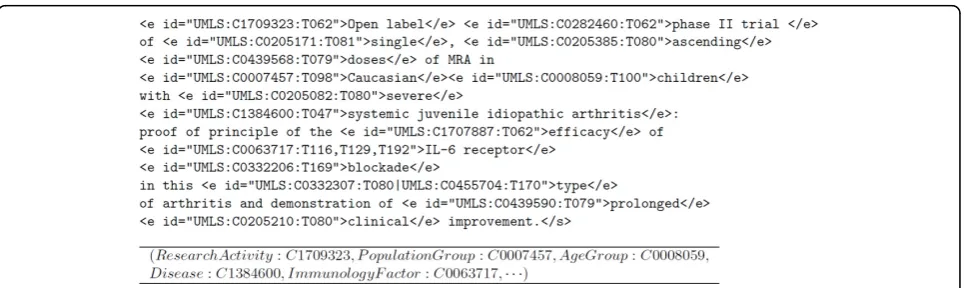
[image:5.595.58.541.540.684.2]The final annotation is generated by taking the top ranked concepts that cover as many words as possible from the text chunkT. As an example, Figure 2 shows
the semantic annotations generated by the CR annotator.
Knowledge resource normalization
In order to build semantic spaces for analyzing docu-ment collections, the reference ontologyO associated with the knowledge resource has to be normalized into a well-structured multidimensional schema. The main issue to be addressed in this process is to manage the highly irregular structures of the KR taxonomies. With this issue in mind, the KR normalization is performed as follows:
• First a set of dimensions are defined, (D1, ...Dn), which represent a partition of the concepts in the domain ontology. Each dimension Di represents a different semantic space (e.g. semantic types or verti-cal levels), and cannot share any common sub-con-cept with the other dimensions.
•Each dimensionDican define a set of categories or levels Li
j, which forms in turn a partition over Dibut with the following constraints: (1) there cannot be two conceptscandd inLi
jsuch that eitherc ≼d or
d ≼c, and (2) all the concepts inLi
jhave a common super-concept that belongs to Di. By imposing these constraints we ensure summarizability and good OLAP properties for the generated dimensions hierarchies.
•In order to efficiently build the dimensions hierar-chies from the reference ontologyOwith such con-straints, we index the taxonomic relationships using intervals as presented in [28]. This way, every concept ofOhas associated two sets of intervals correspond-ing to its ancestors (L+) and descendants (L−) in the
ontology. By using an interval’s algebra over this representation, we are able to query about the taxo-nomic relationships between concepts as well as to compute common ancestors and descendants. For example, let c= ([4, 9]-, [9, 10]+) andd= ([7, 7]-, [3, 3]+, [6, 11]+) be two indexed concepts. We inferd≼c because [7, 7]-⊆[4, 9]-. Similarly, we can obtain com-mon ancestors ofcanddby intersecting the intervals of the ancestors space, ([9, 10]+)∩([3, 3]+, [6, 11]+).
In this way, we can automatically build each dimen-sion Di with the ontology fragment obtained with the signature formed by all the concepts identified in the collection (through semantic annotation) and that belong to some semantic group representing the dimen-sion. To obtain the categories of a dimension Di, we take into consideration the taxonomic relationships in the fragment and the previous restrictions over dimen-sions and their categories.
Data resource normalization
After semantic annotation, each item of the target col-lection Colhas associated a list of concepts from the reference ontology O. However, these annotation sets are not suited for multidimensional analysis, and there-fore a normalization process similar to that applied to the ontology must be performed. The main goal of this normalization is to represent the semantic annotations within the normalized multidimensional space described in the previous section. Thus, each itemd∈Colis repre-sented as the multidimensional fact:
fact(d) = (D1=c1,· · ·,Dn=cn)
where ci (0 ≤ i ≤ n) is either a concept from the dimensionDior thenullvalue.
As a semantic annotator can tag more than one con-cept of the same dimension, the normalization process basically consists in selecting the most relevant concepts for each dimension. One issue to take into account in this process is the presence of ambiguous annotations, that is, when more than one concept is assigned to the same text chunk. We say that two concepts are in con-flict when they are included in some ambiguous annota-tion. For example, the string “follow-up” is annotated with two concepts C1704685 (report) and C1522577 (activity), and therefore they are in conflict.
The selection of relevant and right concepts for each document d is performed through a reduction process based on a concept affinity matrix Md of sizeNc ×Nc, whereNc is the number of distinct concepts present in the annotations ofd. The idea behind this matrix is to capture the affinity of the concepts associated to each item, so that the more similar a concept is with its neighbors the more relevant it is. The affinity matrix is calculated as the linear combination of the following matrices:
Md =Misa+Mancs+MR+Mdsents
These matrices are defined as follows:
•Misa(i,j) = 1 iffci≼cjin the reference ontologyO, that is, two concepts are similar if one is a sub-con-cept of the other,
•Manc(i, j) = |common_ancestors(ci,cj)|/g, being ga parameter that depends on the taxonomy depth, that is, the more ancestors two concepts share the more similar they are,
•MR(i,j) = 1 iff∃R(ci,cj)ÎO, that is, two concepts related to each other through some relationRare deemed similar,
•Md
The affinity matrix can be used in many ways to rank the annotation concepts of an item. For example, we can use any centrality-based algorithm to obtain the concept ranking. However, our aim is not only to get the concepts ranking but also to solve the ambiguities produced by the annotation system. For this reason, we require a classification framework able to perform both tasks. The chosen framework is that presented in [29], which is called regularization framework, and which models the classification as an optimization problem over graphs expressed in matrix notation as follows:
Rd= ((1−α)·(I−αSd)−1·YT)T (1) Here,Ris the calculated vector representing the rank of concepts present in the annotations of the collection itemd, denotedCd. This ranking is obtained by finding an optimal smoothed function that best fits a given vec-torY, which is achieved by applying the laplacian opera-tor over the affinity matrixMdas follows:
Sd=D−1/2·Md·D−1/2
The parametera is directly related to the smoothness of the approximation function (we set it toa = 0.9). For disambiguation purposes, each ambiguous annotationA ⊆Cd is associated to a vectorY whereYi= 0 if ciÎ A and 1 otherwise. After computing Rd with this vector, we can reject all the ambiguous concepts inA whose score is lower than the maximum in Rd. Rejected con-cepts imply a reduction in the matrix Md, and we can apply again the disambiguation process until no more concepts are rejected. For ranking purposes, the vector Yconsists of the frequencies of each concept within the itemd. Once the rankRdis obtained, the normalization process selects the top-scored concepts of each dimen-sion to represent the d’s fact. As an example, Figure 2 shows the resulting fact for the example tagged text. Since collection items are mapped to a set of disjoint dimension concepts in the resulting conceptual map, the relevance of each concept can be measured in terms of the items that support it. The relevance of a concept c
Î Ocan be calculated by aggregating the relevance of its sub-concepts w.r.t each specific collection. Formally,
RelCol(c,Di) =∀c∈descendants(Di,c)scoreCol(c)
whereΓis an aggregation function (e.g., sum, avg, and so on) and scoreis the function that is evaluated against the collection. The simplest scoring function is the number of hits, namely:
scoreCol(c) =hitsCol(c) =count({d|d∈Col,fact(d)[Di] =c})
Alternatively, the scoring function can take into account the relevance of each concept in the items it
appears. Thus, we can aggregate the relevance scores estimated to select concept facts as follows:
scoreCol(c) =
d∈Col,∃i,fact(d)[Di]=c Rd[c]
Semantic bridges
A semantic bridge is any interesting association between concepts of two different dimensions. Interesting associa-tions can be derived from the facts extracted from the target data sources. Figure 3 illustrates the notion of semantic bridge by means of an example. Next, semantic bridges are formally introduced. Given two dimension levelsLi
nandLjm, belonging to dimensionsDiandDj(i≠
j) respectively, the following cube stores the aggregated contingency tables necessary for correlation analysis:
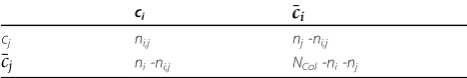
CUBECol(Lin,Ljm) ={(ci,cj,ni,j,ni,nj)|ci∈Lin∧cj∈L j m} Hereni,jmeasures the number of objects in the collec-tion where ci and cj co-occur, ni is the number of objects where cioccurs, and njis the number of objects wherecjoccurs. Notice thatniand njare calculated in a similar way as concept relevance. The contingency table for each pair (ci,cj) is calculated as shown in Table 1.
The measuresni,j,niandnjare calculated as follows:
ni,j={d|d∈Col∧fact(d)[Di]ci∧fact(d)[Dj]cj}
ni ={d|d∈Col∧fact(d)[Di]ci}
nj ={d|d∈Col∧fact(d)[Dj]cj}
Semantic bridges can be now calculated from contin-gency tables by defining a scoring functionj(ci,cj). In this way, bridges will be those concept associations whose scores are greater than a specified thresholdδ:
BridgesφCol(Li,Lj) ={(ci,cj,φ(ci,cj))|φ(ci,cj)> δ} In association analysis [30], scoring functions are used to measure the kind of correlation one can find between several items. Traditionally, the confidence of the ruleci
®cjhas been used, which is defined as:
φ(ci,cj) =conf(ci,cj) =
ni,j
ni
However, this measure presents some limitations. For example, it is not able to distinguish between positive and negative correlations. Thus, other measures like the interest factor can be used instead:
φ(ci,cj) =IF(ci,cj) =
ni,j·N
ni·nj
interestingness measures to find all the interesting bridges between two levels. Examples of these measures are log likelihood ratio, mutual information and F1-mea-sure. More information about this kind of measures can be found in [30].
One special kind of bridges are those that maximize some interestingness measure for each pair of concepts of the two compared levels. We call these bridges δ -maximum interesting pairs. These bridges will serve us for evaluating the quality of the generated bridges for different collections.
From the implementation point of view, bridges can be either pre-calculated and stored in the back-end or generated on the fly. In the former case, the pre-calcula-tion of all the bridges for all the level combinapre-calcula-tions can result in very large data sets. In the latter case, although it makes the browser slightly slower, the calculation is only performed when drilling-down a concept, which usually involves a few new concepts, and therefore it is
efficient to calculate their bridges w.r.t. the visualized concepts.
Operations over the conceptual map
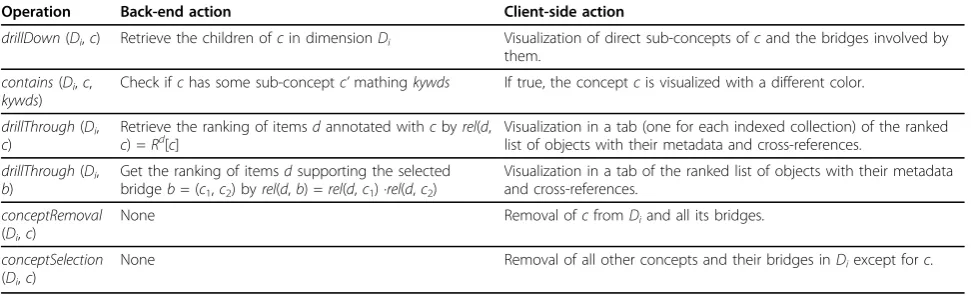
Our main aim is to build a browsable representation of the semantic spaces defined previously. For this purpose, we define the conceptual map as a sequence of different layers that correspond to different dimensions expressed at some detail level (category). In this map, concepts are visualized as balls, which are placed within their corre-sponding layer with a size proportional to their rele-vance w.r.t. the target collection. Concept bridges (or conceptual associations) are visualized as links between concepts of adjacent layers. Conceptual maps are built from the normalized conceptual representation described previously. Table 2 summarizes the main operations over conceptual maps.
Results
[image:8.595.58.539.88.335.2]The work presented in this paper has been mainly developed in the context of the European Health-e-Child (HeC) integrated project [31,32]. HeC aimed to develop an integrated health care platform to allow clin-icians to access, analyze, evaluate, enhance and exchange integrated biomedical information focused on three pediatric domains: heart disorders, inflammatory disor-ders and brain tumors. The biomedical information Figure 3Graphical representation of a semantic bridge.D1,D2andD3are the dimension hierarchies. The normalization of each document
dociinto a fact is represented by the document pointing to the selected concept of each dimension. The semantic bridge betweenc1andc2is derived from the associations found indoc1,doc2anddoc3. This setting indicates a strong association between conceptsc1andc2, which is supported by documentsdoc1,doc2anddoc3.
Table 1 Contingency table for scoring bridges
ci ¯ci
cj ni,j nj-ni,j
¯
cj ni-ni,j NCol-ni-nj
[image:8.595.56.290.661.700.2]sources covered six distinct levels of granularity, also called vertical levels, classified as molecular (e.g., geno-mic and proteogeno-mic data), cellular (e.g., results of blood tests), tissue (e.g., synovial fluid tests), organ (e.g., affected joints, heart description), individual (e.g., exami-nations, treatments), and population (e.g., epidemiologi-cal studies). To represent these levels and annotate data resources, we have selected the Unified Medical Lan-guage System Metathesaurus (UMLS) [33] as the refer-ence knowledge resource, which constitutes the main multipurpose reference thesaurus for biomedical research.
In this project, we developed a prototype, called 3D-Browser tool, which provides an interactive way to browse biomedical concepts as well as to access external information (e.g., PubMed abstracts) and HeC patient data related to these concepts. The developed prototype included the Uniprot database [34], PubMed abstracts related to the diseases studied in the project, and the HeC patient database [35]. Recently, the external web service SCAIView [36] was also integrated to provide alternative protein-disease associations mined from the literature [37].
The tool requirements were guided and evaluated by the clinicians participating in the HeC project. More-over, the 3D browser tool was fully integrated within the workflow of other HeC related tools such as the HeC Toolbar [38], allowing selected data from the 3D-Browser to be linked with real patient data. Apart from the usability tests performed within the HeC project, we are also concerned with measuring the quality of the visualized data. As our method mainly relies on an auto-matic annotation system, which can produce errors and ambiguities, we must evaluate how it affects the results shown to end-users. Next sections are devoted to show use cases within the HeC project, as well as the experi-ments carried out to measure the quality of the gener-ated data.
Prototype implementation and testing
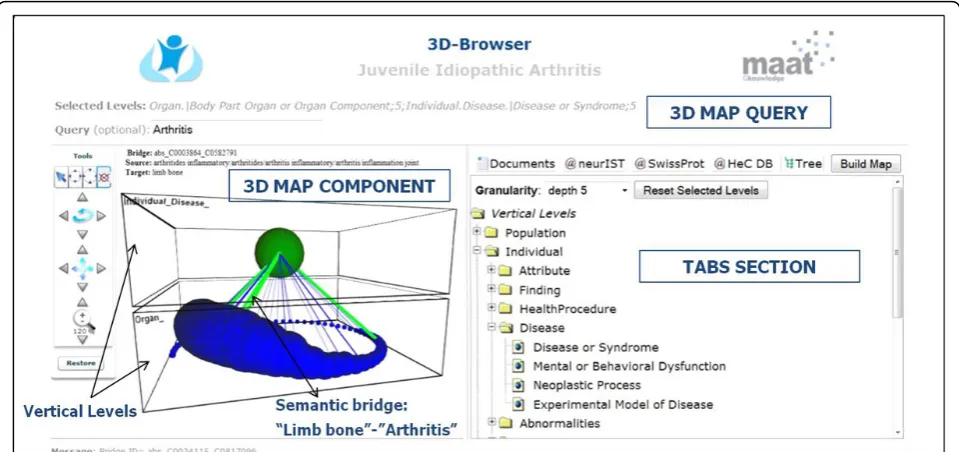
The current prototype of our method has been devel-oped using AJAX (Asynchronous JavaScript and XML) technologies. Figure 4 shows an overall view of the 3D-Browser tool [19]. It consists of three main parts, namely: 1) the configuration of the conceptual map, which contains the selected vertical levels, and an optional free text query to locate concepts of interest in the conceptual map, 2) the conceptual map itself, which contains the biomedical concepts stratified in vertical levels according to the previous configuration, and 3) a series of tabs that present ranked lists of data items associated to the selected concept from the conceptual map. In the latter, each tab represents a different data collection (e.g., PubMed, Uniprot protein database, and HeC patient data). There is a special tab entitled“Tree” which contains all the possible levels that can be selected to configure and build the conceptual map. The levels are based on the UMLS semantic types [39,40] which are grouped within the corresponding HeC verti-cal levels as in [41]. The layers of the conceptual map can be defined by selecting levels of the “Tree” tab or through a free text query. In the second case, only the most specific concepts satisfying the query are visualized in the conceptual map.
[image:9.595.56.542.101.250.2]The visual paradigm of the conceptual maps relies on the vertical integration vision proposed in HeC. That is, all the involved knowledge, data and information are organized into different disjoint vertical levels, each one representing a different perspective of the biomedical research. Figure 4 shows the stratified view of the con-ceptual map based on these vertical levels, in this case Individual.DiseaseandOrgan. Within each level, biome-dical concepts deemed relevant to both the clinician domain (e.g., rheumatology, cardiology and oncology) and the clinician information request are shown asballs in the conceptual map. The size of each ball is directly related to the concept relevance and its color indicates
Table 2 Operations over the conceptual map
Operation Back-end action Client-side action
drillDown(Di,c) Retrieve the children ofcin dimensionDi Visualization of direct sub-concepts ofcand the bridges involved by them.
contains(Di,c, kywds)
Check ifchas some sub-conceptc’mathingkywds If true, the conceptcis visualized with a different color.
drillThrough(Di, c)
Retrieve the ranking of itemsdannotated withcbyrel(d,
c) =Rd[c] Visualization in a tab (one for each indexed collection) of the rankedlist of objects with their metadata and cross-references. drillThrough(Di,
b)
Get the ranking of itemsdsupporting the selected bridgeb= (c1,c2) byrel(d,b) =rel(d,c1) ·rel(d,c2)
Visualization in a tab of the ranked list of objects with their metadata and cross-references.
conceptRemoval (Di,c)
None Removal ofcfromDiand all its bridges.
conceptSelection (Di,c)
None Removal of all other concepts and their bridges inDiexcept forc.
the operation that was performed over it, namely: green if it satisfies the free text query, red if it was expanded as a sub-concept, and blue if no action was taken on it.
Semantic bridges are represented as 3D lines in the conceptual map. Semantic bridges can represent either discovered co-occurrences of concepts in some target data collection or well-known relationships between concepts stated in some knowledge resource (e.g., UMLS relations). Semantic bridges can help clinicians to select the context in which the required information must hold. For example, from the conceptual map in Figure 4 we can retrieve documents or patient unique identifiers aboutarthritis related to limb bones by click-ing an existclick-ing bridge between the concepts Arthritis andLimb_Bone. Finally, semantic bridges have also asso-ciated a relevance index, which depends on the correla-tion measure we have chosen for their definicorrela-tion (e.g., support, mutual information, log-likelihood ratio, etc.) The relevance of each semantic bridge is indicated by both its color (from less to more relevant: blue, green and purple) and its thickness. Thus, the semantic bridge betweenArthritisand Limb_Bonecan be considered as a strong connection. Another interesting feature of the conceptual maps is the ability of browsing through the taxonomical hierarchies of the biomedical concepts (e.g., UMLS hierarchy). In the example of Figure 5, the user can expand the concepts Operationand Implantation (biggest balls in Figure 5(a)). The resulting concepts are red-colored (Figure 5(b)) and represent more specific concepts like Catheterisation, Surgical repair, Intuba-tion, orCardiovascular Operations.
In order to manage the elements of the conceptual map a series of operations are provided in the concep-tual map tools panel (see left hand-side of Figure 4). These operations are split into two categories: opera-tions to manage the whole conceptual map (rotate, zoom and shift) and concept-related operations. The operations to manage the concept visualization involve (1) the retrieval of the objects associated to the clicked concept, (2) the expansion of the clicked concept, (3) the removal of the concepts of a level with the excep-tion of the clicked concept, and (4) the removal of the clicked concept.
In the following paragraphs we show the functional-ities of the prototype through several use examples based on some HeC clinician information requests. Example 1: surgical procedures and their results in the tetralogy of Fallot domain
[image:10.595.58.538.89.315.2]Figure 5Example of two expanded concepts: operation and implantation. This example shows the two snapshots of a conceptual map: (a) before expanding concepts and (b) after expanding two main concepts.
[image:11.595.57.540.296.686.2]surgical technique with the outcome Death. Figure 6(d) shows the documents that are retrieved by clicking this bridge. Notice that these abstracts likely report death causes related to TOF repair.
Example 2: finding potential proteins for brain tumour-related diseases
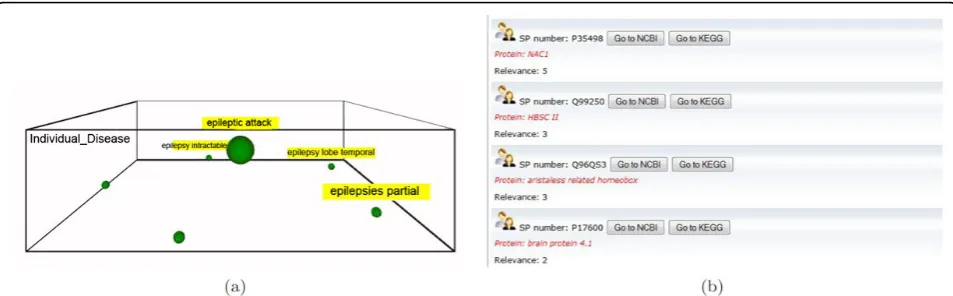
In this use case, the clinician is interested in comparing the proteins related to a disease and its subtypes. Taking the brain tumour domain, the clinician specifies the concept query epilepsy without selecting any vertical level. As a result, she obtains the conceptual map of Fig-ure 7(a) which contains the concepts attack epileptic, epilepsy intractable, epilepsy lobe temporal, epilepsy extratemporal and epilepsy focal. To retrieve the pro-teins related to these diseases, the tab@SwissProtis selected. For example in Figure 7(b) the related proteins to attack epileptic are shown. The user can then get much more information about these proteins by clicking the buttons NCBIandKEGG, which jump to the corre-sponding pages in Entrez Gene and KEGG sites respec-tively. Note that, the relevance of each protein entry is calculated with the frequency of the concept and its sub-concepts in the Uniprot description of the protein. Example 3: immunologic factors in juvenile idiopathic arthritis
Juvenile idiopathic arthritis (JIA) is an autoimmune dis-ease, that is, the immune system attacks its own cells and tissues. The cell-surface antigen HLA-B27 is well known to be associated with different kinds of JIA and it plays an important role in its classification. Moreover, male children with the HLA B27 antigen are at signifi-cantly higher risk of developing JIA. In this case, the clinician is interested in analyzing the relationships between the HLA-B27 and the different JIA subtypes, for this purpose theDisease or Syndrome and Immuno-logical factorsemantic levels are explored. As shown in the conceptual map of Figure 8, HLA-B27 plays a
central role with most of the bridges associated to JIA-related diseases.
Example 4: location of brain tumours
This example is based on the work presented in [42], which consists in retrieving patient data according to the location of the brain tumours. Figure 9(a) shows the conceptual map that relates the vertical levels Organ and Disease. Green nodes represent the relevant con-cepts which involve cerebellum. By using the node removal facility of the 3D-Browser, we can easily focus on the cerebellum related nodes (see Figure 9(b)).
Evaluation of the quality of conceptual maps
Apart from the usability tests performed within the HeC project, we are also concerned with measuring the qual-ity of the visualized data. As our method mainly relies on an automatic annotation system, which can produce errors and ambiguities, we must evaluate how it affects to the results shown to end-users. Data quality refers to the correctness of the system-generated multidimen-sional semantic spaces (MDSS) as well as the reduction achieved by the method. Wrong and ambiguous annota-tions can degrade the precision of the visualization by introducing misleading or noisy concepts in the concep-tual maps, whereas a poor reduction of the annotation sets will introduce a lot of noise in them. Additionally, we must ensure that the reduction method captures the relevant concepts, disregarding the spurious ones.
[image:12.595.59.536.554.702.2]The experiments we carried out to measure data qual-ity have been performed over three PubMed abstract collections, one per target disease of the HeC project, namely: juvenile idiopathic arthritis (JIA), tetralogy of Fallot (ToF), and pediatric astrocytomas (AC). We use as gold-standard the MeSH indexes provided by PubMed for each abstract. We can consider that MeSH-indexes constitute a multidimensional summary of each abstract, and that we can apply the usual assessment
Figure 7Example of the @Swissprot tab. This example shows the use of the @Swissprot tab. Once a conceptual map is built for the query
measures for comparing our method w.r.t. the gold-standard, namely: precision (P), recall (R) and F-score. However, before applying these measures, we need to harmonize the annotations provided by our system, which refer to UMLS, and those of the gold-standard, which refer to MeSH. As MeSH is fully included in UMLS, the harmonization just consists of aligning UMLS and MeSH concepts. We consider that a UMLS conceptcumlsis aligned to a MeSH conceptcmesh ifcmesh ≼cmesh. Notice that many concepts in UMLS will be not aligned to the gold-standard, for they are not related with the MeSH taxonomy.
[image:13.595.59.539.87.301.2] [image:13.595.63.540.520.683.2]Table 3 presents the assessment results for these three collections. We observe that the maximum recall is around 51%, which indicates that there is a notable divergence between the gold-standard and the system generated annotations for MDSS. It is worth mentioning that many MeSH annotations regard the full version of the document, and it is likely that the annotation is not mentioned in the abstract [43]. This is why F-scores are usually low. From the results of the JIA collection we can evaluate the quality of the reduction process pre-sented in the Methods Section. Notice that despite redu-cing around 55% the number of annotations, the F-score Figure 8Exploring the immunologic factors of JIA-related diseases. This figure shows two snapshots for the conceptual map that relates diseases and immunologic factors in the JIA domain: (a) the initial conceptual map, and (b) after expanding the disease concept having the strongest relation to the HLA-B27 factor.
increases in both JIA and AC collections whereas in ToF there is not statistical difference. This demonstrates that the reduction method is actually keeping the relevant part of the gold-standard annotations. Notice also from this table that the size of the annotation sets of each document is similar to those of the gold-standard.
In order to see the main differences between the gold-standard and MDSS representations, Table 4 reports the distribution of annotations across dimensions. From this table, we can also notice a notable divergence between both representations, specially for Chemical,Drug and Findingdimensions. This suggests that manual annota-tion has a great bias towards a few semantic types, which seem to be of special interest for PubMed users. In contrast, the concepts belonging toFindingare much more frequent in the abstracts than accounted by MeSH indexes.
Quality of semantic bridges refers to the interesting-ness of the bridges generated from the
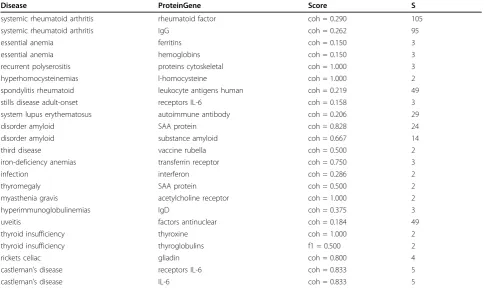
multidimensional semantic spaces. Again, we use the MeSH indexes as gold-standard, and we compare the bridges generated with the gold-standard and those generated with our method. For this purpose, we have selected a few combinations of dimensions for each disease collection, which are related to the query examples of the previous section. Thus, for the JIA collection we have selected the levels Disease and Pro-teinGene. Tables 5 and 6 show the best scored bridges for MDSS and the gold-standard. Notice that except for three bridges, both sets are completely different. The main reason for these differences stems mainly from the different nature of the underlying annotation processes. For example, the immunologic factor IgG appears in 363 documents in the MeSH representa-tion, whereas it only appears 12 times in MDSS. This is because the automatic semantic annotator finds more specific concepts involving IgG, like “IgG anti-gen”, “serum IgG”, and many others. Instead, MeSH-based annotation unifies all these concepts under
“IgG”. Additionally, as previously mentioned, some MeSH descriptors are not explicitly mentioned in the abstracts and consequently they are not regarded in the MDSS representation.
For the ToF collection, we have selected the levels Disease and HealthProcedure, restricting them to the semantic types CongenitalAbonormality and Therapy respectively. Tables 7 and 8 show the best scored bridges for the MDSS and MeSH-based representations respectively. Notice that in this case, bridges indicate relations between abnormalities and surgical methods applied to them. For the MeSH representation, bridges always refer to “surgical procedures heart”, but not to any specific technique. This is again due to the MeSH-based manual annotation of abstracts, which systemati-cally selects this concept when an abstract talks about heart surgical procedures.
Finally, for the AC collection we have selected the dimensions Anatomy, restricted to cells, and Disease restricted to neoplastic processes. Tables 9 and 10 show the generated bridges. In this case, the MDSS method obtains a much richer set of bridges than those gener-ated from the gold-standard.
[image:14.595.58.290.98.235.2]Concluding, our method generates interesting bridges comparable in quality to those generated from the gold-standard. It is worth mentioning that we have found very few errors due to the semantic annotation system. An example of error is shown in Table 5, where ACLS is not a disease. Finally, due to the significant divergence present in the MDSS and the gold-standard representa-tions, bridges derived from them can vary greatly. Future work must pay attention to the impact of the used annotation method in both the resulting multidi-mensional space and its generated bridges.
Table 3 Method evaluation
Domain Docs MeSH MDSS P R F LMeSH Lmdss
JIA (all annot.) 7637 5096 16835 0.308 0.518 0.386 10.96 30.44 JIA
(reduction)
9719 0.406 0.383 0.394 11.28
ToF (all annot.)
7669 3482 13942 0.281 0.421 0.337 10.96 26.92
ToF (reduction)
7928 0.356 0.314 0.334 9.77
AC (all annot.)
3663 3116 11898 0.221 0.477 0.301 15.37 44.8
AC (reduction)
6573 0.339 0.302 0.320 15.37 13.93
[image:14.595.56.292.555.705.2]Method Evaluation. MeSH and MDSS are the number of concepts in the gold-standard and the system-generated multidimensional spaces for the three domains: JIA, ToF and AC.P,RandFrepresent the precision, recall and F-score respectively.LMeSHandLMDSSare the average number of concepts associated to each item in the gold-standard and the MDSS respectively.
Table 4 Distribution of semantic annotations
Dimension JIA ToF AC
MeSH MDSS MeSH MDSS MeSH MDSS
Physiology 2.0 3.9 1.9 2.3 2.8 4.7 ProteinGene 17.8 11.0 12.1 5.2 24.0 11.0 Anatomy 10.8 10.8 14.0 13.4 12.9 13.9
Drug 9.2 2.6 9.0 1.7 8.4 1.8
Chemical 24.2 7.3 18.7 5.2 24.4 6.6 Disease 23.0 15.3 25.0 19.7 22.5 17.0 HealthProcedure 13.8 19.0 17.2 20.5 13.6 16.6 Concepts 4.8 4.1 4.8 4.5 4.8 4.7 Finding 2.9 15.7 3.7 18.6 3.2 14.3
Population 6.2 6.9 6.1 6.2 4.9 6.7
Table 5 MDSS-based bridges for JIA domain
Disease ProteinGene Score S
anemias erythropoietin coh = 0.500 2
psoriasis TNF human coh = 0.333 2
psoriasis fusion protein conf = 0.333 3
periodic syndrome TNF receptors coh = 1.000 2
systemic onset JIA receptors IL-6 coh = 0.114 8
rickets celiac gluten coh = 0.500 2
tuberculous infections TNF blockers infliximab conf = 0.222 2
ACLS (*) lupus coagulation inhibitor f1 = 0.500 2
third disease vaccine rubella conf = 1.000 3
diseases autoimmune tyrosine phosphatases protein coh = 0.500 2
syndrome laron insulinlike growth factor conf = 1.000 2
disorder amyloid substance amyloid f1 = 0.141 5
osteoarthrosis oa proteoglycans f1 = 0.188 3
growth failure insulinlike growth factor conf = 0.667 2
thyromegaly substance amyloid conf = 0.600 3
syndrome macrophage activation perforin coh = 0.571 4
syndrome macrophage activation cyclosporine medication f1 = 0.311 14
uveitis factors antinuclear conf = 0.171 19
systemic JIA IL-1 receptor antagonist protein conf = 0.133 2
syndrome hemophagocytic perforin coh = 0.286 2
eye disease cataract factors antinuclear conf = 0.250 15
myasthenia gravis acetylcholine receptor coh = 1.000 2
Bestδ-maximum scored bridges between theDiseaseandProteinGenelevels for the the JIA domain, using our reduction method (MDSS). Interestingness measures used are: cohesion (coh), confidence (conf) and f-measure (f1). The columnSindicates the number of documents supporting each bridge.
Table 6 MeSH-based bridges for the JIA domain
Disease ProteinGene Score S
systemic rheumatoid arthritis rheumatoid factor coh = 0.290 105
systemic rheumatoid arthritis IgG coh = 0.262 95
essential anemia ferritins coh = 0.150 3
essential anemia hemoglobins coh = 0.150 3
recurrent polyserositis proteins cytoskeletal coh = 1.000 3
hyperhomocysteinemias l-homocysteine coh = 1.000 2
spondylitis rheumatoid leukocyte antigens human coh = 0.219 49
stills disease adult-onset receptors IL-6 coh = 0.158 3
system lupus erythematosus autoimmune antibody coh = 0.206 29
disorder amyloid SAA protein coh = 0.828 24
disorder amyloid substance amyloid coh = 0.667 14
third disease vaccine rubella coh = 0.500 2
iron-deficiency anemias transferrin receptor coh = 0.750 3
infection interferon coh = 0.286 2
thyromegaly SAA protein coh = 0.500 2
myasthenia gravis acetylcholine receptor coh = 1.000 2
hyperimmunoglobulinemias IgD coh = 0.375 3
uveitis factors antinuclear coh = 0.184 49
thyroid insufficiency thyroxine coh = 1.000 2
thyroid insufficiency thyroglobulins f1 = 0.500 2
rickets celiac gliadin coh = 0.800 4
castleman’s disease receptors IL-6 coh = 0.833 5
castleman’s disease IL-6 coh = 0.833 5
[image:15.595.56.541.436.724.2]Conclusions
Current knowledge resources and semantic-aware tech-nology make possible the integration of biomedical resources. Such an integration is achieved through semantic annotation of the intended biomedical resources. This paper shows how these annotations can
be exploited for integration, exploration, and analysis tasks.
[image:16.595.58.541.99.283.2]The presented approach relies on multidimensional semantic spaces and OLAP-style operators, which has been shown suitable for browsing biomedical informa-tion. We also show that the same knowledge resources
Table 7 MDSS-based bridges for the ToF domain
Disease.CongenitalAbnormality HealthProcedure.Therapy Score S
stricture pulmonary artery congenital procedure fontan coh = 0.250 2 stricture pulmonary artery congenital stent s biliary coh = 0.250 3 right ventricular dilatation replacement pulmonary valve conf = 0.231 3 major aortopulmonary collateral artery therapy embolization coh = 0.200 3
tetralogy fallots surgical repairs coh = 0.611 251
tetralogy fallots surgical treatment coh = 0.517 733
congenital pulmonary artery aneurysm pericardial shunt operation conf = 0.154 2 congenital pulmonary artery aneurysm arteriovenous shunt procedure coh = 0.154 2 single coronary artery anomalous coronary artery graft treatment coh = 0.167 3
syndrome alagille transplant liver coh = 1.000 2
peripheral pulmonary artery stenosis stent s biliary coh = 0.333 2
cross syndrome reperfusions coh = 0.400 2
infantile lobar emphysema lobectomy coh = 0.500 2
ventricular septal defect spontaneous closure surgical closure coh = 0.125 5
[image:16.595.57.538.430.506.2]Bestδ-maximum scored bridges between theCongenitalAbnormalityandTherapylevels for the the ToF domain, using our reduction method (MDSS). Interestingness measures used are: cohesion (coh), confidence (conf) and f-measure (f1). The columnSindicates the number of documents supporting each bridge.
Table 8 MeSH-based bridges for the ToF domain
Disease.CongenitalAbnormality HealthProcedure.Therapy Score S
tetralogy fallots surgical procedures heart coh = 0.837 498
vessels transposition great surgical procedures heart coh = 0.106 63 malformation heart surgical procedures heart coh = 0.329 196 vsd ventricular septal defect surgical procedures heart coh = 0.200 119 septal defects atrial surgical procedures heart coh = 0.108 61
Bestδ-maximum scored bridges between theCongenitalAbnormalityandTherapylevels for the the ToF domain, using the gold-standard (MeSH). Interestingness measures used are: cohesion (coh), confidence (conf) and f-measure (f1). The columnSindicates the number of documents supporting each bridge.
Table 9 MDSS-basedδ-maximum scored bridges for the AC domain
Anatomy.Cell Disease.NeoplasticProcess Score S
tumor cell pleomorphic xanthoastrocytoma coh = 0.125 7
human cell line small-cell glioblastoma coh = 1.000 2
tumour cells g-cell tumor coh = 0.333 2
oligodendroglial cell oligodendrogliomas conf = 0.190 4
neurons dysplasias coh = 1.000 2
multinucleate giant cell glioblastomas giant cell coh = 1.000 2 multinucleate giant cell subependymal giant cell astrocytoma coh = 0.130 3 multinucleate giant cell tuberous sclerosis syndrome conf = 0.217 5 multinucleate giant cell pleomorphic xanthoastrocytoma conf = 0.174 4 spindle cell subependymal giant cell astrocytoma coh = 0.400 2
tumour cell lines solid tumour childhood coh = 0.667 2
[image:16.595.58.540.565.713.2]that support the semantic annotations (i.e., thesauri and domain ontologies) provide the necessary elements to build the taxonomical dimensions that facilitate the exploration of the semantic spaces. The viability of the approach is finally demonstrated with the developed prototype (3D-Browser), which has been tested over a real scenario.
As for the quality of the generated semantic spaces, we show that the conceptual representations of our approach are partially complementary to the representa-tion given by MeSH descriptors. The normalizarepresenta-tion pro-cess defined to accommodate the semantic annotations into the given dimensions does not suffer from quality loss. The quality of discovered bridges is usually similar or, in some cases, better than those derived from the MeSH descriptors.
As future work, it would be interesting to investigate probabilistic translation methods [44] for different con-ceptual representations, so that the quality of the semantic annotations can be further improved. For example, with these methods, some hidden concepts in the abstract that are captured by MeSH descriptions could be discovered by other annotation systems. Other future work will be focused on the discovery of interest-ing bridges usinterest-ing association rules algorithms. Recently, we have investigated in [45] the generation of rules from semantic annotations derived from patient record databases. These rules could be included in the pro-posed conceptual maps for exploring them as well as for comparing them to existing bridges. Finally, we will investigate how to include in our approach those semantic relationships that are being extracted from the literature, as those obtained with the DIDO tool [46].
List of abbreviations
AC: Astrocytoma; AJAX: Asynchronous JavaScript and XML; CALBC: Collaborative Annotation of a Large Biomedical Corpus; CR: Concept Retrieval; DR: Data resources; GO: Gene Ontology; HeC: Health-e-Child; JIA: Juvenile Idiopathic Arthritis; KEGG: Kyoto Encyclopedia of Genes and Genomes; KR: Knowledge Resources; LBD: Literature Based Discovery; MDSS: Multidimensional Semantic Spaces; MeSH: Medical Subject Headings; NCBI: National Center for Biotechnology Information; OLAP: OnLine Analytical Processing; OMIM: On-line Mendelian Inheritance in Man; OWL: Ontology
Web Language; RDF: Resource Description Framework; TOF: Tetralogy of Fallot; UMLS: Unified Medical Language System; XML: eXtended Mark-up Language.
Acknowledgements
This work has been partially funded by the EU project Health-e-Child (IST 2004-027749) and the Spanish National Research Program (contract number TIN2008-01825/TIN). We would like to thank Alfonso Rios and David Manset (MAAT-G France) for their fruitful discussions within the HeC project about the browser and its implementation.
This article has been published as part ofBMC BioinformaticsVolume 13 Supplement 1, 2012: Semantic Web Applications and Tools for Life Sciences (SWAT4LS) 2010. The full contents of the supplement are available online at http://www.biomedcentral.com/bmcbioinformatics/supplements/13/S1.
Author details
1Departamento de Lenguajes y Sistemas Informáticos, Universitat Jaume I, Campus Riu Sec s/n, E-12071 Castellón, Spain.2Department of Computer Science, University of Oxford, Wolfson Building, Parks Road, Oxford OX1 3QD, UK.
Authors’contributions
RB designed the 3D-Browser and carried out its implementation (client-side) as well as the normalization methods. EJR developed the HeC use cases and designed the experiments related to them. VN implemented and adapted the ontology indexing scheme over which most of the browser operations are performed in the back-end. All authors drafted, read and approved the final manuscript.
Competing interests
The authors declare that they have no competing interests.
Published: 25 January 2012
References
1. Mesiti M, Jiménez-Ruiz E, Sanz I, Llavori RB, Perlasca P, Valentini G, Manset D:XML-based approaches for the integration of heterogeneous bio-molecular data.BMC Bioinformatics2009,10(S-12):7.
2. Durinck S, Moreau Y, Kasprzyk A, Davis S, De Moor B, Brazma A, Huber W:
BioMart and Bioconductor: a powerful link between biological databases and microarray data analysis.Bioinformatics2005,21(16):3439-40[http:// www.ncbi.nlm.nih.gov/pubmed/16082012].
3. Keseler IM, Collado-Vides J, Santos-Zavaleta A, Peralta-Gil M, Gama-Castro S, Muñiz-Rascado L, Bonavides-Martínez C, Paley SM, Krummenacker M, Altman T, Kaipa P, Spaulding A, Pacheco J, Latendresse M, Fulcher CA, Sarker M, Shearer AG, Mackie A, Paulsen IT, Gunsalus RP, Karp PD:EcoCyc: a comprehensive database of Escherichia coli biology.Nucleic Acids Research2011, ,39 Database:583-590[http://www.ncbi.nlm.nih.gov/pmc/ articles/PMC3013716/].
4. Köhler J, Baumbach J, Taubert J, Specht M, Skusa A, Rüegg A, Rawlings C, Verrier P, Philippi S:Graph-based analysis and visualization of experimental results with ONDEX.Bioinformatics2006,22(11):1383-1390 [http://dx.doi.org/10.1093/bioinformatics/btl081].
5. Bizer C:The Emerging Web of Linked Data.IEEE Intelligent Systems2009,
24(5):87-92.
6. Belleau F, Nolin M, Tourigny N, Rigault P, Morissette J:Bio2RDF: towards a mashup to build bioinformatics knowledge systems.Journal of Biomedical Informatics2008,41(5):706-716.
7. Demir E,et al:The BioPAX community standard for pathway data sharing.Nature Biotechnology2010,28:935-942.
8. Swanson DR:Medical literature as a potential source of new knowledge.
Bulletin of the Medical Library Association1990,78:29-37[http://view.ncbi.nlm. nih.gov/pubmed/2403828].
9. Spasic I, Ananiadou S, Mcnaught J:Text mining and ontologies in biomedicine: making sense of raw text.Briefings in Bioinformatics2005,
6:239-251.
10. Jimeno-Yepes A, Berlanga-Llavori R, Rebholz-Schuhmann D:Exploitation of ontological resources for scientific literature analysis: searching genes and related diseases.IEEE Engineering in Medicine and Biology Society2009,
[image:17.595.58.290.112.174.2]1:7073-7078[http://www.ncbi.nlm.nih.gov/pubmed/19964204].
Table 10 MeSH-basedδ-maximum scored bridges for the
AC domain
Anatomy.Cell Disease.NeoplasticProcess Score S
neurons gangliogliomas coh = 0.160 4 cultured cells melanoma syndrome coh = 0.158 3 t-lymphocytes malignant adenomas coh = 0.286 2 tumour cell lines neoplasms experimental coh = 0.500 2
11. Andronis C, Sharma A, Virvilis V, Deftereos S, Persidis A:Literature mining, ontologies and information visualization for drug repurposing.Briefings in Bioinformatics2011,12(4):357-368.
12. Shannon P, Markiel A, Ozier O, Baliga NS, Wang JT, Ramage D, Amin N, Schwikowski B, Ideker T:Cytoscape: a software environment for integrated models of biomolecular interaction networks.Genome research2003,13(11):2498-2504.
13. Bichindaritz I, Akkineni S:Concept mining for indexing medical literature.
Engineering Applications of Artificial Intelligence2006,19(4):411-417[http:// www.sciencedirect.com/science/article/pii/S0952197606000443]. 14. Pratt W, Yetisgen-Yildiz M:LitLinker: capturing connections across the
biomedical literature.Proceedings of the 2nd International Conference on Knowledge CaptureK-CAP‘03, Sanibel Island, FL, USA: ACM; 2003, 105-112 [http://doi.acm.org/10.1145/945645.945662].
15. Rebholz-Schuhmann D, Kirsch H, Arregui M, Gaudan S, Riethoven M, Stoehr P:EBIMed - text crunching to gather facts for proteins from Medline.Bioinformatics2007,23(2):237-244.
16. Kim JJ, Pezik P, Rebholz-Schuhmann D:MedEvi: retrieving textual evidence of relations between biomedical concepts from Medline.
Bioinformatics2008,24(11):1410-1412.
17. Tsuruoka Y, Tsujii J, Ananiadou S:FACTA: a text search engine for finding associated biomedical concepts.Bioinformatics2008,24(21):2559-2560 [http://bioinformatics.oxfordjournals.org/content/24/21/2559.abstract]. 18. Chaudhuri S, Dayal U:An overview of data warehousing and OLAP
technology.SIGMOD Record1997,26:65-74.
19. Berlanga R, Jimenez-Ruiz E, Nebot V:3D-Browser technical reports and tool.2010 [http://krono.act.uji.es/Projects/hec-3dbrowser].
20. Codd EF, Codd SB, Salley CT:Providing OLAP (On-Line Analytical Processing) to User-Analysts: an IT Mandate.E. F. Codd and Associates 1993.
21. McKusick VA:Mendelian Inheritance in Man and Its Online Version, OMIM.The American Journal of Human Genetics2007,80(4):588-604. 22. Rebholz-Schuhmann D, Arregui M, Gaudan S, Kirsch H, Jimeno-Yepes A:
Text processing through Web services: calling Whatizit.Bioinformatics 2008,24(2):296-298.
23. Aronson A:Effective mapping of Biomedical text to the UMLS Metathesaurus: the MetaMap program.Proc. of AMIA Symposium Whasington, DC, USA; 2001, 17-21[http://www.ncbi.nlm.nih.gov/pubmed/ 11825149].
24. Berlanga R, Nebot V, Jimenez-Ruiz E:Semantic annotation of biomedical texts through concept retrieval.Procesamiento del Lenguaje Natural2010,
45:247-250[http://sinai.ujaen.es/sepln/ojs/ojs-2.3.5/index.php/pln/article/ view/810/664].
25. CALBC challenge.[http://www.ebi.ac.uk/Rebholz-srv/CALBC/]. 26. Rebholz-Schuhmann D,et al:Assessment of NER solutions against the
first and second CALBC Silver Standard Corpus.Journal of Biomedical Semantics (In Press)2011 [http://www.jbiomedsem.com/content/2/S5/S11/ abstract].
27. Rebholz-Schuhmann D, Jimeno-Yepes A, van Mulligen EM, Kang N, Kors JA, Milward D, Corbett P, Buyko E, Beisswanger E, Hahn U:CALBC Silver Standard Corpus.Journal of Bioinformatics and Computational Biology2010,
8:163-179.
28. Nebot V, Berlanga R:Efficient retrieval of ontology fragments using an interval labeling scheme.Inf Sci2009,179(24):4151-4173.
29. Zhou D, Schölkopf B, Hofmann T:Semi-supervised learning on directed graphs.Advances in Neural Information Processing Systems (NIPS)2004,
17:1-8.
30. Tan PN, Kumar V, Srivastava J:Selecting the right interestingness measure for association patterns.Proc. of the 8th ACM SIGKDD International Conference on Knowledge Discovery and Data MiningEdmonton, Alberta, Canada: ACM; 2002, 32-41.
31. Skaburskas K, Estrella F, Shade J, Manset D, Revillard J, Rios A, Anjum A, Branson A, Bloodsworth P, Hauer T, McClatchey R, Rogulin D: Health-e-Child: a grid platform for european paediatrics.Journal of Physics: Conference Series2008,119(8):082011[http://stacks.iop.org/1742-6596/119/ i=8/a=082011].
32. Jimenez-Ruiz E, Berlanga R, Sanz I, McClatchey R, Danger R, Manset D, Paraire J, Rios A:The management and integration of biomedical knowledge: application in the Health-e-Child Project (Position Paper).In In On the Move to Meaningful Internet Systems 2006: OTM 2006 Workshops, Volume 4278 of Lecture Notes in Computer Science.Springer Berlin/
Heidelberg;Meersman R, Tari Z, Herrero P 2006:1062-1067[http://dx.doi.org/ 10.1007/11915072_8].
33. Bodenreider O:The Unified Medical Language System (UMLS): integrating biomedical terminology.Nucleic acids research 2004,32 Database[http://www.ncbi.nlm.nih.gov/pmc/articles/PMC308795/].
34. Uniprot database.[ftp://ftp.ebi.ac.uk/pub/databases/uniprot/ knowledgebase/].
35. Berlanga R, Jiménez-Ruiz E, Rogulin D, Nebot V, Manset D, Branson A, Hauer T, McClatchey R, Rogulin D, Shamdasani J,et al:Medical Data Integration and the Semantic Annotation of Medical Protocols.Proc. of the 21th IEEE International Symposium on Computer-Based Medical Systems (CBMS)University of Jyväskylä, Finland; 2008, 644-649.
36. SCAIView.[http://www.scai.fraunhofer.de/en/business-research-areas/ bioinformatics/products/scaiview.html].
37. Friedrich CM, Ebeling C, Manset D:Cross-project uptake of biomedical text mining results for candidate gene searches.ERCIM News2010,
82:45-46.
38. Branson A, Hauer T, McClatchey R, Rogulin D, Shamdasani J:A data model for integrating heterogeneous medical data in the Health-e-Child Project.Proceedings of Health-Grid, Volume 138 ofStudies in Health Technology and Informatics, Chicago, USA; 2008, 13-23.
39. McCray A:UMLS Semantic Network.Proc. of the 13th Annual Symposium on Computer Applications in Medical CareWashington, DC, USA: IEEE Computer Society Press; 1989, 503-507.
40. Bodenreider O, McCray AT:Exploring semantic groups through visual approaches.Journal of Biomedical Informatics2003,36(6):414-432. 41. Jimeno-Yepes A, Jimenez-Ruiz E, Lee V, Gaudan S, Berlanga R,
Rebholz-Schuhmann D:Assessment of disease named entity recognition on a corpus of annotated sentences.BMC Bioinformatics2008,9(Suppl 3):S3 [http://www.biomedcentral.com/1471-2105/9/S3/S3].
42. Hauer T, Rogulin D, Zillner S, Branson A, Shamdasani J, Tsymbal A, Huber M, Solomonides T, McClatchey R:An architecture for semantic navigation and reasoning with patient data - experiences of the Health-e-Child Project.Proc. of the 7th International Semantic Web Conference, ISWC 2008, Volume 5318 of Lecture Notes in Computer ScienceSpringer; 2008, 737-750. 43. Kostoff RN, Block JA, Stump JA, Pfeil KM:Information content in Medline
record fields.International Journal of Medical Informatics2004,
73(6):515-527.
44. Berger A, Lafferty J:Information retrieval as statistical translation.Proc. of the 22nd International Conference on Research and Development in Information Retrieval, SIGIR’99University of California, Berkeley, USA: ACM; 1999, 222-229.
45. Nebot V, Berlanga R:Finding association rules in Semantic Web Data.
Knowledge-Based Systems2012,25:51-62.
46. Nebot V, Ye M, Albrecht M, Eom JH, Weikum G:DIDO: a disease-determinants ontology from web sources.Proceedings of the 20th international conference companion on World wide web, www‘11 Hyderabad, India: ACM; 2011, 237-240.
doi:10.1186/1471-2105-13-S1-S6
Cite this article as:Berlangaet al.:Exploring and linking biomedical resources through multidimensional semantic spaces.BMC Bioinformatics
201213(Suppl 1):S6.
Submit your next manuscript to BioMed Central and take full advantage of:
• Convenient online submission
• Thorough peer review
• No space constraints or color figure charges
• Immediate publication on acceptance
• Inclusion in PubMed, CAS, Scopus and Google Scholar
• Research which is freely available for redistribution