City, University of London Institutional Repository
Citation
:
Siaudinyte, L. and Grattan, K. T. V. (2016). Uncertainty evaluation of
trigonometric method for vertical angle calibration of the total station instrument.
Measurement, 86, pp. 276-282. doi: 10.1016/j.measurement.2015.10.037
This is the accepted version of the paper.
This version of the publication may differ from the final published
version.
Permanent repository link:
http://openaccess.city.ac.uk/15810/
Link to published version
:
http://dx.doi.org/10.1016/j.measurement.2015.10.037
Copyright and reuse:
City Research Online aims to make research
outputs of City, University of London available to a wider audience.
Copyright and Moral Rights remain with the author(s) and/or copyright
holders. URLs from City Research Online may be freely distributed and
linked to.
City Research Online:
http://openaccess.city.ac.uk/
publications@city.ac.uk
Uncertainty evaluation of trigonometric method for vertical
angle calibration of the total station instrument
Lauryna Šiaudinyte˙
a,⇑, Kenneth Thomas Victor Grattan
a,b aVilnius Gediminas Technical University, Sauletekio al. 11, LT-10223 Vilnius, Lithuania b
City Graduate School, City University London, Northampton Square, London EC1V0HB, United Kingdom
Keywords:
Angle calibration Measurement Total station Vertical angle
a b s t r a c t
The total station is an instrument, widely used in civil and environmental engineering, for flat and vertical angle as well as distance measurements. Typically, routine calibration of such an instrument is obligatory, and depending on the local regulations, is performed typ-ically annually or bi-annually. Analysis of previous research shows that undertaking flat angle calibration under laboratory conditions is more common than calibration of vertical angle measuring systems. This paper deals with a trigonometric vertical angle calibration method and research into determining the main sources of uncertainty is described in the paper. The principle of the method is explained, as well as the uncertainty evaluation based on GUM and the advantages as well as the weaknesses of the setup are discussed.
1. Introduction
Rotary encoders, total stations, laser trackers and other optical-electronic digital instruments are widely used in the fields of robotics, surveying, machine and civil engi-neering. Circular scales and angular transducers for angle determination in horizontal and vertical planes are com-monly the critical components of these optical-electronic geodetic measuring instruments. The accuracy of such instruments depends then directly on the accuracy of the embedded angle measuring systems employed. Measure-ments using such equipment are specific and require particular arrangements for instrument calibration and especially for measurements in the vertical plane.
The main instruments used in geodetic measurements are total stations, often called tacheometers. Tacheometry (gr. tacheos – fast, metreo – measure) is the geodetic measurement method for the determination of the Earth’s surface point position in three coordinates (x,y,z). During
the measurement, readings of both horizontal and vertical angles are recorded to develop a relationship between the points. Total stations (TS) are very useful in survey and civil engineering applications for the angle, distance as well as height difference measurements.
In essence, a total station consists of a theodolite and an electronic distance measurement device (EDM)[2]. Typi-cally, there are two angle measuring systems for both hor-izontal and vertical angle measurements embedded in a total station. The rotary encoder is the most important component of such angle measuring systems and rotating the telescope of the TS around the vertical axis allows the measurement of the horizontal angle, while rotating it around the horizontal axis measures vertical angle
[10,14]. An automatic compensation system for the
Angles are recorded digitally and the data may be pre-viewed on the screen using image processing (if the total station has an image capture function, the images can be seen on the screen) and pattern recognition methods (when labels are assign to each measured point).
As previous research shows, most of the methods in angle metrology deal with the flat angle calibration [1]. However, calibration of vertical angle measuring systems under the laboratory conditions requires the use of special arrangements.
An implementation of the method as well as an impor-tant technique used for vertical angle measuring system calibration under laboratory conditions is analyzed in some detail in this paper.
2. Related research
Although total stations are designed to perform mea-surements under field conditions, assessments of both hor-izontal and vertical angle measuring systems are often performed under the laboratory conditions as a means of calibration.
The Theodolite Test Machine (TPM-2: Theodolit-Prufmaschine 2) developed by Leica Geosystems AG is intended for horizontal and vertical angle calibration of theodolites and total stations. During calibration, the read-ings of the total station under test are compared to the out-puts of vertical and horizontal reference encoders embedded into TPM-2 machine. Standard deviations of 0.05800for the horizontal angles and 0.09100for the vertical
angles can be achieved using this machine[8]. This machine is considered to be an industry standard and is appreciated for its accuracy, although are frequently not available to smaller laboratories due to the high costs involved.
A further setup for vertical angle calibration of total sta-tions has been proposed by colleagues at KRISS (Korea Research Institute of Standards and Science)[12]. A special piece of apparatus with a tribrach and total station support is mounted on Moore’s Special index. The Moore 1440 Pre-cision Index is a serrated-tooth circle divider. During oper-ation, the table is displaced axially to disengage the teeth and radially to the desired angle. The expanded uncer-tainty of this instrument is U95%= 0.100 (k= 2) at any of
the 1440 indexed positions. It is often used in laboratories as a flat angle standard. The total station is fixed to the apparatus in a horizontal position. The mirror is attached to the telescope of a total station, to which an autocollima-tor is pointed. In this way the setup for flat angle calibra-tion was used to calibrate the vertical angles, with the expanded uncertainty ofU95%= 0.5200(k= 2)[12,13].
The trigonometric method for vertical angle calibration was developed, along with the new vertical circle com-parator at ESRF, France. For the calibration of the robotic total station, the distance between the vertical circle com-parator and the total station can be minimized to 2.5 m which limits vertical angle measurement range to ±23.75°. The vertical angle is measured with respect to the reflector sliding along the vertical circle comparator in the vertical plane. The expanded uncertainty of vertical
angle measuring system calibration using this vertical cir-cle comparator is given asU= 1.6500(k= 2)[9].
The method proposed in[11]is based on the trigono-metric approach of vertical angle determination, achieved by measuring two distances and this can be expressed as follows:
cosðhÞ ¼
Dd
ffiffiffiffiffiffiffiffiffiffiffiffi y0 y11 q
d0
ð1Þ
where Dd – the object displacement distance, d0 – the
effective distance to the measured object before the dis-placementy0andy1are the scale readings before and after
the displacement andh– vertical angle[11].
3. Trigonometric vertical angle calibration method
3.1. The principle and instrumentation
In trigonometric methods, an angle is expressed as a function of distance. The method for calibration of vertical angle measuring systems of geodetic instruments was developed at Institute of Geodesy of Vilnius Gediminas Technical University. This method proposes an arrange-ment to create the reference angle suitable for vertical angle calibration purposes in the laboratory environment
[3,4].
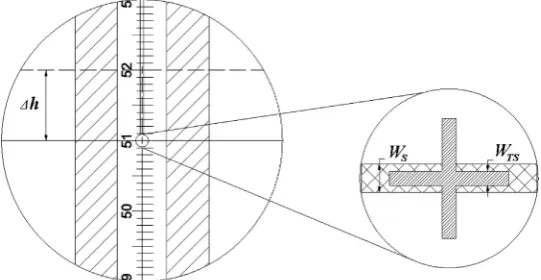
Proposed method is suitable for relatively small angle measurements and is based on trigonometric determina-tion of the reference angle using standard means, such as a laser interferometer and a calibrated graduated 1 meter reference scale. Proposed method is based on a comparison of the angle measured by the total station and the refer-ence angle determined by measuring two distances – the horizontal (the distance between the TS vertical axis and the vertically positioned scale) and the vertical (the dis-tance between the grating lines of the vertically positioned reference linear scale). The principle of the method is shown inFig. 1.
The reference angle based on measuring the horizontal and the vertical distances can be expressed as:
u
¼arctanD
hl ð2Þ
whereDh– the vertical distance determined between the scale grating; andl– the horizontal distance between the axis of the TS and the reference scale.
Using this method, the reference 1 m graduated scale bar was placed vertically using its original mount for sta-bility and leveling on the carriage. The graduated scale must be perpendicular to the optical axis of the total sta-tion at initial posista-tion and therefore, it was in this way pre-cisely leveled and aligned.
This method has two different approaches – with dis-placed reference scale and with stationary reference scale, as discussed below.
First, in the approach with the displaced reference scale, the reference angle (u0) is determined according to the
u
0¼arctanD
h0Dl
0
ð3Þ
whereDh0 – the known, calibrated distance between the grating of the scale; andDl0 – the distance measured by
the laser interferometer between two scale positions. After pointing TS to the line of the reference scale, the scale is displaced until another line matches the reticle central line of the TS. In this approach, the scale displacement distance (Dl0) is measured by an interferometer and the vertical
dis-tance (Dh0) is determined from the reference scale. In the alternative approach with the stationary refer-ence scale, the precision reflector was mounted on the scale for determination of horizontal distance between the TS and the reference scale. Since it was not possible to measure directly to the grating surface, the prism con-stant and the scale depth were taken into consideration and measured separately.
The realization of proposed method was performed at the Korea Research Institute of Standards and Science (KRISS). In collaboration with the Division of Physical Metrology at KRISS, the instrumentation for this experi-ment was selected to perform measureexperi-ments at the Center for Length Laboratory for distance measurements.
The Total Station Leica TC 2003, having a focusing range of 1.6 m was used as the instrument under calibration. For the experiment the calibrated reference 1 m H shape invar scale (Gaertner Scientific Corporation Chicago. No. 244 A. U) with a 1 mm grating pitch was chosen with its original mount used for leveling. After leveling the total station, the position of the scale was double-checked and readjusted in order to make the scale grating lines parallel to the hori-zontal line of the total station reticle.
For the horizontal displacement measurements that were made, a Hewlett Packard Laser System 5519 A with helium neon laser was chosen because it is used as a length standard at KRISS. The system involves a Zeeman-split two-frequency laser output. With the beam diameter of 6 mm, this interferometer can perform 80 m length range distance measurements. The alignment of the devices was adjusted by using a cross-line laser level, which pro-duces beams in two perpendicular planes. In the approach
to the stationary reference scale, a Mitutoyo micrometer was used to measure the scale depth, to the surface of the grating.
3.2. Uncertainty evaluation
In order to create the uncertainty evaluation required, it is very important to analyze all the key components influ-encing measurement accuracy. Error sources are analyzed and the measurement accuracy was calculated and reported in the form of combined and expanded uncertain-ties as it is required in GUM (Guide to the expression of uncertainty in measurement). During the uncertainty eval-uation both type A and type B evaleval-uation methods were used to obtain the results by applying statistical analysis of series of observations as well as other means (i.e. cali-bration certificates) for the evaluation[6].
Therefore, the correction value (B) can be expressed as follows:
B¼arctan
Dh
0D
l0
hTS ð4Þ
wherehTS– the angle measured by the total station,Dh0–
the known calibrated distance between the grating of the scale; andDl0 – the distance measured by the laser
inter-ferometer between two scale positions.
The combined uncertainty of the correction value may be expressed as follows:
u2
cðBÞ ¼c
2
Dh0u
2ð
Dh
0Þ þc2Dl0u
2ð
Dl
0Þ þc2 hTSu2ðh
TSÞ ð5Þ
wherec– the different sensitivity coefficients above;u– the standard uncertainties arising from the vertical dis-tance (Dh0), the horizontal distance (Dl0) and the angle measured with the TS (hTS). The uncertainty due to vertical
distance is dependent on the accuracy, tilt, thermal expan-sion and compresexpan-sion of the reference scale and thus may be expressed as:
u2
Dh0¼c
2
Dh0
u2ð
D
h0ScalÞ þu2ð
D
h 0tiltÞ þu2ð
D
h 0 thermÞþþu2ð
D
h0compÞ þu2ð
D
h 0 pointÞ( )
[image:4.544.138.412.54.227.2]ð6Þ
whereu2(Dh0
Scal) – the standard uncertainty due to the
ref-erence scale;u2(Dh0tilt) – the standard uncertainty due to
the tilt of the scale;u2(Dh0
therm) – the standard uncertainty
due to thermal expansion; u2(Dh0
comp) – the standard
uncertainty due to compression of the scale; and u2
-(Dh0
point) – the standard uncertainty due to pointing to
the center of the scale line. The uncertainty due to the pointing of the instrument must be evaluated with refer-ence to the different widths of the cross line of the tele-scope and the reference scale.
The uncertainty due to thermal expansion can be eval-uated with reference to the thermal expansion coefficient. The uncertainty due to the thermal expansion of the scaleu
(Dh0
therm) can be determined for every measured pitch and
for the total measured length of the scale (Dhtherm) as a
result of linear thermal expansion:
D
htherm¼a
D
Th ð7Þwhere
a
– the thermal expansion coefficient of invar (a
= 1106);DT– the temperature deviation from 20°C (DT= 0.5°C);h– the initial length of the scale at tempera-ture of 20°C (h= 1.0 m). Therefore,u(Dh0
therm)–the
uncer-tainty due to the thermal expansion of the scale was determined asDh0
therm=0.5
l
m/m over the 1 meter lengthof the scale.
The reference scale is 1 m long and is used in the verti-cal orientation and therefore, the correction for the com-pression due to the effect of gravity has to be evaluated
[7]. The expression for the correction due to the compres-sion in this case can be assumed to be the uncertainty due to compression of the scale, arising from the standard uncertainties of the expression shown in Eq. (8)as the specific components are unknown. Therefore, the uncer-tainty due to compression of the scale can be evaluated, as follows(8):
uð
D
hcompÞ ¼500q
g E ðLÞ
2 ð
8Þ
where
q
– the density of the gauge block material; E– Young’s modulus of elasticity of the gauge block material;g– the acceleration of gravity; and L– the length of the gauge block. The uncertainty due to the compression of the reference scale was evaluated asu(Dh0
comp) = 7.1 nm.
Since the reference scale was thus calibrated, its uncer-tainty can be evaluated using the type B evaluation method. The uncertainty due to the effect of pointing u
(Dh0
point) was analyzed in greater depth. Since the widths
of graduation lines of the reference scale and the reticle crosshair of TS telescope do not match exactly, they have to be measured separately[5]. As is shown inFig. 2, the center of the TS reticle was pointed along the line center of the reference scale. The vertical angle was measured between the two line centers of the reference scale with the vertical distance (Dh) between them. The zoom inset shown inFig. 2illustrates the fact that width of the refer-ence scale line (WS) and the cross line of the TS reticle (WTS)
differ. Therefore, this uncertainty has to be evaluated. The uncertainty due to the pointing to the line center of the reference scaleu(hpoint) varies in a way that is
depen-dent on the distance between the scale and the telescope.
It can be expressed below, this being based on a triangular distribution as follows:
uð
Dh
0 pointÞ ¼WSffiffiffiWTS 6
p ð9Þ
whereu(Dh0
point) – the uncertainty due to pointing to the
line center of the reference scale; WS – the line
half-width of the reference scale in the image plane, this depending on the distance between the device and the ref-erence scale; andWTS– the constant half-width of the
ret-icle line of the TS telescope.
The uncertainty due to horizontal distance in the approach of the displaced target technique depends on the laser interferometer measurements and this can be expressed as follows:
u2
Dl
0 ¼c2l u
2
Dl
0LIcal
þu2
Dl
0LIrep
þu2
Dl
0LIres
n o
ð10Þ
where u2(Dl0
LIcal) – the standard uncertainty due to the
laser interferometer;u2(Dl0
LIrep) – the standard uncertainty
due to repeatability of the laser interferometer; andu2
-(Dl0
LIres) – the standard uncertainty due to limited display
resolution of the laser interferometer.
The uncertainty due to the total station angle measure-ments(11)contains the effect of the uncertainty due to the limited display resolution of the deviceu(hTSres) and the
uncertainty due to the repeatabilityu(hTSrep):
u2ðh
TSÞ ¼c2hTSfu2ðhTSresÞ þu2ðhTSrepÞg ð11Þ
The uncertainties due to the limited display resolution of the devices can be evaluated as shown below in(12):
uðhTSresÞ ¼
R
2pffiffiffi3 ð12Þ
whereR– the display resolution of the total station. Eq.
(12)can be used for the uncertainty, arising due to the lim-ited resolution determination of any instrumentation used for measurement. The uncertainties due to the repeatabil-ity can be evaluated by determining the standard uncer-tainties of the measurement sets and then calculating the pooled standard deviation. The uncertainty due to the tilt of the reference scale may be expressed as:
uðhtiltÞ ¼
WLB0:5
ffiffiffi
3
p ð13Þ
whereWLB0.5– the half width of the laser beam reflection.
In the approach where the reference scale remains sta-tionary, the uncertainty due to the vertical distance has the same components. However, the uncertainty due to the horizontal distance (l) can be expressed as follows:
u2ðlÞ ¼c2
l u
2ðl
TSÞ þu2ðlpÞ þu2ðlMÞ þu2ðlSÞ
ð14Þ
whereu2(l
TS) – the standard uncertainty due to the TS
mea-surements of the distance between the TS and the prism;
u2(l
p) – the standard uncertainty due to the prism
mea-surements of the prism constant determination;u2(l
M) –
the standard uncertainty due to the measurements to the mirror for prism constant determination; andu2(l
S) – the
To evaluate the uncertainty due to the TS distance mea-surementsu(lTS), the uncertainty due to the limited display
resolution of the distance measurement readingsu(lTSres)
and uncertainty due to the TS distance measurement repeatabilityu(lTSrep) have to be taken into consideration.
This is done for three separate distance measurements as well as for the micrometer used for the depth measure-ments parameters. Therefore, the uncertainty due to the horizontal distance measurements with the TS can be determined as shown in Eq.(15):
u2ðlÞ ¼c2
l
u2ðl
TSres1Þ þu2ðlTSrep1Þ þu2ðlTSres2Þþ þu2ðl
TSrep2Þ þu2ðlTSres3Þ þu2ðlTSrep3Þþ þu2ðl
lmcalÞ þu2ðllmrepÞ þu2ðllmresÞ 8
> < > :
9 > = > ; ð15Þ
whereu(lTsres1),u(lTsres2),u(lTsres3) – the standard
uncertain-ties due to the limited display resolution of the TS for dis-tance measurement; u(lTsrep1) – the standard uncertainty
due to the repeatability of the distance measurements between the TS and the prism mounted on the scale;u
(lTsrep2) – the standard uncertainty due to the repeatability
of the distance measurements between the TS and the prism mounted on the mirror (the prism constant determi-nation); u(lTsrep3) – the standard uncertainty due to the
repeatability of the distance measurements between the TS and the mirror (the prism constant determination);u
(llmcal) – the standard uncertainty due to the depth
micrometer;u(llmrep) – the standard uncertainty due to
repeatability of the depth micrometer;u(llmres) – the
stan-dard uncertainty due to the limited display resolution of the depth micrometer.
According to the expression for the measurement func-tion, in the approach using the displaced scale the sensitiv-ity coefficients for the uncertainty due to the horizontal distance measurements can be expressed as:
cli¼ @
b
@
D
li
¼
Dh
Dl
2i þ
Dh
2 ð16Þ
whereDli– the average of horizontal distances measured
by interferometer, andDh– the vertical distance between the two lines of the reference scale.
Sensitivity coefficients for the uncertainty due to verti-cal distance determination can be expressed:
chi¼ @
b
@
Dh
¼
D
liD
l2i þD
h2 ð17Þ
The sensitivity coefficient for angle measurements by the TS can be expressed as:
chTS¼ @
b
@hTS
¼ 1 ð18Þ
The uncertainty evaluation was performed according to industry standards and based on the principles provided in JCGM 100:2008[6].
4. Experimental results
The correction value was evaluated taking into consid-eration all the instrumentation used for the measurements described above and as shown in(5). The uncertainty com-ponents obtained are given inTables 1and2.
In the approach undertaken with the moving scale, eight displacements of the reference scale were measured by using the laser interferometer. Therefore, there were eight sensitivity coefficients which were determined as well as eight combined uncertainties expressed for the cor-rection values. Since the sensitivity coefficients vary, an expression is then given inTable 1.
As can be seen from Table 1, in the displaced scale approach, the repeatability of the laser interferometer influences the horizontal distance measurements most sig-nificantly. For the vertical distance measurements, the tilt of the reference scale is crucial. Overall, taking into account the variable sensitivity coefficients, the combined uncer-tainty of the correction value is determined uc(Bi)
= 0.29400 and the expanded uncertainty of this approach is given byU95%= 0.5900(k= 2).
The uncertainty due to the tilt of the scale also plays a major role in the stationary scale approach. It is also clear
fromTable 2that repeatability of both the total station
dis-tance and the angle measurements has a significant impact on the measurement results. In the stationary scale approach the uncertainty of the correction value was determined to be uc(B) = 0.1000 and the expanded
[image:6.544.137.408.55.195.2]uncer-tainty of this setupU95%= 0.2400 (k= 2.447).
To sum up, the horizontal distance measurements have the most combined uncertainty components in the method with the stationary reference. However, this provides a smaller level of uncertainty of the correction value. The uncertainties due to the repeatability and the resolution of the total station (TS) have the highest impact on the measurement results, as well as the uncertainty due to the tilt of the reference scale. In the method with the displaced reference scale, the uncertainty due to the hori-zontal distance measurements is very small compared to
the use of an alternative approach. However, the expanded uncertainty was most significantly influenced by the repeatability of the TS measurements, which have a greater standard deviation, this most likely arising due to the motion of the reference scale.
5. Conclusions
[image:7.544.37.505.73.247.2]A novel trigonometric setup for the calibration of the vertical angle measuring systems has been proposed in
Table 2
Uncertainty budget for the calibration method with the stationary reference scale.
Source of uncertainty Standard uncertainty
Sensitivity coefficient
Uncertainty contribution |
ci|u(xi)
Probability distribution
Combined uncertaintyu(Dh) 4.398104
m 1.068105
2.03107
rad Rectangular Uncertainty due to the reference scaleu(DhScal) 7.7105m Normal
Uncertainty due to thermal expansion of the reference scaleu(DhStherm) 5.0107m Rectangular
Uncertainty due to compression effect of the reference scaleu(DhScomp) 7.1109m Rectangular
Uncertainty due to pointingu(Dhpoint) 5.5107m Triangular
Uncertainty due to the tilt of the scaleu(Dhtilt) 4.3104m Rectangular
Combined uncertaintyu(l) 6.738105
m 4.620104
7.21010
rad Normal Uncertainty due to limited display resolution of the TS (distance measurements
between TS and the prism)u(lTSres1)
2.8106
m Rectangular
Uncertainty due to repeatability of TS (distance measurements between TS and the prism)u(lTSrep1)
5.0105
m t(Student’s)
Uncertainty due to limited display resolution of the TS (distance between TS and the prism measurements – prism constant determination)u(lTSres2)
2.8106m Rectangular
Uncertainty due to repeatability of TS (distance between TS and the prism measurements – prism constant determination)u(lTSrep2)
2.0105
m t(Student’s)
Uncertainty due to limited display resolution of the TS (prism constant determination)u(lTSres3)
2.89106
m Rectangular
Uncertainty due to repeatability of TS (distance between TS and the mirror measurements – prism constant determination)u(lTSrep3)
4.0105m t(Student’s)
Uncertainty due to micrometeru(llmcal) 3.0106m Normal
Uncertainty due to repeatability of the micrometeru(llmrep) 2.25106m t-(Student’s)
Uncertainty due to limited display resolution of the micrometeru(llmres) 8.66107m Rectangular
Combined uncertaintyu(hTS) 0.09900 1 0.09900 t-(Student’s)
Uncertainty due to limited display resolution of the TS (angle measurements)u
(hTSres)
0.02900 Rectangular
Uncertainty due to repeatability of TS (angle measurements)u(hTSrep) 0.09500 t-(Student’s)
Uncertainty of the correction valueuc(B) 0.1000 t-(Student’s)
[image:7.544.39.505.289.564.2]Expanded uncertaintyU95%(k= 2.447) 0.2400
Table 1
Uncertainty budget for the calibration method with the displaced reference scale.
Source of uncertainty Standard
uncertaintyu(xi)
Sensitivity coefficientci
Uncertainty contribution |ci|u(xi)
Probability distribution
Combined uncertaintyu(Dl0) 1.102104m Dh
Dl2 iþDh
2 Dh
Dl2 iþDh
2
1:102104 t-(Student’s)
Uncertainty due to the laser interferometeru(Dl0LIcal) 1.0106m Normal
Uncertainty due to repeatability of the laser interferometeru(Dl0LIrep) 1.1104m t-(Student’s)
Uncertainty due to limited display resolution of the laser interferometeru(Dl0LIres) 2.89105m Rectangular
Combined uncertaintyu(Dh0) 4.398104m Dli
Dl2 iþDh
2 Dli
Dl2 iþDh
2
4:398104 Rectangular
Uncertainty due to reference scaleu(Dh0Scal) 7.7105m Normal
Uncertainty due to thermal expansion of the reference scaleu(Dh0Stherm) 5.0107m Rectangular
Uncertainty due to compression of the reference scaleu(Dh0Scomp) 7.1109m Rectangular
Uncertainty due to pointingu(Dh0point) 5.5107m Triangle
Uncertainty due to tilt of the scaleu(Dh0tilt) 4.33104m Rectangular
Combined uncertaintyu(hTS) 0.29400 -1 0.29400 t-(Student’s)
Uncertainty due to limited display resolution of angle readings of the TSu(hTSres)
0.02900 Rectangular
Uncertainty due to repeatability of TS (angle measurements)u(hTSrep) 0.29300 t-(Student’s)
Uncertainty of the correction valueuc(B) 0.29400 t-(Student’s)
the paper. In the work done, it was determined that the expanded uncertainty for the method using the displaced reference scale wasU95%= 0.5900 (k= 2) and using the
sta-tionary reference scale, U95%= 0.2400 (k= 2.447). It was
determined that the most significant uncertainty sources seen are the repeatability and the resolution of the total station (TS), as well as the tilt of the reference scale. There-fore, this leads to the conclusion that the motion of the scale increases the uncertainty by a factor of 2.5. The angle measurement pitch can be controlled by adjusting the dis-tance between the device and the reference scale. Although, the measurement range is limited to 90°± 17°, which is smaller in comparison with method described in
[12], it can be expanded by adapting a longer calibration scale. Moreover, by using proposed method, some very small angles could be measured by controlling both hori-zontal and vertical distances. However, the smallest mea-surement pitch mentioned in [12] is dependent on the indexing table used and often limited to 1500 when using
Moore 1440 Precision Index.
Acknowledgements
This research was funded by the European Social Fund under the Global Grant measure.
References
[1]D. Brucˇas, A. Anike˙niene˙, L. Šiaudinyte˙, V. Giniotis, J. Stankunas, A. Zakarevicˇius, J. Skeivalas, Principle and data analysis of vertical angle calibration of geodetic instruments, J. Vibroeng. 12 (4) (2010) 635– 641. ISSN 1392-8716.
[2] J. Braun, J. Dvoracek, M. Štroner, Absolute baseline for testing of electronic distance meters, in: Proceedings of INGEO 2014 – 6th International Conference on Engineering Surveying, Prague, Czech Republic, April 3–4, 2014, pp. 175–180.
[3]D. Brucˇas, L. Šiaudinyte˙, M. Rybokas, K.T. V Grattan, Theoretical aspects of the calibration of geodetic angle measurement instrumentation, Mechanika 20 (1) (2014) 113–117. ISSN 1392-1207.
[4]D. Brucˇas, L. Šiaudinyte˙, M. Rybokas, K.T.V. Grattan, G. Kulvietis, G. Dmitrijev, Methodology of calibration of vertical angle measurements, J. Meas. Eng. (JME) 1 (1) (2013) 8–14. ISSN 2335-2124.
[5]X. Fuhe, Y. Dezheng, Improving the accuracy of vertical angle observations, J. Cent. S. Univ. Technol. 3 (2) (1996) 185–190. [6] JCGM 100:2008, Evaluation of measurement data – guide to the
expression of uncertainty in measurement, Joint Committee for Guides in Metrology, JCGM 100:2008, 2008, 134p.
[7] L. Legendre, G. Brigodiot, F. Tronel, The determination of uncertainties in compression testing, UNCERT COP 08: 2000, Standards Measurement & Testing Project No. SMT4-CT97-2165, EADS Centre Commun de Recherche, Paris, 2000, 16p.
[8]H. Lippuner, R. Scherrer, Die neue Theodolit-Prufmaschine TPM-2 von Leica Geosystems, Allgemeine Vermessungs-Nachrichten: AVN; Zeitschrift fur alle Bereiche des Vermessungswesens 112 (5) (2005) 170–176.
[9] D. Martin, Instrument calibration at the ESRF, in: Proceedings of XXIV FIG International Congress, Sydney, Australia; 2010. [10] Y. Nakamura, S. Yanobe, Rotary encoder, US patent No. US6922899
B2, 2005.
[11]A.S. Ribeiro, A.C. Santos, J. Alves Sousa, A.B. Forbes, Quality assessment of vertical angular deviations for photometer calibration benches, J. Phys: Conf. Ser. 588 (2015) 012002. [12]L. Šiaudinyte˙, H. Suh, Uncertainty evaluation of proposed setup for
the calibration of vertical angle measuring systems by using means for the flat angle calibration, Measurement, vol. 67, Elsevier Ltd, Oxford, 2015, pp. 177–182. ISSN 0263-2241.
[13]L. Šiaudinyte˙, Modelling of linear test bench for short distance measurements, ACTA IMEKO 4 (2) (2015) 68–71.