JOURNAL OF VIROLOGY, Dec. 1974, P. 1559-1574 Copyright 0 1974 American Society for Microbiology
Vol. 14, No. 6 Printed in U.S.A.
Murine
Type-C Virus Group-Specific
Antigens: Interstrain
Immunochemical, Biophysical,
and
Amino Acid
Sequence Differences
STEPHEN OROSZLAN, MURRAY R. SUMMERS, CAROL FOREMAN, AND RAYMOND V. GILDEN Flow Laboratories, Inc., Rockville, Maryland 20852
Received forpublication28June 1974
The 30,000-molecular-weight
internal protein, p30, was purified from sevenstrains of
mousetype-C
viruses. The individual p30's showed variation in isoelectric points and also intrastrain heterogeneity. The individual p30's could bedistinguished by peptide
map andquantitative complement fixationtech-niques
with relatedness
estimates of >95%. Amino terminal sequence analysisshowed variability at position 4 for several p30's with complete homology
otherwise through
24residues.
The intrastrain heterogeneity in p30 isoelectricpoints
could
notbe
explained by
common contaminants, as shown by peptidemapping, and is more likely based on
post-transcriptional
modifications. Thesedata
provide
achemical
basis
fortherecently
described type-specificimmuno-logical
properties ofindividual
p30's.
The 30,000-molecular-weight
internal protein,the major group-specific
(gs) antigen or p30, ofmurine
type-C
viruses is an antigenic mosaicwith determinants restricted
to mouse viruses(species-specific)
and determinants shared byother mammalian
type-C
viruses(interspecies)
(13, 33, 35, 40; J. T. August, D. P. Bolognesi, E.Fleissner, R. V. Gilden,
and R. C. Nowinski,Virology,
inpress).Current evidence indicates
amultiplicity
ofdeterminants
ineach
category(9;
J.Davis,
H.P.
Charman,
S.Oroszlan,
andR. V.
Gilden, Intervirology,
inpress).
Morerecently, type-specific determinants have
alsobeen detected
by use ofradioimmunoassay
(40)and quantitative
C'
fixation(R.
V.Gilden, S.
Oroszlan, and M. Hatanaka, In K.
Maramo-rosch and E. Kurstak (ed.), Virus evolution and
cancer, in
press).
These various determinantshave value
forviral genetic studies and
studies
ofdistribution
ofviral proteins
inthe absence
ofinfectious
virus (1, 17, 34, 37). In support ofthe
immunological data showing
typespecificity
ofmurine
p30's,
we now reportdifferences
inprimary structure obtained using
peptide
mapand
aminoacid
sequencing
techniques.
Evi-dence for
heterogeneity
and strain differences inthe isoelectric point (pI)of murine
p30's
is alsodescribed.
MATERIALS AND METHODS
Murine leukemiavirus(MuLV). Several strains ofmouse leukemia virus were usedinthese studies. Rauscher virus (R-MuLV) was grown in monolayer
cultures of chronically infectedmouse(BALB/c) bone marrow, JLS-V9 cells (50). The virus-shedding cell linewasobtained from Electro-Nucleonics, Bethesda, Md. AKR virus was obtained from NIH Swiss embryo cells infected with an isolate from the spleen of an AKR mouse. These cells were kindly provided by Janet Hartley (National Cancer Institute). The La Puente isolate (1504E) of the wild mouse leukemia virus (WMLV) was obtained from Earle Officer (Uni-versity of Southern California, Los Angeles, Calif.) (31; M. B.Gardner, J. E. Officer, R. W. Rongey, H. P. Charman, J. W. Hartley, J. D. Estes, and R. J. Huebner, Bibl. Haematol., in press) andwasgrownin monolayer wild mouseembryo cultures. New Zealand black (NZB) mouse type-C virus was grown in sus-pension cultures established from a fibrosarcoma, SCRF 60A, at Scripps Clinic, La Jolla, Calif. (18). AT-124 mouse virus growninhuman rhabdomyosar-coma (RD) cells was propagated as described by Todaro et al. (44). Moloney mouse sarcoma virus
(M-MSV) was produced in a rat tissue culture cell
line, 78A1 (4), obtained through the courtesy of Maurice Green (Institute of Molecular Virology, St. Louis, Mo.). The wild mouse cell line shedding Kaplan radiation leukemia virus (Rad LV) derived from an X-irradiated
C,7Bl
mouse (19)wasobtained fromJanetHartley.Rattype-Cvirus. Rattype-Cvirus, apseudotype of murine sarcoma virus, M-MSV(RaLV), was ob-tained from the MSB-1 cell line (43) derived from a tumor induced by M-MSV in a female rat of the Brown-Norway strain, as previously described and characterized (28).
Feline type-C viruses. Feline leukemia virus (FeLV, Theilen strain) was obtained from a chroni-cally infectedcatlymphocyticcellsuspensionculture (42). RD 114,anendogenouscatvirus,wasthe isolate 559
on November 10, 2019 by guest
http://jvi.asm.org/
OROSZLAN ET AL. from the RD rhabdomyosarcoma cell line of
McAl-lister et al. (21).
All monolayer culturesweresupplemented by 10% fetal bovine serum, and suspension cultures were supplementedby20%fetal bovineserum.
Virus purification. Tissue culture fluids were clarified by filtration through a membrane filter (Millipore Corp., 1.2
/im
pore size). The virus was concentrated by continuous-flow centrifugation with isopycnic banding in Tris-buffered (0.01 M, pH 7.4) sucrosegradients (20 to 50%,wt/wt).Fluid volumes of 20to 30liters werecollectedatflowratesof4.0 to 4.5 liters/h with a CF-32 continuous-flow rotoroperated by an L-350 ultracentrifuge(Spinco).Larger volumes (50 to 100 liters) were collected at flow rates of 13 liters/h on the K-6 continuous-flow rotor of the model K Mark IIultracentrifuge (Electro-Nucleonics). The concentrated virus was thereafter diluted with TNE buffer (0.01 M Tris-hydrochloride,0.1 MNaCl,0.001 MEDTA, pH 7.4) and rebanded a secondtimeusing eithera Ti-14, Ti-15, or JCF-Z zonal rotor (Spinco) operating for 1, 2, or 3 h, respectively, at maximum speed.Virus bands were localized by monitoring the absorbance at280nmandby the microcomplement-fixation (CF) tests for the major gs antigen,p30 (31). Sucrose gradient-purifiedvirusused forthe purifica-tionofviral proteins wasdiluted with TNE buffer and pelleted to thebottom of the centrifuge tubes.
Disruptionof virusand purification of themajor
gsantigen(p30)by isoelectricfocusing: procedure A. Purified viruswasdisrupted with Tween 80-ether and exhaustively extracted with the organic solvent by previously described procedures (31-33). Isoelec-tric focusing was carried out in 1 to 2% ampholine solution having a pH range of 5 to 8, in a sucrose gradient of 0 to 40% as described previously. When protein inputs were higher than 10 mg per column (LKB 8101, 110 ml), 2%ampholine wasused.
Procedure B. Purified virus pellets were resus-pended in0.01M Tris-acetatebuffer, pH 7.8, contain-ing 0.1 M NaCl. The protein concentration was determined, and sodium dodecyl sulfate (SDS,
Sequenal grade, Pierce Chemical Co., Rockford, Ill.)
wasadded at a fivefold weight excess. After addition of 2-mercaptoethanol (2-ME, Bio-Rad Labs, Richmond,
Calif.) to afinalconcentration of0.01 M, the mixture
was kept at room temperature for 1 h. The solution was then made 6 M in deionized and recrystallized ureaand incubated at room temperature for 30min. SDS was removed on a Dowex AG-1X2 (Bio-Rad) anion exchange column by themethod of Weber and Kuter (46). Inagreement with these authors, we found that35S-labeled SDS was completely removed by this procedure. TheSDS- and RNA-free (the viral RNA is also stronglybound by the anion exchange resin) viral protein solution was analyzed chemically for total protein content and serologicallyfor gs antigen after the removalofureaby dialysis. Essentially complete recovery of the viral proteins was obtained. SDS-polyacrylamide gel electrophoresis patterns of the disruptedviral proteins beforeand after removal of detergent by the Dowex resin were identical after staining with Coomassie brilliant blue (Fig. 1). The
fact that the strong anionicdetergent could be com-pletelyremovedby the aboveionexchangeprocedure made possible the use of the isoelectric focusing technique for the purification of gs antigen after complete denaturation of viralproteins.Accordingly, these denatured RNA-free viral proteinpreparations wereelectrofocused in the presence of 2% ampholine, with a pH range 5 to 8, and a 0 to 40%sucrosegradient usually for 64 h at 700 V and 6C. In these elec-trofocusing runs a strong precipitate was formed, usuallyappearing in three distinct precipitationrings inthe acidic region (below pH 4.5) of the pH gradient. Therefore, instead of emptying the column through the bottom outlet tubing, another fractionation method was used after the completion of the run.A piece ofnarrowTygon tubingwas inserted carefully viathe upper nipple ofthe column-filling compart-mentwith its endasclosetothe upperprecipitin ring as possible, with care taken not to disturb the precipitate. It was secured inthis position, and the gradient was pumped out with a peristaltic pump with a slow, constant flow rate. The effluent was monitored at 280nmwith an ISCOUA-2 ultraviolet analyzer, and1.5- to2-ml fractionswerecollectedas usual.
Procedure C. Viruswas disruptedasinprocedure B but electrofocusingwas carried out ina 1 to6M ureagradient instead of sucrose.Other conditions for the electrofocusing run and method of fractimation werethe same as in procedure B.
All gs antigens purified by electrofocusing were chromatographed on Bio-Gel P-10 or Bio-Gel P-100 (Bio-Rad) columns equilibrated with 0.33 M ammo-nium acetate (30)or0.25M ammoniumbicarbonate, and protein was recovered by lyophilization.
Guanidine-hydrochloride-agarose gel
chroma-tography. The previously described procedure of Fish etal.(11), asadaptedby Fleissner (12) and Nowinski etal. (25), for the separation oftype-C virus proteins wasused. Purified virus pellets were disrupted with 8 M guanidine-hydrochloride (GuHCl) (Heico, Inc., Delaware Water Cap, Pa.) and 2% 2-ME, in 0.05 M Tris-hydrochloride buffer, pH 8.5, containing0.01 M EDTA, at 56 C for 45 min. Agarose (Bio-Gel A-5M, Bio-Rad) columns were developed with 0.02 M so-dium phosphate buffer, pH 6.5, containing 6 M GuHCl and 0.01 M dithiothreitol (Calbiochem, La Jolla, Calif.). To recover proteins for chemical analy-sis,fractions weredialyzedexhaustively against0.1 M
NH4HCO,
andlyophilized. When necessary, p30-con-taining fractions were rechromatographed to obtain high purity protein preparations.Quantitative complement fixation. Quantitative
CF tests wereperformed asdescribed (R. V. Gilden, K. Frank, M. Hanson, S. Bladen, R. Toni, and S.
Oroszlan, Intervirology, inpress) with adjustmentof
testvolumesof3.0 ml.These procedures used limited
C',"1.1C'H5ounits,andhemoglobinreleased by lysis
is estimated at 413 nm using a spectrophotometer. Controls of antigen alone, antigen and complement, andserum and complementwereemployedforeach testsystemtocontrolfornonspecificcontributionsto
A4,8
andanti-C' activity. With the dilutionsof serum employed (>1:1,000) and the low concentrations of1560 J. VIROL.
on November 10, 2019 by guest
http://jvi.asm.org/
MURINE TYPE-C VIRUSGROUP-SPECIFIC ANTIGENS purified antigen(<1
lMg/ml)
used,nocorrectionswerenecessary. A series of eight twofold dilutionsofeach
purified p30 starting at 1 ug/ml was mixed with
increasingdilutions of guineapigantiserumprepared againsteachprotein.At least four increasing dilutions ofantiserumweretestedineachcaseonethe
approxi-mate titer (-75% maximum binding) was
estab-lished.Eachblock oftestswasperformedonthesame
day (one serum, all antigens), and end points were
repeated at least three times to insure relative reproducibility.Themixtures of antigenandantibody (0.5mleach) wereincubatedwith C'(1.0ml usually
of 1:300 guinea pig serum) for 18 h at 5 C. A 1-ml volumeofsensitized red bloodcellswasaddedfor 60
minat37C before centrifugation and determination of absorbanceat413nm.
Determination of N-terminal amino acids. The procedure described by Weiner etal. (49) was used
withoutmajormodificationsforthe determination of N-terminal amino acids. Purified proteins (25to 50 Mg) dissolved in 100 Mliters of 0.1 M
NaHCO,
weredansylated, hydrolyzed, and prepared from chroma-tography accordingtoWeineretal.(49). Two-dimen-sional thin-layer chromatography was performed on
double-layered Cheng-Chin polyamide sheets (Gal-lard-Schlesinger, Carle Place, N.Y.) using asolvent
system of 1.5% formicacid and benzene-acetic acid
(9:1).
Determination of carboxyl terminal amino acids.C-terminal amino acidsofmurinetype-C virus p30's weredeterminedusingcarboxypeptidase A (2),
or a combined hydrazinolysis-dansylation micro method (Summers, unpublished data), analogous to
thepreviously describedhydrazinolysis-dinitrophenyl technique of Akaborietal. (23).
Aminoacidanalysis. Samplestobeanalyzedwere
placedinanignition tube anddissolvedin constant-boiling HCl containing 0.05% mercaptoethanol and 0.5% phenol. The tubes were then evacuated and
flushed with ultra-pure N2 gas three times before
being sealed at <500 Mm pressure. Hydrolysis was
effected by heating at 110C for varying periods of time. Samples were quenched in ice to terminate hydrolysis and then taken to dryness invacuo. For
application tothe Beckman 121 H amino acid
ana-lyzer, thesedried sampleswereredissolvedinpH2.2 sodium citrate buffer. The component amino acids
wereeluted using the Beckmansingle-column
meth-odology, and peak areas were determined
electroni-callywithanAutolabs SystemAAcomputing integra-tor.Foreach of the proteinsanalyzed, the reproduci-bilityofthe values for thestableamino acids obtained with this technique was 96% or better based on
standard deviation of the mean. The number of
residuespermolewascalculated by dividingthe total recovery from the analyzer in nanograms by the
knowngrammolecularweightoftheproteinx 10- to
obtain thenanomolar input.Thenanomolarvalue for each residue is then dividedbythetotalprotein input innanomolestogivethe number of residuespermole.
Peptide mapping. Between 100 and 500 yg of protein wasdigested overnight with 2%by weightof TPCK trypsin (Worthington Biochemical Corp., Freehold, N.J.).Thedigestionwasstopped by drying
the mixture in vacuo and then redissolving it in a small volume of chromatographic solvent n-butanol: pyridine:acetic acid:H,O (90:60:18:72, vol/vol/vol/ vol). No less than100ug of protein was then applied in acompact spot (by repeated application and cold airdrying) to a
100-Mm
layer ofmicro-crystalline (E. Merck,Darmstadt, W. Germany) orMacherey-Nagel (Cel 300-10 Macherey-Nagel, Duren, W. Germany) cellulose on a glass plate (20by 20 cm). The platewas then allowed to equilibrate with chromatographic solvent overnight in a closed chamber. After a 5-h ascending development at constant temperature, the plate was air-dried for 1 h and then subjected to electrophoresis at right angles to the direction of chromatographic separation in a pH 3.6 pyridine-acetic acid buffer at 900 V. After oven drying, the peptide spots were visualized with a collidine-buf-feredninhydrin spray (M. R. Summers, R. V.Gilden, andS. Oroszlan, Fed. Proc. 33:1564, 1974).SDS-polyacrylamide gel electrophoresis
(SDS-PAGE). Viral protein mixtures or purified proteins weresubjected to electrophoresis in 10%acrylamide gels as previously described (47). The gels were stained withCoomassie blueby the method of Fair-banksetal. (10).
Immunodiffusion. Double immunodiffusion was
done inplates that contained 0.8% agarose, pH 7.4, ionicstrength 0.15. In preparing plates, 8 g of agarose,
9.3gofTris
2-amino-2-(hydroxymethyl)-1,3-propane-diol,74ml of1NHCl,and7.0g ofNaCl were made up
to 1 liter with distilled water (8). Merthiolate (1: 10,000) was added as apreservative. Plates were kept at room temperature, observed for 72 h, and photo-graphed when optimum precipitation lines devel-oped.
Protein determination. Protein was determined bythe modified Lowry method (20) usingcrystalline bovine serum solution asstandardorbytherecently described method of Schaffner and Weissman (39), based on colorimetric determination of bound dye Amidoschwarz 10B (E. Merck), usinglyophilized
p30
protein dried to constantweight asstandard.Antisera. The preparation ofall antisera used in these studieswas described inpreviouspublications (13, 29,31-33).
RESULTS
Isoelectric heterogeneity of the
major
gsantigen
(p30).
Isoelectric
focusing
(49),
with itssuperb
resolving
power,has
proved
tobe
avaluable method
forthe purification
of gsanti-gens.
Our initial
experiments
carried
outwith
arelatively low amount of input mouse virus
(R-MuLV
andAKR)
proteins (31, 32) showed
no overt
heterogeneity
ofthe
gsprotein;
how-ever,
isoelectric
heterogeneity has been
consist-ently detected
over aperiod
ofseveral
yearswith larger viralprotein input.
Figure
2 illustrates anisoelectric
focusing
profile
ofR-MuLV
proteins
disrupted
with
Tween-80
ether
(Tween
80/protein
= 2.5wt/
wt). After
removal
ofall the
ether-extractable
VOL.14,1974
1561
on November 10, 2019 by guest
http://jvi.asm.org/
A
2 W$ K N v
F?
,i
I1.
1
/
'Ij
0 1 2 3 4 5 6
MIGRATION
IN
cmII
I/
l- /
7 8
.:.R .
I 2 3 4 5 6 7 8
1k) ii
U~~~~~~~~~~~~~~,
VEt
.l
a
>:
a
X
MIGRATION
INccm
1562
E In '0 LU z C
m 0
CO,
an
L-Un
LO
z
m
n! 0 omn
0
-N
R
toon November 10, 2019 by guest
http://jvi.asm.org/
MURINE TYPE-C VIRUSGROUP-SPECIFIC ANTIGENS
lipids and
detergent,
the isoelectric
focusing
was
carried
outin
apH
gradient
of
5 to8with
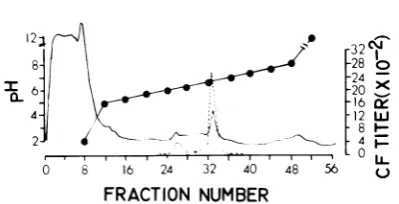
2%ampholine. The CF data show
clearly
amajor
peak
atpH
6.7and
a minorpeak
atpH
6.2
superimposable
ontheoptical
density peaks
inthose pH
ranges.Similar data
wereobtained
by
screeningthe isoelectric
focusing fractions
inimmunodiffusion
(Fig. 3). The
strongest precip-itinlines
wereobtained with
fractions32, 33,
and
26,respectively.
Inthis
figure, the
antigenic
identity
ofthe
twodistinct
isoelectric molecular
species (pI
6.7, fraction 33,and
pI 6.2,fraction
26) is
also
shown with
amonospecific guinea
pig
serum
and
apolyspecific
rat serum(reacts with
other viral
components,p30, and p15
inimmu-nodiffusion)
prepared
againstM-MSV-induced
rat tumor
homogenates.
Inthis
particular
ex-periment, a
total
of18.8mg ofviral
protein
wasused and
approximately
25% ofthat
wasre-covered
inthe
pH
6.7and
6.2peak fractions.
Inaddition, the quantitative data obtained
by
determination
ofprotein
aftertrichloroacetic
acid
precipitation
fromthe
ampholine-sucrose
solution,
orby
estimation fromthe
absorbance
at 280 nm
and also
by
CF titers, indicated that
approximately
10 to 12% ofthe total
p30
re-covered
inthe
CF-positive
fractions
wasfocused
atthe lower
pH value. Similar isoelectric
het-erogeneity could be demonstrated with other
MuLV
p30's.
These results
werealso
obtained
when
completely denatured
(SDS-urea-2-ME,
see
Materials
andMethods, procedures
B andC)
virusprotein
mixtures wereelectrofocused.
A
comparison
ofthe isoelectric
focusing
pat-terns of
R-MuLV and
WMLV canbe
seen inFig.
4. Inthe
case ofR-MuLV,
the
major
isoelectric
protein
species focused
again
atpH
6.7,
and
the
minorfocused
atpH
6.2(upper
graph). With
WMLV,
one ofthe
two gs(p30)
reactive
peaks
wasfound
again
atpH
6.2,
whereas the
larger peak
focused
atpH
7.1.Serological
testswith
specific
anti-p30
sera,both
inCF and
immunodiffusion,
indicated
asimilar resolution
superimposable
onthe
ab-sorbance
tracing. With
atotal
protein
input
of11.4mg of
R-MuLV and
13.8mg ofWMLV,
the
quantitative determinations data
andCF
testsindicated
a recovery ofabout
25 to 30%oftotalprotein and
CF
units inthesetwopeaks
ineachcase.
However,
thep30
protein
inthe
pH
6.2minor
peak
wasfoundtobeapproximately
10%of
the total
recovered R-MuLV and30 to 33%for8* 28 oC
6 -20
-16~
4- -12 LL
2 4
0 8 16 24 32 40 48 56
FRACTION NUMBER
FIG. 2. Isoelectric focusing of Tween-ether-dis-rupted R-MuLV (seeMaterials andMethods, proce-dure A) solubleproteins in2%ampholine, pH gradi-entof5 to 8 at 700Vand 6C for 64 h. A bsorbance at 280 nm (solidline) was monitored with a model UA-2 ultraviolet analyzer(ISCO) with the range setting at 0.1and 0.25 and the
"Adj.
Stand", setting at 5, using a3-mm light path flow cell. CF titers (broken line) weredetermined in microCF tests.WMLV
p30. Subsequent analysis
inSDS-PAGE confirmed the
presence of a main proteincomponent of
identical
size,with
amolecular
weight of
about
30,000(p30)
inthe
peakfrac-tions
and
having different isoelectric
pointsboth
for
R-MuLV and WMLV. Although R-MuLV pI
6.7and
6.2and WMLV
pl
7.1fractions
werehomogeneous
tothe
extentthat
p30
was theonly detectable
protein inthe gel,
WMLV pI
6.2fraction
contained,
besides the
mainp30,
threeother
minor components(Fig.
5).To
ascertainwhether the altered I
wasdue
to complexformation
between
p30 and the
other proteincomponents, WMLV pI 6.2
peak
wasre-elec-trofocused
inthe
presence ofdeionized
ureautilizing
a 1 to 6 M ureagradient
instead ofsucrose to prevent reassociation of
the
proteincomponents.
The
serologically
active gsp30
antigen
re-electrofocused
tothe
samepH, thus
excluding the
possibility
ofthe involvement
incharge
heterogeneity
ofprotein-protein
interac-tions
through
binding
forces sensitive to urea.The
apparentpH
ofampholine
solutions
inthe
presence of urea is
higher than the actual
value(38), and therefore appropriate
corrections weremade when
pH
ofurea-containingfractions
wasdetermined.
The urea concentration atthis
peak (pH
6.2) was 4.0 to 4.3 M.It was ofinterest to
serologically
characterize
gs
antigens
withdifferent isoelectric
points.Theresults
of immunodiffusion tests of WMLV pl6.2 and pI 7.1 components are shown in Fig. 6.
In
these
testsboth species-specific
and interspe-cies antisera were included. Fromthe
results,
FIG. 1. Densitometric tracings ofR-MuLVproteins resolvedbySDS-PAGE. Before (A) and after (B),pas-sagethroughDowex 1X-2 ionexchangeresin(seeMaterials andMethods). Thenumbers (A) indicate
approxi-matemolecularweights ofthe viralpolypeptidesbasedonstandardsruninseparategels. The gelswerestained withCoomassieblue andscanningat565nm wasdonewithanActaIII(Beckman)spectrophotometerequipped witha lineargel transport device. Three peptides werefoundtoshow weak tostrong redfluorescenceunder intenselight: strong, molecular weight 11,500 and 14,000; weak, molecularweight27,000.
VOL.14,1974
1563
on November 10, 2019 by guest
http://jvi.asm.org/
[image:5.499.252.452.63.165.2]OROSZLAN ET AL.
FIG. 3. Immunoprecipitin reactionsof electrofocusedfractions (Fig. 2) withamultispecific (MSV I-7, see text)rat serumandamonospecificgsguineapig (GP anti-MuLV)serum. Theidentity ofpI6.2(Fr26and 27) andpI6.7(Fr 33) components is shown in theright-handpatterns.
the
following conclusions
canbe made. As
shown
previously
for R-MuLVpI
6.2 and 6.7components, WMLV
pl
6.2 and 7.1p30's
arealso
serologically
similar
asdemonstrated
by
the fusion of
precipitin lines obtained with all
antisera
tested
(see
legend
toFig.
6).
It isalso
evident
that both
protein molecules
carryin-terspecies determinants
aswell
(see
reactionwith
goat serumIS-8).
Interstrain isoelectric
charge
differences
of
mousep30's.
Table
1summarizesthe
results
obtained
by determining
the pI value
of gsantigens
(p30)
ofsevendifferent
strains ofthe
murine
type-C
virus group.For several
viral
p30's,
acomparison
wasmade
inthree
different
systems,
where the
method of
disruption
orthe
condition
forisoelectric
focusing
orboth
werevaried
asfollows: (i) Tween-ether
disruption
and
electrofocusing
insucrosegradient
(Mate-rials and
Methods, procedure
A); (ii)
disruption
of virus
with
SDS-urea-2-ME,
followed
by
elec-trofocusing
in sucrosegradient (procedure B),
and (iii)
disruption
of virus as perprocedure
Bbut
electrofocusing
in 1to6M ureagradient
tomaintain
dissociating conditions (procedure
C).
Other
strains were not asextensively studied
and
werecompared
primarily only
in asingle
experimental
system(i.e.,
procedure B).
The data
permit
the
following
mainconclu-sions to
be made. Each
virus strainstudied
shows
a certaindegree
ofheterogeneity
similar
tothat
described above
indetail
forR-MuLV,
AKR, and WMLV
strains(e.g.,
amajor and
atleast
one minorcomponent).
While the
pl
ofboth
major and
minorcomponents ofR-MuLV
and AKR
strains isthe
same aspreviously
reported (31), and
asdiscussed
inthis
report, asubstantial
variation occurs inthe
isoelectric
pH
ofp30's
according
tothe
virus strain,with
pIvalues ranging
from 5.4 to 7.1 forthe major and
from 5.6 to 6.4 for
the
minor components. Inseveral
strains, the major isoelectric molecular
species
representsthe
morebasic protein, but
just the opposite
is true forothers
where the
major
component isthe
moreacidic
species.The results
forthose
systemswhich have been
studied
inthe
greatestdetail
reveal thatthe pl
values
obtained
forboth
the
major and minor1564 J. VIROL.
on November 10, 2019 by guest
http://jvi.asm.org/
[image:6.499.53.450.73.382.2]VOL. 14,1974 MURINE TYPE-C VIRUSGROUP-SPECIFIC ANTIGENS
1565
components
probably
representstable
physico-chemical
parameterswhich
appear tobe
con---stant
under
the
variousexperimental conditions
and
independent
ofvariation
indisruption
and
electrofocusing
procedures.
This
suggeststhat
heterogeneity
and the strain differences in pI ofp30's
areprobably
notdue
to somekind of
ligand binding, but appear to be well-definedintrinsic properties of theindividual molecular
species.
A
majorrole
ofpolynucleotide binding
inthe
RMuLV
12
-10
8
jI
o0 4 12
16 2024
284 32L
FRACTION NUMBER
FIG. 4. Isoelectric focusing of R-MuLV andi WMLV afterdisruption and denaturation with
[image:7.499.273.413.68.459.2]SDS-urea-2ME (Materials and Methods, procedure B). Electrofocusing was carried outin
2%/
ampholine, pH 5 to 8, at 700 V and 6 C for 64 h. The absorbance at 280 nm was monitored as described in the legend to Fig. 2. The total protein inputs were 11.4 mg forR-MuLV and 13.8 mg for WMLV. In the acidic region 1 (below pH 5), a heavy precipitate was formed and
fractions were collected from above the precipitation
zone as described in the text. The peak fractions at FIG. 5. SDS-PAGEanalysis ofp16.2(left) and 7.1 highly alkaline pH (between pH 9 and 10) contained a (right) electrofocused p30 components ofWMLV (see protein with a molecular weight of about 10,000(p10). Fig. 4). Migration from top to bottom.
FIG. 6.
Immunoprecipitin
reactionsof
pI6.2 andpI7.1 WMLVp30
componentswith various gs antisera. MSVI-14: rat antiserum toM-MSV-inducedtumorhomogenate.
Goat IS-8:goatantiserum toTween-ether-disrupted FeLV
(obtained
from R.Wilsnack, Huntingdon Laboratories,
Baltimore, Md.).
Goat4: goatanti-serum toMuLVp30. R 2083: guineapigantiserum toSDS-disrupted AKR.
MgsS: guinea pig
antiserum toMuLVp3O.
on November 10, 2019 by guest
http://jvi.asm.org/
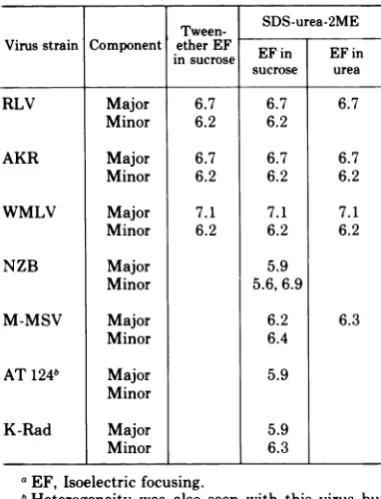
[image:7.499.45.236.195.367.2] [image:7.499.46.442.498.612.2]OROSZLAN ET AL. TABLE 1. Isoelectric points (pI) of MuLV gsAntigensa
Tween- SDS-urea-2ME Virusstrain Component in e EF in EF in
insucroseEFi EFn
sucrose urea
RLV Major 6.7 6.7 6.7
Minor 6.2 6.2
AKR Major 6.7 6.7 6.7
Minor 6.2 6.2 6.2
WMLV Major 7.1 7.1 7.1
Minor 6.2 6.2 6.2
NZB Major 5.9
Minor 5.6,6.9
M-MSV Major 6.2 6.3
Minor 6.4
AT124b Major 5.9
Minor
K-Rad Major 5.9
Minor 6.3
aEF, Isoelectric focusing.
bHeterogeneity was also seen with thisvirus but the accurate pl of the minor peak(s) could not be determined dueto
scarcity
ofinput
material.interstrain pI
differences
and also
inthe
intra-strain
heterogeneity
ofp30's has been ruled
outby experiments utilizing
[3H
]uridine-labeled
virus as
previously
reported
(31, 32).This
iscorroborated
by
the results
presented here,
which
wereobtained
by
electrofocusing
SDS-urea-2-ME-disrupted
viral
protein preparations
from
which acidic
polynucleotides
werecom-pletely removed with Dowex
1X-2
anionex-change
resin(see Materials and
Methods).
Quantitative C' fixation.
Reciprocal
tests weremade with
guineapig
antisera tothree
purified
MuLV
p30's,
namely
fromthe
AKR,
R-MuLV, and NZB-SCRF
60A
strains(major
isoelectric components). The
p30 isolated
fromWMLV strain 1504E was also tested versus
the
threeantisera;however,
as yetaguinea pig
antiserum to
this
p30
has
notbeen
prepared.
Ineach
set of assays a serum dilutioncould be
found
atwhich
only the homologous
p30
gavesignificant
C'
fixation.With each
serumdilu-tion maximum fixation was
obtained with
about
0.02 ng ofp30/ml,
with nosignificant
difference between
homologous
orheterologous
reactions.
When
the percent of fixation at thepeak
ofthe
symmetrical
curves wasplotted
versus
the
log
ofserumdilution, linearity
wasobtained with
nodifference inslope
of homolo-gousand
heterologous
reactions. Thisenables
the
calculation
ofthe
important parametersof
the
CF comparisons, namely the index of
dissimilarity, and
fromthis the
immunological
distance (I.D.)
aspreviously described (36;
Gilden
etal., Intervirology,
in press).The I.D.
was converted to percentage sequence
differ-ence,
with
the
assumptionthat the
approxima-tion
of
5I.D.
unitsequals
1% sequencediffer-ence as
determined
for a variety ofother
pro-teins (15, 36) was
valid
inthese
comparisons. [image:8.499.60.254.87.332.2]The
results of these comparisons are shown inTable 2. Although each of the
p30's
could bedistinguished, the estimated degree
ofsequencerelatedness was >95% in each comparison. For
comparative purposes,
Table
2includes data
obtained with
the above sera and non-MuLVp30's.
NoC'
fixation wasobtained
inthese
assays at
I.D. values
of > 130,thus
attesting tothe close relationship
ofthe MuLVp30's.
Molecular size. We have
previously
notedvariability (±
15%) inthe
molecular weight of
the p30 homologues in viruses isolated fromdifferent
species. The resolving power ofthe
SDS
gel
system employed issuch that these
differences are clearly resolved in
co-electro-phoresis
experiments. Figure 7A, for example,shows
anexample
of resolution of MuLV,FeLV(Theilen),
and RD 114 homologues. That these arehomologues
isclearly indicated
by
sequence homology (-80%) as previously reported (30),and
by the
presence of across-reactive determi-nantdetected
in several immunoassays (28, 29,33). In contrast to
the ability
to distinguishbetween species, all MuLV
p30's
in spite ofdifferences in isoelectric points co-migrate in
such
gels;
thus significant variations in size (>5%) are unlikely. This is illustrated in Fig. 7Bwhere
co-electrophoresis of R-MuLVp30 (pl
6.7)and WMLV
p30
(pI 7.1) isshown. Similar results were obtained for all mouse virusesstudied
when
p30's
exhibiting differentisoelec-tric
points ofthe
same virus strain weresub-jected
toco-electrophoresis. Therefore, the
ob-served isoelectric
heterogeneity
isalso
notdue
tosubstantial variation in molecular size.
End-group
analysis. All the mouse virusp30's purified by
isoelectric focusing (majorcomponent), or
by
GuHCl-agarose
chromatog-raphy have
proline as the N-terminal residue andleucine
asthe
carboxyl
terminal residue.An intrastrain comparison of
p30's
withdiffer-entisoelectric points
also showed
proline at theN-terminal,
and preliminary experimentsindi-cated leucine
ascarboxyl
terminal; thus, inspite
of thecharge heterogeneity,
p30
proteinmolecules
appear tobe homogeneous
by
termi-nal amino acid atermi-nalysis.Amino
acid
composition.
Amino acidcom-1566 J.VIROL.
on November 10, 2019 by guest
http://jvi.asm.org/
MURINE TYPE-C VIRUSGROUP-SPECIFIC ANTIGENS
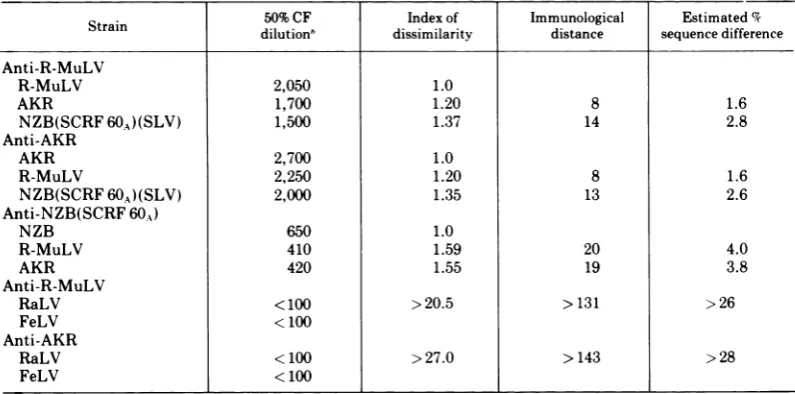
TABLE 2. Immunological relationships among p30's from several MuLV strainsa
Strain 50%CF Index of Immunological Estimated%
dilution" dissimilarity distance sequence difference Anti-R-MuLV
R-MuLV 2,050 1.0
AKR 1,700 1.20 8 1.6
NZB(SCRF60A)(SLV) 1,500 1.37 14 2.8
Anti-AKR
AKR 2,700 1.0
R-MuLV 2,250 1.20 8 1.6
NZB(SCRF60A)(SLV) 2,000 1.35 13 2.6
Anti-NZB(SCRF 60A)
NZB 650 1.0
R-MuLV 410 1.59 20 4.0
AKR 420 1.55 19 3.8
Anti-R-MuLV
RaLV < 100 >20.5 >131 >26
FeLV < 100
Anti-AKR
RaLV <100 >27.0 >143 >28
FeLV < 100
aThe majorisoelectric component of
p30's
wasusedinallcases. For R-MuLV AKR andNZBseeTable 1,column 4;FeLVp30, pl 8.3; RaLV p30, pl8.6.
hDetermined from a plot of percentage fixation at the peakofeach curve versus the
log,0
oftheserum dilution giving thatcurve. Atleastfour serumdilutionsinthe range20 to 80% maximal fixationwereusedto generate eachplot.positional
data ofp30's
ofseveral mouse virusstrains
are given inTable
3.A
gross examina-tion ofthe
number
ofindividual residues
permolecule indicates
a verysimilar
aminoacid
composition.
All
arerich
in residueswith polar
side
chains,
e.g., arginine, lysine, asparticacid,
and
glutamic
acid
(ortheir amides), and
poor incysteine,
methionine,
histidine, and isoleucine.
Amino
acid sequence analyses. We
previ-ously reported that the amino terminal
15residues
ofAKR and R-MuLV
wereidentical
(30).
We
have
nowextended this
analysis
toWMLV
and NZBSCRF6OA and M-MSV
p30's.
The results
(Table
4)indicate that whereas
R-MuLV and AKR
containleucine
inposition
4, WMLV contains serine,
the other
twostrainscontain
alanine
atthis position, and
complete
homology
ismaintained
atother residues
up toposition 20 or
higher. Position
4 appears tobe
hypervariable
since, inp30's
fromFeLV, RD
114,RaLV,
and Gibbon
apetype-C
viruses,dissimilar residues
arefound
(S.
Oroszlan,
T.Copeland,
M. R.Summers, G. W. Smythers,
andR.
V.Gilden,
J.Biol.
Chem., submitted
forpublication).
Inconsidering
minimalnumber
ofbase changes
involved inchanges
atMuLVp30
residue
4, we notethat Leu-Ala
andAla-Ser
require
only
asingle change,
whereasLeu-Ser
requires two
base
changes. This
mayhave
implications
fortheorigin
ofthe various strainsalthough conclusions based
on oneposition
inone protein areunwarranted.
Peptide
maps.Tryptic digests and peptide
maps of
several
p30's
have
beenprepared.
Without
exception, the maps show from 35 to 41ninhydrin-positive
spots, a number in closeagreement
with
trypticcleavage
ofapproxi-mately
87% ofthe susceptible
bondsbased
onamino
acid analysis, indicating the high
purityof
the
inputmaterial.
Of these
35 to 41 spots,about three-fifths consistently
givemuch
deeper ninhydrin coloration than the
rest,which
are welldefinedbut
faint. Apparentlythe
color
yield
of certainpeptides
(even present inequivalent
amounts) ismuch less
onthe
chro-matographic plate. The
range ofcoloration
ofthe
spots varies fromblue violet
through
greento
brown and yellow. The yellow
peptide
mi-grates identically in all of
the
maps andhas
been identified
asthe
aminoterminal
tripeptide
by
co-migrationwith
synthetic
prolylleucylargi-nine.
Unfortunately,
these lightly shaded
pep-tides do
notphotograph
well and
areonly
faintly
visible
inthe
figures shown here.
In a fewinstances,
the
photographic reproductions
donot disclose the fine
shading -differences
be-tween
closely migrating
peptides,
andthus
give
the
appearance of asingle
spot. Thestaining
intensity
ofobviously
identicalpeptides
occa-sionally shows
some variationfrommaptomap inboth
duplicate
andhomologous protein
runs.An examination of
these
maps discloses thestriking
homology
amongthe
p30's
isolated
from different strains of murine
leukemia-sar-1567 VOL.14,1974
on November 10, 2019 by guest
http://jvi.asm.org/
[image:9.499.48.446.92.289.2]OROSZLANET AL.
A
2
B
1
2
3
3
4
I
pp
rI
r
f
I
II
t i
k
iI
I
.6
..
A
l-FIG. 7. Co-electrophoresis in SDS polyacrylamide gels ofelectrofocus-purifiedmurine and feline gs antigens. (A) 1.R-MuLV + RD114 + FeLV(Theilen).2. R-MuLV(mol wt 31,000). 3. RD114(mol wt 29,000). 4. FeLv (molwt27,000). (B) 1. WMLV. 2.R-MuLV. 3. WMLV+ R-MuLV. Weoriginally reported (29) a molecular weight of 33,500 for themajor gs antigen of RD 114, thus havingalarger size than themouseprotein. This has beenconfirmed by co-electrophoresis withmouseprotein. Aftermany passages of the cell line foraperiod of morethanayear,wenowconsistently findamolecularweightof 29,000 for RD 114, without apparent change in the isoelectricpoint. The significance of this is unknownatpresent.
I
,:
OW46010i
i
I
iI
J. VIROL. 1568
--mm-WINJIMMM
I.
i
i
.t
41
.. -.6
L
on November 10, 2019 by guest
http://jvi.asm.org/
[image:10.499.124.395.82.578.2]MURINETYPE-CVIRUS GROUP-SPECIFIC ANTIGENS
coma viruses. In fact, there are only four or five
differences
per map at most. Assumingthat
these
peptides differ by a single amino acidsubstitution,
this indicates a sequencehomol-ogy of approximately 98% (5 out of250 total), in
TABLE 3. Amino acid composition ofmouse
leukemia-sarcoma virus major group-specific antigens (p30)a
No. of residues/moleh Aminoacid
R-MuLV' AKRd WMLV" MSVd
Lysine .... 15 16 16 16
Histidine 4 3 3 4
Arginine.29 27 27 25
Aspartic acid .... 31 28 30 30
Threoninee ... 14 16 14 16
Serinee .12 12 13 13
Glutamic acid 44 48 47 48
Proline .19 18 19 17
Glycine.17 17 17 17
Alanine .13 14 14 16
Halfcystinet 1 1 1 1
Valine .8 9 8 9
Methionineg 2 2 2 2
Isoleucine .7 5 7 7
Leucine ... 32 33 33 30
Tyrosine ... 7 7 7 7
Phenylalanine 6 6 6 6
aPurified by
GuHCI-agarose
chromatography.'Amolecularweightof30,000wasused for calcula-tion.
Basedon a single complete analysis. Acomplete analysis included samples of 24, 48, and 72 h of hydrolysis, and a performic acid oxidized sample hydrolyzed for24h.
dBasedon a duplicate complete analysis.
Correctedforhydrolyticlossesby extrapolationto zerotime.
IDetermined as cysteic acid. Preliminary
experi-mentsby cleavage with SH specific reagent TNB-CN indicate that there may be two cysteines per mole (Oroszlan and Copeland, unpublished observations)
,9Determined as methionine-sulfone.
close agreement with the homology calculated
from quantitative serological
analysis.
Peptide maps of the p30's obtained from
AKR, WMLV, and M-MSV, purified by gel
filtration through a guanidine chloride-agarose
column, are shown in Fig. 8. Each of the
purified proteins can be seen to generate an
easily identifiable and unique pattern of
pep-tides in spite of the predominanthomology. For
example, peptide A appears in both AKR and
WMLV (also in R-MuLV, Fig. 9), andneverin
M-MSV. It is alwaysmore intensely stained in
the AKR mapsthan in those fromWMLV. On
the other hand, peptide B is never present in
AKR but is always seen in the maps of other
strains shown in Fig. 8, as well as Fig.
9,
including the map for R-MuLV. Peptide C is
present on maps from AKR, WMLV, and
R-MuLV(Fig. 9), but is eithermissing in M-MSV
or altered to give peptide D with significantly
slower migration in thechromatographic
direc-tion. This type of alteration could result from
substitution of a more polar for a less polar
group, i.e., serine for alanine (this type of
re-placement can be seen at position 4 of
N-ter-minal amino acid sequence for example), or
valine for isoleucine. Peptide E is seen only in
WMLVmaps. M-MSVmapsinvariably contain
peptide F which was not seen elsewhere. The
pattern of thegroupofpeptides in the lower left
region ofthe M-MSV and WMLVmaps(Fig. 8)
andR-MuLV(Fig. 9) is quite similarexceptfor
the presence of peptide G in M-MSV and its
absence from the others. Thisregion is different
forAKR. In all ofthesemaps, afaintly staining
yellow spot wasinvariably seen. Knowing that
ninhydrin gives ayellow colored reaction with
proline and with peptidescontaining an
N-ter-minal proline, it was assumed that this spot
might be the p30 N-terminaltripeptide,
leucylarginine. To verify this, synthetic prolyl-leucylarginylglutamylglycine (prepared by S.
Sallay of Purdue University) was cleaved with
TABLE 4. Amino acid sequence differences in the N-terminal region of murinep30'sa
Position Virus
1 5 10 15 20
R-MuLV P L R L G G N G Q L Q Y W P F S S S D L Y N W K
AKR P L R L G G N G Q L Q Y W P F S S S D L
WMLV P L R S G G N G Q L Q Y W P F S S S D LY N W K
NZB P L R A G G N G Q L Q Y W P F S S S D LY N W K
M-MSV P L R A G G N G Q L Q Y W P F S S S D LY N W K
aThedetailedquantitativedata of amino acidsequenceanalyseswillbepublishedin aseparatepublication
(Oroszlan etal., Biochemistry, submitted for publication). The one letter code used for amino acids is: A,
alanine; D, aspartic acid; F, phenylalanine; G, glycine; K, lysine; L, leucine; N, asparagine;P, proline; Q, glutamine; R, arginine; S, serine; W, tryptophan; Y, tyrosine.
VOL.14,1974
1569
on November 10, 2019 by guest
http://jvi.asm.org/
[image:11.499.45.240.145.380.2] [image:11.499.48.448.537.623.2]OROSZLAN ET AL.
not
been overspotted with the
pentapeptide
digest, showing that
peptide I
mustbe
prolyl-leucylarginine.
Figure
9shows
acomparison of three
mousevirus
(AKR,
WMLV, and
R-MuLV)
p30
anti-gens
purified
by isoelectric
focusing. The
map forAKR
isnearly identical
tothat shown in
Fig.
8.With the exception
of asingle
spot(J)
onthe
AKR
map(appearing
approximately
inthe
center of
the
pattern), all
ofthe well resolved
peptides
seenhere
arealso
seen inFig.
8.The
major
difference
amongthe
mapsonisoelectric-i ,. *
6
Wv L
*
AT
M-MSV
Da *
G lb t
40
A
*--.s* _f
A B
0
yE
a9
FIG. 8.Comparative peptidemaps(Machery-Nagel Cel 300-10layer) ofthep30's fromAKR, WMLV,and M-MSV.Foreachmap, chromatography is the hori-zontal dimension and electrophoresis is the vertical dimension(withthe cathodeatthetop).Theorigin of each map is in the lowerleft corner.Protein input
varied from 4.2 nmol for AKR and 3.4 nmol for WMLVto2.1nmolforM-MSV.Peptidesspecifically discussed inthetextaremarkedwithan arrowanda
letter.
trypsin, and the digest wasthen appliedatthe
originonplates which hadalready been charged
with an AKR or M-MSV tryptic digest. On
development,
these two plates were found to contain onlyone newspot, peptideH.Thiswasidentified as the dipeptide
glutamylglycine.
Theyellowspotonthesetwoplateswas
consid-erably more intense than on plates which had
B'LV
F.)I
r.,.sAt
(fIA_
%K 4,
0 40~~
a
FIG. 9. Comparative peptide maps
(Machery-Nagel Cel 300-10 layer) of isoelectric-focused p30's from AKR, WMLV, and R-MuLV. Electrophoresis andchromatography are identical toFig.8.Protein inputis3.2nmol(AKR),3.4 nmol(WMLV), and 4.0 nmol(R-MuLV).RLV= R-MuLV.
I.I
0
0
t
t PCa *~ O
A _
I*
01570 J.VIROL.
40
4a- tk0
on November 10, 2019 by guest
http://jvi.asm.org/
[image:12.499.65.248.84.472.2] [image:12.499.269.449.207.596.2]MURINE TYPE-C VIRUS GROUP-SPECIFIC ANTIGENS
focused protein and
guanidine
chloride-agarose-purified
protein of AKR isthe spot appearing inthe lower right hand
corner of the maps. The position and intensity of these peptides washighly variable in duplicate runs and so we
chose
not toinclude them in the discussion. ForWMLV the
p30
gaveidentical maps regardlessofthe method ofpreparation.
The uniformity of the overall pattern of
peptides given
by
thep30
isolated fromdiffer-ent mouse strains is further emphasized by a
comparison of
the R-MuLV
mapshown
in Fig. 9to
those already discussed.
Peptide K appearsto
be
specific forthis
strain.Some of the
peptide
maps were run onglass
plates
coatedwith microcrystalline
celluloseinstead
of aMacherey-Nagel layer. In general,
the separation and resolution
ofpeptides
onthe
latter
is superior tothat
onthe
microcrystallineplates. Figure 10 shows two AKR
p30
mapswhich
were run onmicrocrystalline
plates. Inspite of
the
poorerresolution, the
pattern isstill
recognizable
as onebelonging
toAKRbased
onthe absence
ofpeptide B.
In Fig. 10, maps ofAKR
p30
componentswith
different isoelectricpoints are
compared. That the observed
isoelec-tric
heterogeneity
is notdue
to agrossalteration
inthe primary
sequence isevident
fromthese
two maps.
DISCUSSION
The data
presented
inthis
paperclearly
indicate
that the
p30
ofseveral MuLV
strains canbe
distinguished
in atype-specific
mannerby
appropriateimmunochemical and
biophysi-cal
procedures.
Inaddition, the primary
struc-tureanalyses, i.e.,
peptide mapping and
aminoacid
sequencedetermination, fully
supportthese
findings and provide unequivocal
evi-dence
forthe
existence oftype-specific chemical
differences.
It should
be
emphasized that the
biophysical
data alone
areinsufficient
todetermine the
strain
classification
of aparticular
mousetype-C
virus.The
p30's
ofseveral MuLV
strainsappear to
be
indistinguishable by
molecular
size, and
noevidence
ofsignificant
change
inthe number
ofresidues
wasfound
by
aminoacid
analysis. Some
of thep30's
haveidentical
isoelectric points
(major forms,
e.g.,R-MuLV
and
AKR, NZB,
AT124,and
RadLV).
The major
p30
components of the variousstrains,
although appearing
identicalby
immu-nodiffusion,
canbe
distinguished by
radioim-muno-competition
assays aspreviously
de-scribed
(40),
by
quantitative C'F
tests asshownhere, and also
by
finestructuralanalysis.
Liter-ature
data
suggestthat identity reactions in gel
diffusion
maybe obtained with
proteinsshow-ing >80% sequence
homology (36).
Immunolog-ical
changes induced by small
variations inthe primary structure of related proteins, includingsingle residue
substitutions, have
been
previ-ously
observed
in severalother
cases (7, 24)using sensitive
serological
techniques.
A singleamino
acid substitution
maycontribute
tosero-logical specificity
by directly
reacting with theantibody (thus being
an intrinsic part of anantigenic
determinant)
orby influencing the
structure of an
antigenic
determinant
notin-cluding this
aminoacid.
Considering
the intrastrain
heterogeneity,
itshould be noted that the pI
6.2formappears inmany different strains;
however, this
clearlydoes
not representcontribution
from a viruscommon to
all preparations,
sincepeptide
mapsshow
virtual identity between pl
6.2 and 6.7proteins of AKR,
both
quite distinct from thep30
protein ofM-MSV where the
maincompo-nent has a pI of 6.2. No
serological difference
between the
variousmolecular forms within
astrain was
found
by immunodiffusion, but the
assumption
ofcomplete identity made
fromgel
diffusion
analyses alone would
notbe
appropri-ate
for
the
same reasons asstated above. More
thorough immunochemical and primary
struc-tureanalyses,
asdone
forthe
major isoelectric
forms,
will be needed
todetermine
the
exactreason for
the observed heterogeneity;
however,
this could result
fromdegradation
ormodifica-tion of
the proteins
during isolation,
orthe
multiple
formscould
occurnaturally. It
isunlikely that proteolytic
digestion during
isola-tion causes
the
heterogeneity
sincethe
variousmolecular
formshave
identical size andboth
N-terminal and
carboxyl-terminal
amino acidsremain
the
same.Isoelectric
heterogeneity
of mouse gsproteins
have
been
reported previously (6,
14); inthese
cases it was
attributed
to RNA ornucleotide
binding.
Thepossibility that the
binding
ofRNA
oritsacidic
degradation
products
tothe
gsantigen
molecules
was amajor
factorcausing
the
interstrainpI differences
andthe
intrastraincharge heterogeneity
under ourexperimental
conditions
has
been ruledoutby
studiesutiliz-ing [3
Hluridine-labeled
virusesand,
moreef-fectively,
by electrofocusing
viralproteinprepa-ration from which acidic
polynucleotides
havebeen
completely
removed. Itappearsthat
lipid
binding
does not have a roleeither,
since inseparate
experiments
employing
hydroxyapa-tite
chromatography
in the presence ofSDS
(22), a
similar
degree
ofheterogeneity
wasVOL.14, 1974 1571
on November 10, 2019 by guest
http://jvi.asm.org/
AKR
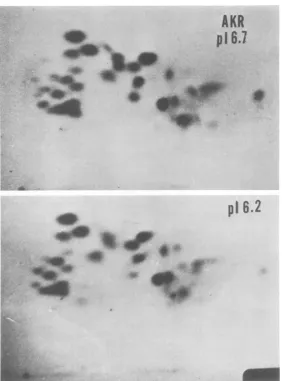
OROSZLAN ET AL.
4II
At
p16.7
_
*
p16.2
FIG. 10.
Comparative
peptide maps (microcrystallinecellulose layer) of pI6.7andpI6.2p30
from AKR.Electrophoresisand
chromatography
areidenticaltoFig.8.Proteininputsare4.6nmolfor pI6.7and5.0nmolfor pI6.2.
observed with R-MuLV
and WMLV proteins(Oroszlan,
unpublished observations). The
per-sistenceof
micro-heterogeneity
ofp30
moleculesin
the
presence ofureasuggeststhat
there maybe
a primary structuralbasis
(either
syntheticor
post-synthetic)
forthe
charge differences. Inaddition
to thechanges
in the amino acidsequence
itself, examples
ofother chemical
modifications, not
genetically determined,
canbe
mentioned:phosphorylation
of serineresi-dues
by
the viral enzyme protein kinase (16,41);
dephosphorylation by phosphatases, the
presenceof
glycosidic linkages
ordeaminidation
processes,etc.
The results
ofourimmunochemical
andpri-mary structure analyses on the major
p30's
show minimal
variation-perhaps
1 to2%
max-imum sequence
difference-with
noevidence
ofsignificant change
inthe number
of residues.This is a
much
closerrelationship than
indi-cated
forthe
entireviral genome inferred frommolecular
hybridization
experiments (3, 17).The present results indicate the need and
possi-ble
reward ofsimilar
analyses
ofthe
p30
frommultiple
virusesobtained
from individualin-bred
mousestrains, some ofwhich
now appear tobe
separable by
genetic and host rangemanipulation
(1, 37).Comparison
of gs antigendetected
inembryonic
tissues with virion gsantigens,
especially
that of thexenotropic
vi-ruses,
also
now seem necessary to specifythe
origin of
the
embryonic
antigens. This may have1572 J.VIROL.
on November 10, 2019 by guest
http://jvi.asm.org/
[image:14.499.121.404.67.449.2]MURINE TYPE-C VIRUSGROUP-SPECIFIC ANTIGENS
relevance to the concept of tolerance based on
presence of gs antigen in chicken and mouse
embryos. Breaking of tolerance by related
anti-gens is a
well-known phenomenon (5, 48),and
thus
the
gsantibody induced
inchickens
byhyperimmunization
mayresult
fromdifferences
inthe exogenous virus gs compared to the gs of
the endogenous inherited viral genome.
ACKNOWLEDGMENTS
This work was supported by Public Health Service Contract NO1-CP-3-3247 with the Virus Cancer Program of the National Cancer Institute.
We wish to thank D. Bova, T. Copeland, M. Hanson, L. Masters, G. Symthers, and R. Toni for excellent technical assistance.
LITERATURE CITED
1. Aaronson,S. A., and J. R. Stephenson. 1973. Independ-ent segregation of loci for activation of biologically distinguishable RNA C-type viruses in mouse cells. Proc. Nat.Acad.Sci.U.S.A. 70:2055-2058.
2. Ambler, R. P. 1972. Carboxypeptidase A and B, p. 262-281. InC. H. W. Hirs andS. N. Timasheff (ed.), Methods in enzymology, enzyme structure, vol. 25. Academic Press Inc., New York.
3. Benveniste, R. E., and G. J. Todaro. 1973. Homology between Type C viruses of various species as deter-mined by molecular hybridization. Proc. Nat. Acad. Sci.U.S.A. 70:3316-3320.
4. Bernard, C. M. Boiron, and J. Lasneret. 1967. Transfor-mation et infection chronique de cellules embryon-naires de rat par le virus du sarcome deMoloney. C. R. Acad.Sci.264:2120-2133.
5. Chiller, J.M., and W.0. Weigle. 1973.Termination of tolerance tohuman gammaglobulininmiceby antigen andbacteriallipopolysaccharide (Endotoxin).J.Exp. Med. 137:740-750.
6. Chuat,J.C.,C.Bernard,I.Laprevotte,C.Seban,and M. Boiron. 1973.Studieson mousesarcomavirus.IV. The isoelectric pointofthegroup-specific antigen. Int. J. Cancer 12:742-751.
7. Cocks, G. T., and A. C. Wilson. 1969.Immunological detection ofsingleaminoacidsubstitutionsinalkaline phosphatase.Science 164:188-189.
8. Crowle,A.J. 1961.Immunodiffusion, p. 302.Academic PressInc., New York.
9. Davis,J.,R. V.Gilden,andS.Oroszlan. 1973. Isolation of an immunogenic polypeptide after limited trypsin hydrolysis of murine leukemia virus group-specific antigen.Virology56:411-415.
10. Fairbanks,G.,T. L.Steck,and D. F. H. Wallach. 1971.
Electrophoretic analysisofthemajorpolypeptides of
the human erythrocyte membrane. Biochemistry 10:2606-2617.
11. Fish, W.W.,J. A.Reynolds, andC.Tanford. 1970.Gel chromatography of proteins in denaturing solvents. Comparison betweensodiumdodecylsulfate and gua-nidine hydrochloride as denaturants. J. Biol. Chem. 245:5166-5168.
12. Fleissner, E.1971.Chromatographicseparation and
anti-genic analysis of proteins of the oncornaviruses. I. Avian leukemia-sarcomaviruses. J.Virol.8:778-785. 13. Gilden, R. V., S. Oroszlan, andR. J. Huebner. 1971.
Co-existence ofintraspecies and interspeciesspecific antigenic determinants onthemajor structural poly-peptideofmammalianC-typeviruses.Nature N.Biol. 231:107-108.
14. Gregoriades, A., andL.J.Old. 1969.Isolation andsome
characteristicsof agroup-specific antigen ofthe murine leukemia viruses. Virology 37:189-202.
15. Hanke, N., E. M. Prager, and A. C. Wilson. 1973. Quantitative immunological and electrophoretic com-parison of primate lysozymes. J. Biol. Chem. 248:2824-2828.
16. Hatanaka, M., E. Twiddy, and R. V. Gilden. 1972. Protein kinaseassociated with RNA tumor viruses and other budding RNA viruses. Virology47:536-538. 17. Huebner, R. J.,G. J. Kelloff, P. S. Sarma, W. T. Lane, H.
C.Turner,R. V.Gilden, S. Oroszlan, H. Meier, D. D. Myers, and R. L. Peters. 1970.Group-specific antigen expressionduringembryogenesisofthe genome ofthe C-type RNA tumor virus: implications for ontogenesis and oncogenesis. Proc. Nat. Acad. Sci. U.S.A. 67:366-376.
18. Lerner,R. A., F.Jensen,S. J. Kennel, F. J. Dixon, G. Des Roches, and U. Francke. 1972. Karyotypic, virologic, andimmunologicanalyses of two continuous lympho-cyte linesestablished from New Zealand black mice: possible relationship of chromosomal mosaicism to autoimmunity. Proc. Nat. Acad. Sci. U.S.A. 69:2965-2969.
19. Lieberman, M., andH.S.Kaplan. 1959. Leukemogenic activity of filtrates from radiation inducedlymphoid tumorsof mice.Science 130:387.
20. Lowry, 0. H., N.J.Rosebrough, A. L. Farr, and R. J. Randall. 1951. Protein measurementwith the Folin phenol reagent. J. Biol.Chem. 193:265-275. 21. McAllister, R. M., M.Nicolson, M. B. Gardner, R. W.
Rongey,S.Rasheed,P. S.Sarma,R. J.Huebner, M. Hatanaka, S. Oroszlan, R. V. Gilden, A. Kabigting, and L. Vernon. 1972. C-type virus released from cultured human rhabdomyosarcomacells. Nature N. Biol. 235:3-6.
22. Moss, B.,and E. N. Rosenblum. 1972. Hydroxylapatite chromatography of protein-sodium dodecyl sulfate complexes.A newmethodfor theseparation of poly-peptide subunits. J. Biol.Chem.247:5194-5198. 23. Narita, K. 1970. Endgroup determination, p. 25-90. In
S.B. Needleman(ed.),Protein sequence determination. Springer-Verlag,Berlin.
24. Nisonoff, A., M. Reichlin, and E. Margoliash. 1970. Immunological activity ofcytochrome c. II. Localiza-tion of amajor antigenicdeterminantofhuman cyto-chrome c. J. Biol. Chem.245:940-946.
25. Nowinski,R.C.,E.Fleissner,R. H.Sarkar,and T. Aoki. 1972. Chromatographicseparationand antigenic anal-ysis of proteins of the oncomaviruses. J. Virol. 9:359-366.
26. Officer, J. E., N. Tecson, J. D.Estes,E. Fontanilla, R. W.Rongey, and M. B. Gardner. 1973. Isolation of a neurotropicType C virus. Science 181:945-947.
27. Okabe, H., R. V. Gilden, and M. Hatanaka. 1973. Specificity of the DNA product of RNA-dependent DNApolymerase inType C viruses.II. Quantitative analysis.Proc. Nat.Acad. Sci. U.S.A. 70:3923-3927. 28. Oroszlan, S.,D. Bova,R. J.Huebner,and R. V. Gilden.
1972.Majorgroup-specific proteinofrattypeC viruses. J. Virol. 10:746-750.
29. Oroszlan, S., D. Bova, M. H. M. White, R. Toni, C. Foreman, and R. V. Gilden. 1972. Purification and immunological characterization ofthemajor internal protein of the RD-114 virus. Proc. Nat. Acad. Sci. U.S.A. 69:1211-1215.
30. Oroszlan, S., T. Copeland, M. R. Summers, and R. V. Gilden.1973.Felineleukemia and RD-114virus group-specific proteins: comparison of amino terminal
se-quence. Science 181:454-456.
31. Oroszlan, S., C. L. Fisher, T. B. Stanley, and R. V.
Gilden. 1970. Proteins of the murine C-type RNA
tumourviruses:isolation ofagroup-specificantigenby 1573 VOL.14,1974
on November 10, 2019 by guest
http://jvi.asm.org/
OROSZLAN ET AL. isoelectric focusing. J. Gen. Virol. 8:1-10.
32. Oroszlan, S., C.Foreman, G.Kelloff,and R. V.Gilden. 1971.The group-specific antigen and other structural properties of hamster and mouse Type C viruses. Virology 43:665-674.
33. Oroszlan, S., R. J. Huebner, and R. V. Gilden. 1971. Species-specific and interspecific antigenic determi-nantsassociated with the structural protein of feline TypeC virus. Proc. Nat. Acad. Sci. U.S.A. 68:901-904. 34. Parks, W. P., D. M. Livingston, G. J. Todaro, R. E. Benveniste, and E. M. Scolnick. 1973. Radioim-munoassay of mammalian Type C viral proteins. III. Detection of viral antigen in normal murine cells and tissues.J. Exp. Med. 137:622-635.
35. Parks, W. P., and E. M. Scolnick. 1972. Radioimmunoas-say of mammalianType C viral proteins:interspecies antigenic reactivities of the major internal polypeptide. Proc. Nat.Acad. Sci. U.S.A.69:1766-1770.
36.Prager, E.M.,andA.C.Wilson. 1971.Thedependence of immunological cross-reactivity upon sequence resem-blanceamonglysozymes. II.Comparisonofprecipitin andmicrocomplementfixation results. J. Biol. Chem. 246:7010-7017.
37. Rowe, W. P., J. W. Hartley, and T. Bremner. 1972. Geneticmapping of a murineleukemia virus-inducing locus of AKR mice.Science178:860-862.
38. Salaman,M. R., and A.R. Williamson. 1971. Isoelectric focusing of proteins in the native and denatured states. Anomalousbehaviorofplasma albumin.Biochem. J. 122:93-99.
39 Schaffner,W., and C. Weissmann. 1973. A rapid, sensi-tive, and specific method for the determination of protein indilute solution. Anal. Biochem. 56:502-514. 40. Strand,M., and J. T. August. 1974. Structural proteinsof
mammalian oncogenic RNA viruses: multiple anti-genicdeterminants of the major internal protein and envelopeglycoprotein.J. Virol. 13:171-180.
41. Strand, M., and J. T. August. 1971. A protein kinase and substrate proteins of Rauscherleukemiavirus. Nature
N. Biol. 233:137-140.
42.Theilen,G. H.,T.G.Kawakami,J. D.Rush,and R. J. Munn. 1969.Replicationofcatleukemiavirus incell suspensioncultures. Nature(London)222:589-590. 43. Ting,R.C. 1968.Biologicalandserological propertiesof
viral particles from a nonproducer rat neoplasm in-duced by murinesarcomavirus (Moloney). J. Virol. 2:865-868.
44. Todaro, G. J., P. Arnstein, W. P. Parks, E. H. Lennette, and R. J. Huebner. 1973. ATypeC virus in human rhabdomyosarcoma cells after inoculation into NIH Swiss mice treated with antithymocyte serum. Proc. Nat. Acad. Sci.U.S.A. 70:859-862.
45. Vesterberg, O., and H.Svensson. 1966. Isoelectric frac-tionation, analysis, and characterization ofampholytes in natural pH gradients. IV. Further studies onthe resolvingpower in connectionwith separation of myo-globins.ActaChem. Scand. 20:820-834.
46. Weber, K., and D. J. Kuter. 1971.Reversible denatura-tion of enzymes by sodium dodecyl sulfate. J. Biol. Chem. 246:4504-4509.
47. Weber, K., and M. Osborn. 1969. The reliability of
molecular weight determinations by dodecyl sulfate-polyacrylamide gel electrophoresis. J. Biol. Chem. 244:4406-4412.
48. Weigle, W. 0. 1961. The immune response of rabbits tolerant to bovine serum albumin to the injection of other heterologous serum albumins. J. Exp. Med. 114:111-125.
49. Weiner, A. M., T. Platt, and K. Weber. 1972. Amino-ter-minal sequence analysis of proteins purified on a
nanomole scaleby gel electrophoresis. J. Biol. Chem. 247:3242-3251.
50. Wright, B. S., P. A. O'Brien, G. P. Shibley, S. A. Mayyasi, and J. C. Lasfargues. 1967. Infection of an established mouse bone marrow cell line (JLS-V9) with Rauscher andMoloney murine leukemia viruses.
Can-cerRes. 27:1672-1677.
1574 J.VIROL.