Judge :
Don’t Vote!
Michel Balinski and Rida Laraki
The final test of a theory is its capacity to solve the problems which originated it.
George B. Dantzig
Abstract
This article argues that the traditional model of the theory of social choice is not a good model and does not lead to acceptable methods of ranking and electing. It presents a more meaningful and realistic model that leads naturally to a method of ranking and electing—majority judg-ment—that better meets the traditional criteria of what constitutes a good method. It gives descriptions of its successful use in several dif-ferent practical situations and compares it with other methods including Condorcet’s, Borda’s, first-past-the-post, and approval voting.
Key words:
Methods of electing and ranking, Condorcet and Arrow paradoxes, strategic manipulation, faithful representation, meaningful measurement, figure skating, presidential elections, jury decision.
1
Why?
George Dantzig’s limpid, opening phrase of the Preface of his classic work on linear programming and extensions [20] is worth repeating over and over again, for it is far too often forgotten. By his final test, the theory of voting has failed. Despite insightful concepts, fascinating analyses, and surprising theorems, its most famous results are for the most part negative: paradoxes leading to im-possibility and incompatibility theorems. We argue that the theory has yielded no really decent methods for practical use and that this is due, in essence, to how voting has been viewed.
Since 1299 (and perhaps before) voting has been modeled in terms of com-paring the relative merits of candidates. In this conception voters are assumed to rank-order the candidates (the inputs) and the problem is to amalgamate these so-called preferences into the rank-order of society (the output).
Viewed through one lens this change of paradigm is small: a vote on the candidates themselves is replaced by votes on the final grade to be given each candidate. Viewed through another lens the change looms large: the basic meaning of “majority” is interpreted and practiced differently bringing with it very important theoretical and practical consequences. Significantly, by asking more of voters—permitting much more accurate expressions of their opinions— it places greater confidence in them.
1.1
Why
Don’t Vote!
in Theory
Rank-order inputs lead to two unsurmountable paradoxes that plague practice, and so theory. (1)Condorcet’s paradox: In the presence of at least three can-didates,A,B, andC, it is entirely possible that in head-to-head encounters,A defeatsB,B defeatsC, andC defeatsA, so transitivity fails and a Condorcet-cycle is produced, A ≻S B ≻S C ≻S A where X ≻S Y means society prefers X toY. (2)Arrow’s paradox: In the presence of at least three candidates, it is possible forA to win, yet with the same voting opinionsB defeats A when C withdraws.
These paradoxes are real. They occur in practice. Condorcet’s paradox was observed in a Danish election [36]. It has occurred in skating (see anon). It also occurred in the famous 1976 “Judgment of Paris” where eleven voters— well known wine experts—evaluated six Cabernet-Sauvignons of California and four of Bordeaux, and the “unthinkable” is supposed to have occurred: in the phrase ofTimemagazine “California defeated all Gaul.” In fact, by Condorcet’s majority principle, five wines—including three of the four French wines—all preferred to the other five wines by a majority, were in a Condorcet-cycle,A≈S B≻SC≈S D≻S E≻S A, whereX ≈S Y means society or the jury considers X and Y to be tied (see [8] section 7.8, [6]). Moreover, after having seen it happen in practice Charles Dodgson observed in 1876 that voting strategically rather than honestly to optimize the outcome is likely to provoke Condorcet-cycles [24] (confirmed by experiments, see [8] section 19.2).
Arrow’s paradox is seen frequently. Had Ralph Nader not been a candidate for the presidency in the 2000 election in Florida, it seems clear that most of his 97,488 votes would have gone to Albert Gore who had 537 votes less than George W. Bush, thus making Gore the winner in Florida and so the national winner with 291 Electoral College votes to Bush’s 246. Bill Clinton was the winner with 43% of the popular vote in 1992, George Bush and Ross Perot together polling 56%: the evidence suggests Bush would have won pitted against Clinton alone. And the same may be argued for the election of 1912: Woodrow Wilson would most likely have lost against either Thodore Roosevelt or Williams Taft alone (who together had over 50% of the votes).
oc-curred in ranking wines: the “winner” among the set of all ten wines of a competition is not the winner among subsets of them [6].
Behind these paradoxes lurk a host of impossibilities inherent to the tradi-tional model. A brief account is given of several of them. The model is this. Each voter’s input is a rank-order of the candidates. Their collective input is so-ciety’spreference-profile Φ. The output, society’s rank-order of the candidates, is determined by a rule of votingF that depends on Φ. It must satisfy certain basic demands. (1) Unlimited domain: Voters may input whatever rank-orders they wish. (2) Unanimity: When every voter inputs the same rank-order then society’s rank-order must be that rank-order. (3) Independence of irrelevant alternatives (IIA)1: Suppose that society’s rank-order over all candidates C is
F(ΦC) and that over a subset of the candidates, C′ ⊂ C, it is F(ΦC′
). Then the rank-order obtained fromF(ΦC) by dropping all candidates not inC′ must be F(ΦC′
). (4) Non-dictatorial: No one voter’s input can always determine society’s rank-order whatever the rank-orders of the others.
Arrow’s Impossibility Theorem[1]There is no rule of voting that satisfies the properties (1) to (4) (when there are at least three candidates).
Arrow’s theorem explicitly ignores the possibility that voters have strategies. It assumes voters’ “true” opinions may be expressed as rank-orders and that they are their inputs, not some other inputs chosen strategically to maximize the outcome they wish. A rule of voting isstrategy-proof or incentive compat-ible when every voter’s best strategy is to announce his true preference-order; otherwise, the rule ismanipulable. Strategy-proof or incentive compatible rules are desirable for then the true preferences of the voters are amalgamated into a decision of society rather than some other set of strategically chosen preferences. Regrettably they do not exist.
However, the very formulation of the theorem that proves they do not ex-ist underlines a defect in the traditional model. In general, the output of a rule of voting is society’s rank-order. Voters usually “prefer” one rank-order to another, viz., the rank-order of the candidates is important to a voter, the rank-order of figure skaters in Olympic competitions is important to skaters, judges and the public at large. But voters and judges have no way of express-ing their preferences over rank-orders. In the spirit of the traditional approach they should be asked for their rank-orders of the rank-orders (for a more de-tailed discussion of this point see [8], sections 4.6 and 9.4). Be that as it may, when strategic choices are introduced in the context of the traditional approach something must be assumed about the preferences of the voters to be able to analyze their behavior. It is standard to assume that voters only care about who wins, i.e., voters’ utility functions depend only on who is elected. This is certainly not true for judges of competitions. This is also false for many voters2: why, otherwise, did so many US voters opt for Ralph Nader in the presidential election of 2000 in the knowledge that he could never be the winner, or why do
1
IIA has several different formulations that lead to the same conclusion (see [8], section 3.2). This is not Arrow’s original definition.
so many voters opt for minor candidates in all of France’s presidential elections knowing they can never win? Voters vote because they wish to send messages that express their opinions.
Each voter’s input is now a rank-order that is chosen strategically, so it may or may not correspond to her true “preferences.” A rule of voting is assumed to produce a winner only, and unanimous means that when all the voters place a candidate first on their lists then so does the rule.
Gibbard and Satterthwaite’s Impossibility Theorem [30, 45] There is no rule of voting that is unanimous, non-dictatorial and strategy-proof for all possible preference-profiles (when there are at least three candidates).
In analyzing carefully a proposal of Condorcet, Young noticed that there was a conflict between on one hand, a winner, and on the other hand, the first in an order-of-finish [52]. A third result shows that this conflict is inescapable in the context of the traditional approach. To explain it an additional concept must be invoked. When there aren candidates Ai (i = 1, . . . , n), a set of kn voters of a preference-profile having the preferences
k: A1 ≻ A2 ≻ · · · ≻ An−1 ≻ An
k: A2 ≻ A3 ≻ · · · ≻ An ≻ A1
..
. ... ... ... ... ... ... ... ... ... k: An ≻ A1 ≻ · · · ≻ An−2 ≻ An−1
(the first line meaning, for example, that k voters have the preference A1 ≻
A2 ≻ · · · ≻ An−1 ≻ An) is called a Condorcet-component. Each candidate
appears in each place of the orderk times. Given a preference-profile that is a Condorcet-component every candidate has the same claim to the first, the last or any other place in the order-of-finish: there is a vast tie among all candidates for every place.
The model is now this. Voters input rank-orders, a rule amalgamates them into society’s rank-order. The first-place candidate is the winner, the last-place candidate is the loser. The rule must enjoy three properties. (1) Winner-loser unanimous: Whenever all voters rank a candidate first (respectively, last) he must be the winner (the loser). (2) Choice-compatible: Whenever all voters rank a candidate first (respectively, last) and a Condorcet-component is added to the profile, that candidate must be the winner (the loser). (3) Rank-compatible: Whenever a loser is removed from the set of candidates, the new ranking of the remaining candidates must be the same as their original ranking (a weak IIA).
Winner/Ranking Incompatibility Theorem[4, 8]There is no rule of voting that is winner-loser unanimous, choice- and rank-compatible (when there are at least three candidates).
in first-place. Rank-compatibility is violated, but a method that guarantees it is satisfied implies one of the other two properties may not be met, which is unthinkable.
There is still another fundamental difficulty with the traditional model. Clearly, if a voter has a change of opinion and decides to move some candidate up in her ranking that candidate should not as a consequence end up lower in the final ranking: that is, the method of voting should be “choice-monotone.” Monotonicity is essential to any practically acceptable method: how can one accept the idea that when a candidate rises in the inputs he falls in the out-put? But there are various ways of formulating the underlying idea. Another is “rank-monotone”: if one or several voters move the winner up in their inputs, not only should he remain winner but the final ranking among the others should not change.
Monotonic Incompatibility Theorem[3]: There is no unanimous, impartial rule of voting that is both choice- and rank-monotone.3
Moreover, when some non-winner falls in the inputs of one or more voters no method of the traditional model can guarantee that the winner remains the winner (none is “strongly monotone” [41]). Why all of this happens is simple: moving some candidate up necessarily moves some candidate(s) down, though there may be no change of opinion regardingthem.
In short, these four theorems show, we believe, that there can be no good method of voting.
But OR is notonlytheorems and algorithms. It isalsoformulating adequate models. To begin, a problem must be understood as best as can be. Next, a model must be formulated that attempts to capture the essentials of the real situation. It must then be challenged by the gritty details of the real problem. Only then is it worthwhile to develop and explore the mathematical properties of the model. But this, in turn, can—invariably, will—lead to new understandings of the problem, to refinements and reformulations of the model, and so eventually to new probing conclusions. Indeed, OR that seeks to solve real problems consists of a sequence of repetitions of this process.
What is amazing about the theory of social choice is that the basic model has not changed over seven centuries. Comparing candidates has steadfastly remained the paradigm of voting. And yet, both common sense and practice show that voters and judges do not formulate their opinions as rank-orders. Rank-orders are grossly insufficient expressions of opinion, because a candidate who is second (or in any other place) of an input may be held in high esteem by one voter but in very low esteem by another.
Moreover, rank-ordering competitors is difficult to do. There is ample evi-dence for this. With the old rules for judging figure skaters, the inputs of judges were rank-orders of the performers, but the judges were not asked to submit rank-orders, for that is much too difficult. Instead, they were asked to give number grades, and their number grades were used to deduce their rank-orders.
3
Indeed, this is the routine in schools and universities where students’ grades are used to determine their standings. In the last three presidential elections held in France, there were respectively sixteen, twelve and ten candidates. Voters certainly did not rank-order the candidates. Instead, they rejected most, and chose one among several whom they held in some degree of esteem (possibly high, often rather low, though it was impossible for them to express such senti-ments). A voting experiment carried out in parallel with the 2007 presidential election showed that fully one-third of the voters did not have a single preferred candidate and that the merits of candidates ranked highest in a voter’s input, or ranked second highest in his input, etc., were seen to be quite different [8, 5]. Is it at all reasonable, then, to count the highest ranked (or the second highest ranked, etc.) candidate of two voters in the same way?
Thus the traditional approach to voting fails for two separate reasons.
• The model’s inputs are inadequate.
• The model’s implications exclude a satisfactory procedure.
The goal of this paper is to give a brief account of a new paradigm and model for a theory of social choice that (1) enables judges and voters to express their opinions naturally and much more accurately than rank-orders; and (2) escapes the traditional impossibilities just discussed. For a complete presentation of the theory, a detailed justification of its basic paradigm, and descriptions of its uses to date and of experiments that have been conducted to test it, see [8].
1.2
Why
Don’t Vote!
in Practice
Everything is ranked all of the time: architectural projects, beauty queens, cities, dogs, economists, figure skaters, graduates, hotels, investments, jour-nals, kung fu fighters, light heavyweight boxers, musicians, novelists, operations research analysts, . . . , and zoologists, not only candidates for offices. How? Usually by evaluating them in a common language of grades. That it is natu-ral to do so is evident since it is so often done—and shows the reason why a theory is needed to determine how the grades should be amalgamated. In most real competitions (other than elections) the order-of-finish of competitors is a function of number-grades attributed by judges. Usually the functions used to amalgamate judges’ grades are their sums, or equivalently, their averages. But this is not nor was always so—and it need not be so. The recent changes in the rules used in figure skating offer a particularly interesting case study.
Condorcet’s and Arrow’s Paradoxes
performed. The final order-of-finish placed him sixth, confirmed Urmanov’s first, but put Candeloro in second place and Zagorodniuk in third. The outcry over this flip-flop was so strident that the President of the International Skating Union (ISU) finally admitted something must be wrong with the rule in use and promised it would be fixed. Accordingly, the rules were changed. The ISU adopted the OBO rule (“one-by-one”) in 1998. It is explained via areal problem that dramatically shows the many difficulties that may be encountered with the traditional approach (for us this example is as important as a theorem).
Name J1 J2 J3 J4 J5 J6 J7 J8 J9 Avg.
T. Eldredge 11.3 11.6 11.3 11.4 11.4 11.7 11.4 11.2 11.5 11.42 C. Li 10.8 11.2+ 11.0 10.9 10.6 11.0 10.8 10.9 11.2 10.93
M. Savoie 11.1 10.8+
11.1 10.8+
10.5 10.8 10.6 10.5 11.1 10.81 T. Honda 10.3 11.2 10.9 11.0 10.8 10.9+
[image:7.612.133.486.236.307.2]10.4 10.3 10.7 10.72 M. Weiss 10.6 11.1 10.6 10.8 10.4 10.9 10.9 10.4 10.9 10.73 Y. Tamura 09.8 10.8 10.1 10.4 11.0 11.6 10.7 10.6 10.8 10.64
Table 1. Scores of competitors given by nine judges (performance plus technical marks).
The Four Continents Figure Skating Championships are annual competitions with skaters from all the continents save Europe (whence the “Four”). In 2001 they were held in Salt Lake City, Utah. The example discussed comes from the Men’s “Short Program.” There were twenty-two competitors and nine judges. The analysis is confined to the six leading finishers. It happens that doing so gives exactly the same order-of-finish among the six as is obtained with all twenty-two competitors (it ain’t necessarily so!). Every judge assigns to every competitor two grades, each ranging between 0 and 6, one “presentation mark” and one “technical mark.” Their sums determine each judge’s input. The data concerning the six skaters is given in table 1.
Contrary to public belief the sum or the average of the scores given a skater did not determine a skater’s standing. They were only used as a device to determine each judge’s rank-order of the competitors.
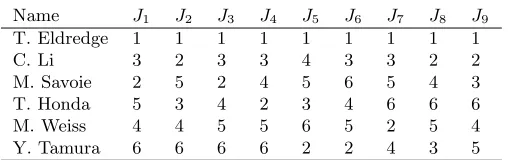
Name J1 J2 J3 J4 J5 J6 J7 J8 J9
T. Eldredge 1 1 1 1 1 1 1 1 1
C. Li 3 2 3 3 4 3 3 2 2
M. Savoie 2 5 2 4 5 6 5 4 3
T. Honda 5 3 4 2 3 4 6 6 6
M. Weiss 4 4 5 5 6 5 2 5 4
Y. Tamura 6 6 6 6 2 2 4 3 5
Table 2. Judges’ inputs (indicating rank-orders of the six competitors).
[image:7.612.180.434.505.585.2]of the competitors—their inputs to the OBO rule—are given in table 2. Thus, for example, judge J1 ranked Eldredge first, Savoie second, . . . , and Tamura
last.
To here, the new rule is identical to the old one (for details see [8]). The inno-vation was in how the judges’ inputs are amalgamated into a decision. The OBO system combines two of the oldest and best known voting rules, Llull’s—a gen-eralization of Condorcet’s known by some as Copeland’s [19]—and Cusanus’s— best known as Borda’s method. To use what we will call Llull’s and Borda’s rules, table 3 gives the numbers of judges that prefer one competitor to another for all pairs of competitors. Thus, for example, Savoie is ranked higher than Weiss by six judges, so ranked lower by three.
Condorcet was for declaring one competitor ahead of another if a majority of judges preferred him to the other. But, of course, his paradox may arise. It does in this example,
Honda≻SWeiss≻S Tamura≻S Honda.
A more general rule than Condorcet’s was proposed in 1299 by Ramon Llull [31]. Llull’s method: rank the competitors according to their numbers of wins plus ties.4 It is a more general rule because a Condorcet-winner is necessarily
a Llull-winner. Eldredge is the Condorcet- and Llull-winner, and Llull’s rule yields the ranking
Eldredge≻S Li≻S Savoie≻S Honda≈S Weiss≈STamura.
The first three places are clear, but there is a tie for the next three places. Eldredge is theCondorcet-winner because he is ranked higher by a majority of judges in all pair-by-pair comparisons. There is noCondorcet-loser because no skater is ranked lower by a majority in all pair-by-pair comparisons.
Number Borda Eldredge Li Savoie Honda Weiss Tamura of wins score
Eldredge – 9 9 9 9 9 5 45
Li 0 – 7 7 8 7 4 29
Savoie 0 2 – 5 6 5 3 18
Honda 0 2 4 – 5 4 1 15
Weiss 0 1 3 4 – 6 1 14
Tamura 0 2 4 5 3 – 1 14
Table 3. Judges’ majority votes in all head-to-head comparisons.
Cusanus (in 1433 [32]) and later Borda (in 1770, published in 1784 [13]) had an entirely different idea. Borda’s method (it is so well-known under this name that we use it too): a competitorC receives k Borda-points if k competitors are belowC in a judge’s rank-order;C’sBorda-score is the sum of his Borda-points over all judges; and the Borda-ranking is determined by the competitors’
4Llull clearly states this rule. Copeland’s rule is usually interpreted as giving 1
2 for a tie,
Borda-scores. Alternatively, a competitor’s Borda-score is the sum of the votes he receives in all pair by pair votes. Thus the Borda-scores in table 3 are simply the sums of votes in the rows, and the Borda-ranking of the six candidates is
Eldredge≻S Li≻S Savoie≻S Honda≻S Weiss≈STamura.
Borda’s method, however, often denies first place to a Condorcet-winner or last place to a Condorcet-loser, and that has caused many to be bewitched, bothered and bewildered (though Borda’s method suffers from much worse defects as will soon become apparent).
There is an essential difference in the two approaches. Whereas Llull and Condorcet rely on each candidate’s total number of wins against all other can-didates in head-to-head confrontations, Cusanus and Borda rely on each candi-date’s total number of votes against all other candidates in head-to-head con-frontations.
TheOBO rule used in skating is this:
• Rank the competitors by their number of wins (thereby giving precedence to the Llull and Condorcet idea);
• break any ties by using Borda’s rule.
In this case Borda’s rule yields a refinement of Llull’s, so the OBO rule ranks the six skaters as does Borda,
Eldredge≻S Li≻S Savoie≻S Honda≻S Weiss≈STamura.
This was the official order-of-finish. The OBO rule is also known as Dasgupta-Maskin’s method [22, 21]. They proposed it with elaborate theoretical argu-ments, calling it “the fairest vote of all,” though it had been tried and discarded in skating.
The OBO rule produces a linear order, so is not subject to Condorcet’s paradox, but it is (unavoidably) subject to Arrow’s paradox, in this example viciously. For suppose that the order of the performances had been first Honda, then Weiss, Tamura, Savoie, Li and Eldredge. After each performance, the results are announced. Among the first three the judges’ inputs are
Name J1 J2 J3 J4 J5 J6 J7 J8 J9
Honda 2 1 1 1 2 2 3 3 3
Weiss 1 2 2 2 3 3 1 2 1
Tamura 3 3 3 3 1 1 2 1 2
This yields the majority votes, numbers of wins and Borda-scores:
Number Borda-Honda Weiss Tamura of wins score
Honda – 5 4 1 9
Weiss 4 – 6 1 10
so the result
Weiss≻S Honda≻STamura
(note that majority voting yields a Condorcet-cycle, Honda≻SWeiss≻STamura ≻S Honda.)
For the first four skaters the judges’ inputs are
Name J1 J2 J3 J4 J5 J6 J7 J8 J9
M. Savoie 1 3 1 2 3 4 3 2 1
T. Honda 3 1 2 1 2 2 4 4 4
M. Weiss 2 2 3 3 4 3 1 3 2
Y. Tamura 4 4 4 4 1 1 2 1 3
yielding
Number Borda-Savoie Honda Weiss Tamura of wins score
Savoie – 5 6 5 3 16
Honda 4 – 5 4 1 13
Weiss 3 4 – 6 1 13
Tamura 4 5 3 – 1 12
so the result
Savoie≻S Weiss≈S Honda≻S Tamura.
Before Savoie’s performance Weiss led Honda; afterward they were tied. Compare this with the final standings among all six skaters after the perfor-mances of Eldredge and Li (already computed):
Eldredge≻S Li≻S Savoie≻S Honda≻S Weiss≈STamura.
The last three did not perform, and yet Honda—who had once been tied with Weiss and once behind him—is now ahead of him, and Weiss—who had been ahead of Tamura—is now tied with him.
The ISU had discarded its oldOrdinal rule—used for many years—in 1998. It prescribed a competitor’s median place in the standings as his final place in the standings (an idea first advanced by Galton [29]), giving the result (where the median place is in parentheses following the names of each skater)
Eldredge(1)≻S Li(3)≻S Savoie(4)≈S Honda(4)≻S Weiss(5)≈STamura(5).
corresponded to the candidates’ final place or better5, which in this case puts
Savoie (with 15) ahead of Weiss (with 16), and gives the result
Eldredge≻S Li≻S Savoie≻S Honda≻S Weiss≻STamura.
Note however that—as with the OBO rule—flip-flops can occur, and do: the Ordinal rule gives the order Weiss ≻S Honda ≻S Tamura among the three alone. Indeed, in the women’s World Championships of 1995 the fourth place finisher performed after the three who finished ahead of her, but her performance changed the silver and bronze medals.
This chaotic behavior of repeated flip-flops is completely unacceptable to spectators, competitors, and of course common sense. It is no isolated phe-nomenon. Similar chaotic behavior occurs in the famous 1976 Paris wine tasting [6]. It is inherent to the old Ordinal rule, the OBO, Borda and other methods as well.
Strategic Manipulation
The OBO rule was abandoned by the ISU following the big scandal of the 2002 winter Olympics (also held in Salt Lake City). In the pairs figure skating com-petition the gold medal went to a Russian pair, the silver to a Canadian pair. The vast majority of the public, and many experts as well, were convinced that the gold should have gone to the Canadians, the silver to the Russians. A French judge confessed having favored the Russian over the Canadian pair, say-ing she had yielded to pressure from her hierarchy, only to deny it later. That judges manipulate their inputs—reporting grades not in keeping with their pro-fessional opinions—is known. A recent statistical analysis concluded: “[Judges] . . . appear to engage in bloc judging or vote trading. A skater whose country is not represented on the judging panel is at a serious disadvantage. The data sug-gests that countries are divided into two blocs, with the United States, Canada, Germany and Italy on one side and Russia, the Ukraine, France and Poland on the other” [54]. Once again the skating world entered into fierce fights over how to express and how to amalgamate the opinions of judges. Finally—thankfully— the idea that judges’ inputs should be rank-orders was abandoned. In so doing, the ISU joined the growing number of organizations whose rules direct judges to assign number grades to candidates, and the candidates’ average grades deter-mine the orders-of-finish (including diving, wine tasting, gymnastics, pianists, restaurants, and many others).
Such rules are usually known aspoint-summing methods; in the context of elections some call it range voting. The judges’ scores in the 2001 Four Con-tinents Figure Skating Championships provides an immediate example. Take the judges’ inputs to be the scores themselves. They range from a low of 0 to a high of 12. The candidates’ average scores are given in table 1 and yield an order-of-finish that differs from that of the Borda and OBO rules:
Eldredge≻S Li≻S Savoie≻S Weiss≻S Honda≻STamura.
It is at once evident that judges can easily manipulate the outcome by as-signing their grades strategically. Every judge can both increase and decrease the final score of every competitor by increasing or decreasing the score given that competitor.
Eldredge Li Savoie Honda Weiss Tamura
1st 2nd 5th 3rd 4th 6th
11.6 11.2+ 10.8+ 11.2 11.1 10.8
J2: ↓ ↓ ↓ ↓ ↓ ↓
12.0 11.9 10.2+ 11.8 11.4 10.2
11.42 10.93 10.81 10.72 10.73 10.64
Averages: ↓ ↓ ↓ ↓ ↓ ↓
[image:12.612.154.458.183.284.2]11.47 11.01 10.74 10.79 10.77 10.58
Table 4. JudgeJ2’s manipulations that change the order-of-finish to what
she wishes (given in the first row). Note that her new grades define the same order.
In this case it is particularly tempting for judges to assign scores strategically. Suppose they reported the grades they believed were merited. Take, for example, judge J2. She can change her scores (as indicated in the top part of table 4,
e.g., increasing that of Eldredge from 11.6 to 12.0 so that his average goes from 11.42 to 11.47) so that the final order-of-finish is exactly the one she believes is merited. Moreover, the new scores she gives agree with the order of merit she believes is correct. But judge J2 is not unique in being able to do
this: Every single judge can alone manipulate to achieve precisely the order-of-finish he prefers by changing his scores. And each can do it while maintaining the order in which they placed them initially (given in table 2). Results are announced following every performance, so judges accumulate information as the competition progresses and may obtain insights as how to best manipulate. This analysis shows how extremely sensitive point-summing methods are to strategic manipulation; in fact, they are more open to manipulation than any other method of voting. This is important because the reason for voting is to arrive at the true collective decision of a society or jury.
Faithful representation and meaningfulness
Pain, for example, is measured on an eleven pointordinal scale going from 0 to 10, each number endowed with a careful verbal description: it is not meaning-ful to sum or average such measures since an increase from (say) 2 to 3 cannot be equated with an increase from 8 to 9. Temperature, Celsius or Fahrenheit, is an interval scale because equal intervals have the same significance: sums and averages are meaningful but multiplication is not for there is no absolute 0. Ounces, inches and the Kelvin temperature scale areratio scales: they are interval scales where 0 has an absolute sense and multiplication is meaningful as well.
To appreciate the significance of what it means to add scores in competitions— that is, to construct an interval measure—consider two practical examples. The decathlon is an athletic competition consisting of ten track and field events. For each event a competitor receives a number of points depending on his perfor-mance. The sum of the points across all events is the competitor’s final score. How should the points be related to the performance? This is a non-trivial problem. In practice the formula for the 100 meter dash gives 651 points for 12 seconds, 861 for 11 seconds, 1096 for 10 seconds, and 1357 for 9 seconds. Going from 12 seconds to 11 adds 210 additional points; from 10 seconds to 9 garners an additional 285, although no human being has ever run that distance in 9 seconds. The merit of reducing the time by one second should not be measured linearly: it should be related to the difficulty of the improvement if the points are to constitute a valid interval measure. That difficulty may be assessed by the frequency with which it is realized: the distribution of the performances across “all” competitors determines how the points are assigned. So, given a distribution for the 100 meter dash, ideally each time should be mapped into points so that the same percentage of performances belong to any two inter-vals of points [x, x+ǫ] and [y, y+ǫ]. This gives to each interval of the same length the same meaning, and so transforms the performances into points that belong to an interval measure. Similarly, any distribution of performances may be mapped into a uniform distribution in an interval scale of points.
A second practical example confirms this interpretation, Denmark’s new seven-grade number language adopted for the academic year 2006–2007. It has seven numerical grades: 12, 10, 7, 4, 2, 0, or −3. For sums and averages to make any sense at all this scale must be an interval measure. The language of grades is described as follows:
12 (A) –outstanding, no or few unconsiderable flaws, 10% of passing students, 10 (B) –excellent, few considerable flaws, 25% of passing students
7 (C) –good, numerous flaws, 30% of passing students,
4 (D) –fair, numerous considerable flaws, 25% of passing students, 2 (E) –adequate, the minimum acceptable, 10% of passing students, 0 (Fx) –inadequate,
-3 (F) –entirely inadequate.
possible passing grades in an examination. Underlying the idea of an interval measure is that over the grades of many students in the closed interval [2,12], the percentages of students who obtain grades in intervals of the same length are the same. Which of the five passing grades should be assigned to a 5.7? The grade whose number is closest to 5.7, namely, 7 orgood; or, more generally, any number from the interval [5.5,8.5] should be mapped into agood. By the same token any grade from the interval [2,3] is mapped into anadequate, from [3,5.5] into afair, from [8.5,11] into anexcellent, and from [11,12] into anoutstanding. The five numbers (2, 4, 7, 10, 12) seem to have been chosen so that the intervals occupy, respectively, the percentages of the whole equal to the percentages of passing grades specified in the definition: [2,3] occupies 10% of the interval, [3,5.5] occupies 25%, [5.5,8.5] occupies 30%, [8.5,11] occupies 25% and [11,12] occupies 10%. Thus equal intervals do have the same significance: on average, the same percentage of passing students belong to each interval and on average, 10% areoutstanding, 25% areexcellent, and so on down to 10% areadequate. Thus the Danish system attempts to construct an interval measure so that it is meaningful to add and compute averages of the numbers it assigns students.
More formally, suppose k number grades, x1 < x2 < · · · < xk, are to be
given, and their percentages are to be (p1, p2, . . . , pk), so Ppj = 100. The
grades constitute an interval measure when for alli,xi is in the interval [p1+ · · ·+pi−1, p1+· · ·+pi] andPij=1pj is the mid-point of the interval [xi, xi+1].
Letqi=Pi
1(−1)j+1pj fori= 1, . . . , k.
Theorem 1 ([8], 172.) There exist number gradesx= (x1, . . . , xk) that
con-stitute an interval measure for the percentage distribution (p1, . . . , pk) if and
only if there exists aδ≥0 that satisfies
max
i q2i≤δ≤minj q2j+1.
When suchδexist, xsatisfying
x2i=−δ+ 2 i
X
j
p2j−1 and x2i+1=δ+ 2
i
X
j p2j
defines a set of interval measure grades for each possible value ofδ.
The theorem is proven by takingx1 =δ, and doing a bit of algebraic
manipu-lation.
Sometimes the percentages stipulated or observed admit an interval measure, sometimes not. When several are possible they are not equivalent: one set cannot be obtained from the other by scaling and translating since a change in the value of δ moves the grades with odd indices in the opposite direction of the grades with even indices. When the value of δ is unique, the solution is unstable, for some small perturbation in the percentages always renders an interval measure impossible. E.g., for an ǫ > 0 perturbation of the Dane’s original percentages, p= (10,25 +ǫ,30−ǫ,25,10) there is no set of interval measure grades. In conclusion, for any given set of percentages either there is no set of interval measure grades, or it is unique but unstable, or there are several sets that are not equivalent: these are troublesome facts which together suggest mechanisms that depend on adding or averaging should be shunned.
Nevertheless, point-summing methods are pervasive (and very old). Since they sum candidates’ scores they must—to be meaningful—be drawn from a common interval scale yet typically they are not. Although in many applications such as figure skating the numbers of the scale have commonly understood meanings, an increase of one base unit invariably becomes more difficult to obtain the higher the score, implying scores do not constitute an interval scale, and suggesting that their sums and averages are notmeaningful in the sense of measurement theory. Another application to which the same remarks apply is the 1976 Paris wine tasting: a point-summing method was used, it did not rely on an interval scale and the resulting ranking was highly questionable [6].
Recently point-summing methods have been proposed for political elections by bloggers in France and the USA.Range-voting6 uses the scale [0,100]. The
scores are not defined, they are given no common meaning, so one voter’s 71 may mean something entirely different from another’s 71: the scale is not a faithful representation. Vote de valeur7 has five scores, 0,±1,±2, but here,
in response to our criticisms, they have been assigned meanings: +2 is Very favorable, +1 Favorable, 0 Neutral, −1 Hostile, −2 Very hostile: the scale is a faithful representation. But in either case nothing justifies the choice of the numbers, nor does anything justify summing them: they are not interval scales so sums and averages are not meaningful in the sense of measurement theory.
Approval voting [17]—a voter assigns a 1 (“approves”) or a 0 to each can-didate and the cancan-didates are ranked according to their total numbers of 1’s— suffers for similar reasons. It has beenpracticed as a point-summing method— e.g., in the words of the Social Choice and Welfare Society’s ballot for electing its president, “You can vote for any number of candidates by ticking the appropriate boxes,” the number of ticks determining the candidates’ order of finish—though it has beenanalyzed via the traditional model. Both points of view invite com-parisons, so strategic voting, and thus Arrow’s paradox may occur (e.g., if some voter’s favorite candidate withdraws she may change her vote and decide to give a tick to one or more other candidate(s), causing a change in the order-of-finish among the candidates that remain). But its most fundamental problem is that
6Proposed by Warren Smith, see rangevoting.org. 7
one person’s tick may mean something altogether different than another’s. So, ticks do not constitute a faithful representation of the quality of candidates and their sum—not meaningful in terms of measurement theory—are at best very rough approximations.
A French national poll proves the point. It posed seemingly close but differ-ent questions in several polls preceding the French presiddiffer-ential election of 2007 (see table 5). Different questions elicit different responses: so, confronted byno question voters supply their own, respond accordingly, and the results are not interpretable. Indeed, asked to answer “yes” or “no” the same polls illustrate these can have very different gradations. Thus for voters or judges to express themselves adequately the scale must contain more than two levels.
Would each of the following be a good President of France?
Yes, Yes, Not Not
certainly probably Yes really at all No S´egol`ene Royal 21% 28% 49% 22% 26% 48% Fran¸cois Bayrou 18% 42% 60% 22% 14% 36% Nicolas Sarkozy 28% 31% 59% 18% 20% 38% Jean-Marie Le Pen 4% 8% 12% 13% 71% 84%
Do you personally wish each of the Could you personally vote for each of following to win the presidential election? the following in the presidential election?
Yes, Yes, Yes, Yes,
certainly somewhat Yes No certainly probably Yes No
Royal 14% 22% 36% 48% 27% 26% 53% 42%
Bayrou 6% 22% 28% 53% 25% 44% 59% 26%
Sarkozy 13% 17% 30% 53% 28% 26% 54% 41%
[image:16.612.135.494.263.418.2]Le Pen - - - - 8% 11% 19% 76%
Table 5. Results, Institut BVA polls, March 22, 2007 (a month before the first round of the French presidential election of 2007). The answers were given for each candidate independently (the difference between 100% and total yes’s plusno’s in each row is the percentage of no responses, e.g., in the top table 3% gave no response on Royal). Figures for Le Pen were not given in the “personal wish” question.
First-past-the-post or plurality voting—a voter is allowed to give one tick at most and a candidate’s total ticks decides his place in the order of finish—is worse. A poll conducted by the Institut BVA on April 10, 2007 (twelve days before the election) asked: “When voting in the first round of the [coming] pres-idential election, which of the following two attitudes correspond most closely to the way in which you will vote?
• I vote for the candidate on my side of the political spectrum who has the greatest chance of making the run-off.
• I vote for the candidate closest to my ideas even if he has little chance of making the run-off.”
do not care only about who wins,their utility functions depend also on factors other than who is elected.
To summarize: Voting or judging is measuring. The scale used by approval voting and first-past-the-post is not a faithful representation of voters’ opinions; moreover, the semantics are confusing, one tick lumping all kinds of different meanings into one. Taking their sum is tantamount to declaring 1 mile + 1 meter + 1 inch = 3 and is at best a very imprecise measure. The semantics of rank-order inputs are perfectly clear but they are far too limited to permit a faithful expression of opinion, deny the existence of any common scale, and lead to unacceptable methods. Point-summing methods exaggerate in the other direction, assuming the existence of a perfect scale of measurement—an interval scale—which is almost impossible to achieve and, in any case, leads to highly manipulable methods. There is, however, a middle ground that asks for more than rank-orders but less than an interval scale: an ordinal scale of merit.
1.3
A More Realistic Model
Postulate a finite number of competitors or candidates C = {C1, . . . , Cm}; a
finite number ofjudges or voters J ={1, . . . , n}; and a common language of grades Λ ={α, β, γ, . . .} that is a totally ordered set.
In practice (e.g., piano competitions, figure skating, gymnastics, diving, wine competitions), common languages of grades are invented to suit the purpose, and are carefully defined and explained. Their words are clearly understood, much as the words of an ordinary language, or the measurements of physics. But they almost surely do not constitute interval scales. The grades or words are “absolute” in the sense that every judge uses them to measure the merit of each competitor independently. They are “common” in the sense that judges assign them with respect to a set of benchmarks that constitute a shared scale of evaluation. They are ordinal scales and constitute faithful representations.
What scales are adequate? That depends on the particular application. In wines, a common language of seven words—Excellent, Very Good, Good, Passable, Inadequate, Mediocre, Bad—is used by judges to evaluate each of 14 attributes (concerning aspect, aroma, taste, flavor, . . . ).8 In judging
div-ing, twenty-one numbers—multiples of one-half in the interval [0,10], carefully defined—are used by judges to evaluate a dive (which has a degree of difficulty).9
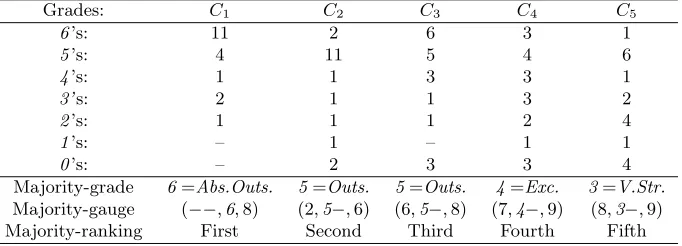
In reaching their decision on the 2009 Louis Lyons Award for Conscience and Integrity in Journalism, the judges at the Nieman Foundation at Harvard Uni-versity used majority judgment. They chose to use a common language of seven grades—Absolutely Outstanding, Outstanding, Excellent, Very Strong, Strong, Commendable, Neutral—to rank five very highly considered nominees. Had each of the judges in these cases ranked the competitors, their inputs would have been merely relative, barring any scale of evaluation and ignoring any sense of shared benchmarks. In general, the more grades the better given that judges
8OIV, Organisation Internationale de la Vigne et du Vin. 9
can naturally distinguish their meanings. Professional judges are typically able to distinguish more levels than a “general” public. In political elections some six or seven levels seems best (as seen anon). There is more meaning in common when voters assign about seven grades than fewer or more [38].
A problem is specified by itsinputs, a profile
Φ = .. . ... · · · ... ... αi1 αi2 · · · αin−1 αin
..
. ... · · · ... ... αk1 αk2 · · · αkn−1 αkn
.. . ... · · · ... ... ,
whereαij = Φ(Ci, j)∈Λ is the grade assigned by judgej ∈ J to competitor Ci ∈ C. With this formulation of inputs voters specify rank-orders determined by the grades (that may be strict if the scale of grades is fine enough), so in this sense the inputs include those of the traditional model. Experience proves they are simple and cognitively natural.
Suppose competitorCis assigned the grades (α1, . . . , αn) and competitorC′
the grades (β1, . . . , βn). Amethod of rankingis a non-symmetric binary relation S that compares any two competitors whose grades belong to some profile. By definitionCS C′ andC′ S CmeansC≈SC′; andC≻S C′ ifCS C′ and notC≈SC′. SoS is a complete binary relation.
What properties should any reasonable method of rankingS possess? (1)Neutrality: CS C′ for the profile Φ impliesCS C′for the profileσΦ for any permutationσof the competitors (or rows). That is, the competitors’ ranks do not depend on where their grades are given in the inputs.
(2) Anonymity: C S C′ for the profile Φ impliesC S C′ for the profile Φσ for any permutation σ of the voters (or columns). That is, no judge has more weight than another judge in determining the ranks of competitors. When a rule satisfies these first two properties it is calledimpartial.
(3) Transitivity: C S C′ and C′ S C′′ implies C S C′′. That is, Condorcet’s paradox cannot occur.
(4) Independence of irrelevant alternatives in ranking (IIAR): WhenC S C′ for the profile Φ, C
S C′ for any profile Φ′ obtained by eliminating or adjoining other competitors (or rows). That is, Arrow’s paradox cannot occur. These four are the rock-bottom necessities in the theory developed here. They are basic to Arrow’s theory [1], the recent method of Dasgupta-Maskin [22, 21], and are central to all debates on voting. Together they severely restrict the choice of a method of ranking.
A method of rankingrespects grades if the rank-order between them depends only on their sets of grades; in particular, when two com-petitorsC andC′ have the same set of grades, they are tied.
Said differently, if two voters switch the grades they give a competitor this has no effect on the electorate’s ranking of the competitors.
Theorem 2 ([8] 182.) A method of ranking is impartial, transitive and inde-pendent of irrelevant alternatives in ranking if and only if it is transitive and respects grades.
This simple theorem is essential: it says that if Arrow’s and Condorcet’s paradoxes are to be avoided, then the traditional model and paradigm must be abandoned. Who gave what grade cannot be taken into account. Not only do rank-order inputs not permit voters to express themselves as they wish, but they are the culprits that lead to all of the impossibilities and incompatibilities.
A social-ranking function is a method of ranking that is impartial, transitive and IIAR.
By theorem 2 such functions must respect grades and so depend only on the grades of each of the competitors. To see more clearly the implications of the theorem—or of using a social-ranking function—suppose there were three grades—Good,Pass, andBad—and that an electorate evaluated two candidates CandC′ as follows:
Good Pass Bad
C: 40% 35% 25%
C′: 35% 30% 35%
C’s percentages ofGood and Pass are both aboveC′’s, her percentage ofBad below C′’s, so there is no doubt that in the electorate’s evaluation C leads C′. But what does a majority vote say? That all depends. If the electorate’s preference profile is
30% 10% 10% 25% 25%
C: Good Good Pass Pass Bad
C′: Pass Bad Good Bad Good
(consistent with the distributions of grades) thenCwins with 65% of the votes (assuming a voter gives her vote to the candidate with the higher grade). On the other hand, if the electorate’s profile is
5% 35% 35% 25%
C: Good Good Pass Bad
C′: Pass Bad Good Pass
(also consistent with the distributions of grades) thenC′ wins with 60% of the votes. Thus more precise information about voters’ evaluations of candidates shows that majority voting and the traditional model may fail even when com-paring only two candidates.
grades determining the order-of-finish of the competitors. The usual practice, as was mentioned, is to use the average grade (a point-summing method), though sometimes the top and bottom grades, or top two and bottom two grades, are omitted.
Functions that assign a final grade to a competitor based only on the com-petitor’s set of grades should enjoy at least two other properties. First, if the voters all assign the same grade to a competitor it should be his final grade. Second, in comparing two ordered sets of grades, when each in the first set is at least as high as the corresponding grade in the second set, the final grade given the first should be no lower than that given the second; moreover, when each in the first set is strictly higher than the corresponding grade in the second set, the final grade given the first should be strictly higher than that given the second.
A functionf : Λn → Λ that transforms grades given a competitor into a final grade is a social-grading function if it satisfies three properties:
• Anonymity: f(. . . , α, . . . , β, . . .) =f(. . . , β, . . . , α, . . .);
• Unanimity: f(α, α, . . . , α) =α; and
• Monotonicity:
αj βj for allj⇒f(α1, . . . , αn)f(β1, . . . , βn)
and
αj ≺βj for allj⇒f(α1, . . . , αn)≺f(β1, . . . , βn).
Social-grading functions serve two separate though related purposes: (1) They assign a final grade to each competitor and (2) used as social-ranking functions, they determine the order-of-finish of all competitors. Obvious exam-ples of social-grading functions are the arithmetic mean or average, any other mean such as the geometric or harmonic mean, and the kth order functionfk that is thekth highest grade (fork= 1,2, . . . , n).
In practice grades are almost always numbers and, since final grades can be determined by functions such as means, a discrete scale of inputs (including word grades that have been assigned numbers) may well yield a richer set of outputs, and this in turn may naturally lead to defining a richer set of input grades. So it is reasonable—and permits a cleaner and more elegant theory—to assume from the outset that grades belong to an interval of the real line. It turns out not to matter whether this interval be open, half-open, bounded or not: so the choice has been to take the closed interval [0, R] (in keeping with the often used [0,100] in the U.S. and [0,20] in France).
a sufficiently large finite set of grades (e.g., theorem 5); some require neither (e.g., theorem 3). When a voter or judge has no interest in deviating from a particular grade in a rich set of grades he has no interest in deviating from that same grade in a subset of them. Although continuity or a sufficiently rich set of grades are necessary for some characterizations the properties of the functions that are characterized hold for finite sets of grades. In any case we believe that the same criteria should be used whatever the size of the language of grades.
The question that presents itself is: Which social-grading function(s) of the grades of competitors should be used to grade and which to rank?
2
Majority Judgment
In addition to treating voters and candidates impartially, nine desirable prop-erties of a method of voting or judging emerge:
1. Determine (generically) a winner, i.e., a transitive order-of-finish (or avoid Condorcet’s paradox),
2. Guarantee that the final order between two candidates does not depend on other candidacies, i.e., satisfy IIAR (or avoid Arrow’s paradox),
3. Faithfully represent voters’ opinions in practice,
4. Elicit honest voting (make an honest vote be good strategy), 5. Use measures meaningfully (add numbers whose sums make
sense),
6. Resist manipulation (minimize the possibility of successful cheat-ing),
7. Heed the majority’s will (seek true consensus),
8. Elect the Condorcet-winner when he exists (beCondorcet-consistent), and
9. Ensure that a voter always helps his favorite candidate (no “no-show paradox”).
While majority judgment satisfies some desirable properties it fails to satisfy others: “Nothing is perfect. There are lumps in it.” It is the one method that satisfies the first seven properties. It may be characterized mathematically in several ways, among them by 1, 2 and 6 and also by 1, 2, 5 and 7.
a winner, and when judges’ rank-orders are known it occurs (e.g., skating and wines [6]).
One of the two critiques of majority judgment is its potential violation of Condorcet-consistency (point 8): we argue below that it is of little importance. The second critique is that it violates 9, the no-show paradox [26]. First, there exists no method that is Condorcet-consistentand avoids the no-show paradox [39]. Second, the only methods that satisfy 1, 2 and 9 violate 4, 5, 6, 7, and 8 [8]. Third, in practice majority judgment violates 9 less often than a tie in ordinary majority voting. These points are discussed more fully below.
2.1
Majority Judgment: Description
Suppose there arenjudges or voters who assign competitors grades.
Thekthorder functionfkis the social-grading function whose value is thekthhighest grade.
When the set of gradesrof a competitor is ordered from highest to lowest,
r= (r1r2 · · · rn)⇒fk(r) =rk.
A competitor’smajority-gradefmaj is the grade that obtains an ab-solute majority of the voters against any lower grade and an abab-solute majority or a tie against any higher grade: it is his middlemost or median grade whennis odd, his lower-middlemost whennis even:
fmaj =
(
fn+12 ifnis odd,
fn+22 ifnis even.
A majority-grade is not a median because there is no median when n is even. A separate term is needed. The lower- rather than the upper-middlemost is taken for two reasons. First, it insists on an absolute majority for a high grade rather than for a low one. Second, it is the logical consequence of “re-specting consensus” (developed anon) which in essence comes down to this. If two competitors have two grades,A with 10.9 and 9.8, B with 10.5 and 10.2, that candidate whose grades are more consensual should lead, soB should lead A.
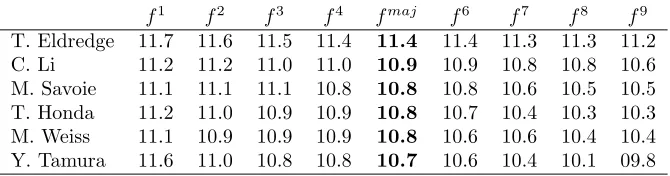
f1 f2 f3 f4 fmaj f6 f7 f8 f9
[image:23.612.139.474.122.210.2]T. Eldredge 11.7 11.6 11.5 11.4 11.4 11.4 11.3 11.3 11.2 C. Li 11.2 11.2 11.0 11.0 10.9 10.9 10.8 10.8 10.6 M. Savoie 11.1 11.1 11.1 10.8 10.8 10.8 10.6 10.5 10.5 T. Honda 11.2 11.0 10.9 10.9 10.8 10.7 10.4 10.3 10.3 M. Weiss 11.1 10.9 10.9 10.9 10.8 10.6 10.6 10.4 10.4 Y. Tamura 11.6 11.0 10.8 10.8 10.7 10.6 10.4 10.1 09.8
Table 6. Competitors’ scores ordered from highest to lowest (identities of judges forgotten). Majority-grades are italicized.
In general, suppose a competitor’s grades are
r1r2 · · · rn.
Her majority-value is an ordered sequence of these grades. The first in the sequence is her majority-grade; the second is the majority-grade of her grades when her (first) grade has been dropped (it is her “second grade”); the third is the grade of her grades when her first two majority-grades have been dropped; and so on. Thus, when there is an odd number of votersn= 2t−1, a competitor’s majority-value is the sequence that begins at the middle,rt, and fans out alternately from the center starting from below:
−
→r = (rt, rt
+1, rt−1, rt+2, rt−2, . . . , r2t−1, r1).
When there is an even number of votersn= 2t−2, the majority-value begins at the lower middle and fans out alternatively from the center starting from above,
−
→r = (rt, rt−1, rt+1, rt−2, rt+2, . . . , r2t−2, r1).
If the majority-values of two competitorsAandB are respectively−→rAand −
→rB, themajority-ranking ≻maj is defined by
A≻maj B when−→rA≻lexi−→rB,
where≻lexi means lexicographically greater, i.e., the first grade where−→rAand −
→r
B differA’s is higher. The majority-ranking in the skating competition is
Eldredge≻maj Li≻maj Savoie≻majHonda≻majWeiss≻majTamura.
There can be a tie only if two competitors have precisely the same set of grades. A key point should be noted. Consider any judge or set of judges who assigned a competitor a grade higher than his majority-grade; e.g., Honda’s majority-grade is 10.8 and four judges—J2, J3, J4, J6—believed he merited a
higher grade: neither one of them nor all of them acting together can raise his majority-grade by changing the grades they assigned. Symmetrically, four judges—J1, J7, J8, J9—believed he merited a lower grade: neither one of them
Majority Judgment with Large Electorates in Use
With many voters and few grades it is almost certain that a candidate’s middle-most grade will be repeated many times. Thus, an absolute majority of voters assign a candidate at least her majority-grade, and also an absolute majority of voters assign the candidate at most her majority-grade. Moreover, a simplified procedure is almost sure to determine the majority-ranking.
Majority judgment has been tested in several political settings [8, 5, 50, 43, 47, 48]. Terra Nova (a Paris-based think tank) sponsored a poll conducted by the national polling agency OpinionWay on April 6 and 7, 2011. Entitled “And if the presidential election of 2012 used Majority Judgment,” a sample of 1,025 persons 18 years old or above and representative of the French population was questioned. The results concern 991 of them who were registered voters and responded to at least one question. French presidential elections use two-past-the-post: a voter names (or ticks) at most one candidate, the candidate most often named (or with the most ticks) wins if she obtains an absolute majority; otherwise, there is a run-off between the two candidates most often named. The central interest of this poll is that the identical set of people voted with the usual method and with majority judgment, permitting comparisons.
Martine Marine Nicolas Fran¸cois Jean-Louis Eva Aubry Le Pen Sarkozy Bayrou Borloo Joly
21.7% 20.6% 19.1% 8.5% 7.8% 7.4%
Jean-Luc Dominique Olivier Jean-Pierre Nicolas Nathalie M´elenchon de Villepin Besancenot Chev`enement Dupoint-Aignan Arthaud
[image:24.612.136.476.357.418.2]4.2% 3.7% 2.9% 1.9% 1.4% 0.8%
Table 7. First-past-the-post, French 2012 presidential election, Opinion-Way poll, conducted April 6-7, 2011.
The poll’s first question10: “If the first round of the 2012 presidential
elec-tions were to be held next Sunday, for which of the following candidates would you most likely vote?” The answers are given in table 7.
The poll’s second question: “If the second round of the 2012 presidential elections were to be held next Sunday, for which of the following candidates would you most likely vote for?” The answers in each of three possible run-offs:
Run-off 1 Run-off 2 Run-off 3
Aubry Le Pen Aubry Sarkozy Sarkozy Le Pen
63.2% 36.8% 56.0% 44% 63.3% 36.7%
Voting measures to determine winners and orders-of-finish. The results show majority voting—in one round or two—measures badly. The incumbent pres-ident Sarkozy is eliminated, yet he would easily defeat Le Pen. Since the poll admits a 2 to 3% error, any one of the three leading finishers could be eliminated—including the candidate truly wished by the electorate (with first-or two-past-the-post). It seems that the electfirst-orate’s choice is among the majfirst-or
10
candidate of the left Aubry, the extreme rightist Le Pen and the major candidate of the right Sarkozy, the remaining candidates being relegated to minor roles. It also seems clear that the strategy of the major candidates of left (Aubry) and right (Sarkozy) is to encourage multiple candidacies in the opposite camp to dilute their total vote in the hopes of a run-off against Le Pen.
Election of the President of France 2012
As President of France,
having taken into account all relevant considerations, I judge, in conscience, that each of these candidates would be:
Outstan- Excel- Very Good Accept- Poor To ding lent Good able Reject
Candidate
You must check one single grade in the line of each candidate.
Table 8. Majority judgment ballot, French 2012 presidential election, OpinionWay poll, conducted April 6-7, 2011 (one line for each candidate).
The poll’s third question asked participants to vote with majority judgment using the ballot given in table 8. In this poll: (1) three of every four voters accord no Outstanding; (2) half of the voters accord no Outstanding and no Excellent, (3) one of every five voters only assignAcceptable or below, (4) one of every five voters give their highest grade to two candidates, and (6) one of every five voters give their highest grade to at least three candidates. This behavior is by and large consistent with that observed every time majority judgment is used in political elections. It shows the inadequacy of the traditional inputs, be they rankings or ticks.
Outstan- Excel- Very Good Accept- Poor to
ding lent Good able Reject
Arthaud 0.1% 00.9% 03.3% 07.7% 13.7% 26.1% 48.0% Besancenot 0.8% 01.7% 06.9% 09.9% 16.1% 20.4% 44.2% M´elenchon 1.3% 02.7% 05.0% 11.2% 16.5% 21.4% 41.8% Joly 3.2% 04.7% 07.4% 14.5% 20.3% 19.0% 30.9% Aubry 8.2% 12.9% 17.0% 12.6% 19.6% 11.4% 18.4% Chev`enement 0.5% 01.1% 05.8% 12.9% 22.8% 24.7% 32.2% Bayrou 1.2% 04.7% 12.8% 19.2% 26.1% 16.6% 19.3% Borloo 2.2% 06.2% 15.3% 22.3% 19.6% 15.9% 18.5% Villepin 2.0% 05.8% 11.9% 20.4% 20.7% 17.4% 21.9% Sarkozy 4.1% 08.7% 11.1% 09.5% 13.5% 11.8% 41.3% Dupont-Aignan 0.5% 01.4% 02.7% 07.0% 13.9% 27.7% 46.7% Le Pen 6.8% 06.5% 07.0% 07.2% 07.8% 09.3% 55.6%
Table 9. Results, French 2012 presidential election, OpinionWay poll, conducted April 6-7, 2011.
[image:25.612.163.451.252.292.2] [image:25.612.134.480.457.613.2]of his grades are higher than αand q% are lower. Then his majority-gauge is (p, α±, q), wherep > q implies α is endowed with a “+,” and otherwise it is endowed with a “−.” Thus Aubry’s majority-gauge is (38.0%,Good−,49.3%).
The majority-gauges (p, α±, q) determine themajority-rankingof the candi-dates (see table 10). If two candicandi-dates have the same majority-gradeα(ignoring for the moment the signs), four sets of voters disagree. Their respective sizes are measured by the two candidates’ p’s and q’s. The largest set decides: if it is a p then that candidate leads the other, if it is a q then that candidate trails the other. For example, Sarkozy and Ch`evenement both are Poor, the largest set is the 46.9% for a higher grade for Sarkozy, so he leads; M´elenchon and Besancenot both arePoor as well, the largest set is the 44.2% for a lower grade for Besancenot, so he trails. Notice that the rule implies a candidate with α+ leads a candidate withα−. When the majority-gauge distinguishes between two candidates, it necessarily agrees with the majority-ranking. With some 20 voters or more and a common language of some 6 grades, the majority-gauge (not the more precise majority-value) has sufficed to distinguish candidates in all uses to date.
Majority judgment Majority-gauge Majority vote
ranking p α± q ranking
1 Martine Aubry 38.0% Good− 49.3% 1
2 Jean-Louis Borloo 46.0% Acceptable+ 34.4% 5 3 Dominique de Villepin 40.1% Acceptable+ 39.3% 8 4 Fran¸cois Bayrou 37.9% Acceptable+ 35.9% 4
5 Eva Joly 29.9% Acceptable− 49.8% 6
6 Nicolas Sarkozy 46.9% Poor+ 41.3% 3
7 Ch`evenement 43.1% Poor+ 32.2% 10
8 M´elenchon 36.8% Poor− 41.8% 7
9 Besancenot 35.4% Poor− 44.2% 9
10 Dupont-Aignan 25.5% Poor− 46.7% 11
11 Nathalie Arthaud 25.8% Poor− 48.0% 12
[image:26.612.143.473.339.507.2]12 Marine Le Pen 44.4% to Reject – 2
Table 10. Majority-gauges and majority-ranking, French 2012 presidential election, OpinionWay poll, conducted April 6-7, 2011.
majority judgment to be in fact favored to Sarkozy. Their majority-grades are allAcceptable+, placing them much higher than Sarkozy and Le Pen. Majority judgment takes all of a candidate’s grades into account—the good ones and the bad ones—to determine her place in the ranking. In contrast, simple majority voting takes into account only a mixture of supposedly favorable opinions.
One of the very interesting outcomes of this poll is the consistently low majority-grades of all candidates. Seven candidates are judged to be Poor or worse, including the incumbent President, Sarkozy; and only one candidate, Aubry, is judgedGood. This is an echo of the disregard for politicians regularly reported by opinion polls and also of the fact that the campaign had not yet begun.
Notice that voters who believed Borloo (for example) merited a higher majority-grade thanAcceptable—and 46.0% were of that persuasion—could do nothing alone or in concert to raise his majority-gauge. Symmetrically, those who believed he merited a lower majority-grade—34.4% of them—could do noth-ing alone or in concert to lower his majority-gauge. The best strategy of a voter who wishes that a candidate be awarded a particular majority-grade is to assign him that grade.
2.2
Majority Judgment: Theory
When a social-grading function is used to amalgamate the grades voters or judges assign competitors, and the grades determine the order-of-finish of the competitors, the Condorcet and Arrow paradoxes cannot occur—transitivity is assured and there can be no flip-flops—as has been proven. Since the grades have only ordinal significance and are neither summed nor averaged, the method is meaningful. Thus three of the seven essential demands are necessarily met.
Elicits Honesty
end. Others may not care at all about the final grades but only about the order-of-finish of the competitors. Still others may think that only the identity of the winner is of importance. Some few may be bought or bribed. Some other few may simply be completely incompetent judges who assign unwarranted grades. The final grade a voter wishes a competitor to be awarded, the final grade he be-lieves the competitor merits, and the grade he gives may all be different. Some juries and electorates almost certainly include judges and voters who honestly wish grades to be assigned according to merit, and in certain cases it is perfectly reasonable to assume that all the players share this intent. Nevertheless, a very complex set of unknown wishes, opinions, expectations and anticipations—the voters’ or judges’utility functions—determines the grades they give.
How is a social-grading function to elicit honesty? By making it impossible or difficult for individual voters to change the outcome by using devious strategies.
Suppose that a competitor’s final grade isr∗. A social-grading func-tion is strategy-proof-in-grading if, when a voter’s input grade is higher than the final grade, r+ > r∗, any change in his input can only lead to a lower final grade; and if, when a voter’s input grade is lower than the final grade, r− < r∗, any change in his input can only lead to a higher final grade.
It is easy to see that the majority judgement is not only strategy-proof-in-grading but alsogroup strategy-proof-in-gradingin that a group whose inputs are higher (or lower) than the final grade can only lower (raise) the final grade. Thus, one or all of those who gave Aubry a grade above her majority-grade (Good) cannot change her majority-grade or-gaugeexcept to lower it (presumably not their intention). Similarly, one orall of those who gave her a grade below her majority-grade cannot change her majority-grade or -gaugeexcept to raise it (presumably not their intention).
Assume the more a final grade deviates from the grade a voter wishes it to be the less she likes it (“single-peaked preferences over grades”), so that the voter’s utility function uj(r∗,r, f,C,Λ) could be a monotonic transformation of |r∗
j −f(r1, . . . , rn)|. Then—as is well known in the work on single-peaked
preferences (e.g., [29, 11, 40])—it is adominant strategy for her to assign the grade she believes is merited: i.e., it is at least as good as any other strategy and strictly better in some cases.
Theorem 3 ([40],[8] 191-192.) The unique strategy-proof-in-grading social-grading functions are the order functions (for a finite or an infinite number of grades, continuous or discontinuous functions).11
A competitor who receives a higher majority-grade than another is naturally ranked higher in the order of the candidates or alternatives than the other: grades imply orders. But when an important component of the voters’ utilities
11
are the orders of finish and not merely the final grades of competitors, their strategic behavior may well alter.
Given a profile of grades (rC
j ),C ∈ C, and j ∈ J with rjC ∈[0, R], let the vector of final grades be (rC). Suppose the final grades of some two competitors A, B ∈ C are rA < rB, but that some voter j is of the opposite conviction, rA
j > rBj . She would like either to increaseA’s final grade, or decreaseB’s final grade, or better yet do both.
When the final grade ofA is lower than that ofB, rA < rB, and any voterj is of the opposite conviction,rAj > rjB, a social-ranking function is strategy-proof-in-ranking if j can neither decrease B’s final grade nor increaseA’s final grade.
Consider a voterj whose utility function uj depends only on the ultimate ranking of the competitors, that is, only on the order of the final grades. Then if the social-ranking function is strategy-proof-in-ranking, it is a dominant strategy for voterjto assign grades according to his convictions since it serves no earthly purpose to do otherwise.
Theorem 4 ([8] 220.) There exists no social-ranking function that is strategy-proof-in-ranking.
This is the analog of the Gibbard-Satterthwaite theorem. But the impossi-bility of perfection does not deny a search for a best possible.
A social-ranking function ispartially strategy-proof-in-ranking when rA < rB and any voter j is of the opposite persuasion, rAj > rBj , then if j can decrease B’s final grade he cannot increase A’s final grade and if he can increaseA’s final grade he cannot decreaseB’s final grade.
Theorem 5 ([8] 222.) The unique social-ranking functions that are partially strategy-proof-in-ranking are the order functions.