The Effects of Gaze Control and Body Segment
Recoupling on Human Gait and Foot Pressure
Variability: A Modern and Evolutionary Perspective
Thesis submitted in accordance with the requirements of the
University of Liverpool for the degree of Doctor in Philosophy
by
Emma Louise Webster
Dedicated to the Memory of my Beloved Grandmother
Elsie May Webster
3
rdMay 1930 – 13
thOctober 2014
“Unable are the loved to die. For love is immortality.”
Emily Dickinson
And also
Mum, Dad, and Ashley
Table of Contents
Abstract………... I Acknowledgements ... III
Table of Figures ... v
Table of Tables ... ix
List of Abbreviations ... x
1 Introduction ... 1
1.1 Postural Control in Modern Humans... 1
1.2 Types of Postural Control ... 3
1.3 Sensory Inputs and Postural Control ... 4
1.3.1 Visuo-vestibular ... 4
1.3.2 Somatosensation ... 8
1.4 Motor Mechanisms for Postural Control ... 9
1.4.1 Reflexes and Muscle Synergies ... 9
1.4.2 Human Gait and Balance Adaptations ... 11
1.5 Adaptive Postural Control: Effects of Sensory Load and Attention ... 13
1.6 Postural Control and Ageing ... 15
1.6.1 Sensorimotor Deficits Associated with Ageing ... 15
1.6.2 Balance Control in the Elderly and Infirm... 17
1.7 Postural Control and Human Evolution ... 20
1.7.1 The First Habitual Bipeds ... 20
1.7.2 Homo – The Predominant Bipeds ... 22
1.8 Summary and Gaps in Knowledge ... 25
1.9 Research Question and Overarching Hypotheses ... 27
1.10 Thesis Outline ... 28
Chapter 2: Materials and Methods ... 30
2.1 Equipment ... 30
2.2.1 Pupil Movement ... 34
2.2.2 Foot Pressure Records ... 36
2.2.3 Kinematics ... 39
2.3 Ethical Considerations ... 41
Chapter 3: The Impact of Gaze Control During Walking ... 42
3.1 Introduction ... 42
3.2 Methods ... 44
3.2.1 Subjects ... 44
3.2.2 Experimental Setup ... 44
3.2.3 Protocol ... 45
3.2.4 Data Analysis ... 47
3.2.5 Repeatability ... 49
3.2.6 Statistical Analysis ... 49
3.3 Results ... 50
3.3.1 Foot Pressure Variability... 50
3.3.2 Repeatability ... 53
3.4 Discussion ... 55
3.4.1 Implications with Respect to Ageing and the Built Environment ... 57
3.4.2 Implications for Evolution and Sensorimotor Adaptation ... 59
3.4.3 Conclusion ... 60
Chapter 4: The Impact of a Dual Visual-Auditory Task During Walking ... 61
4.1 Introduction ... 61
4.2 Methods ... 64
4.2.1 Subjects ... 64
4.2.2 Experimental Setup ... 65
4.2.3 Protocol ... 65
4.2.4 Data Analysis ... 68
4.2.5 Statistical Analysis ... 69
4.3 Results ... 70
4.4.1 Societal and Clinical Implications ... 75
4.4.2 Implications for Evolution and Sensorimotor Adaptation ... 77
4.4.3 Conclusion ... 79
Chapter 5: The Impact of Body Segment Coupling During Walking ... 80
5.1 Introduction ... 80
5.2 Methods ... 82
5.2.1 Subjects ... 82
5.2.2 Experimental Setup ... 83
5.2.3 Protocol ... 87
5.2.4 Data Analysis ... 88
5.2.5 Statistical Analysis ... 89
5.3 Results ... 90
5.3.1 Foot pressures ... 90
5.3.2 Kinematics ... 92
5.4 Discussion ... 95
5.4.1 Foot pressures ... 95
5.4.2 Kinematics ... 96
5.4.3 Societal and Clinical Implications ... 98
5.4.4 Evolutionary implications ... 100
5.4.5 Conclusion ... 103
Chapter 6: Overall Conclusion ... 105
6.1 Project Summary ... 105
6.2 Summary of Experimental Conclusions ... 106
6.3 Conclusions about the Research Question ... 107
6.4 Implications ... 108
6.4.1 Evolutionary implications ... 108
6.4.2 Implications for Ageing and the Built Environment ... 109
6.5 Limitations and Further Research... 111
6.6 Closing Statement ... 112
8 Appendices ... 141
Appendix 1: Supplementary Information for Materials and Methods... 141
Appendix 2: Supplementary Information for Chapter 3 ... 164
Appendix 3: Supplementary Information for Chapter 4 ... 175
Appendix 4: Supplementary Information for Chapter 5 ... 191
Abstract
This thesis investigates the relationships between gaze control, body segment coupling, and foot pressure patterns during walking, and discusses the resulting implications for both modern humans and our evolution. One of the major changes thought to underlie the transition between
Australopithecus and Homo is the decoupling of the head and shoulders, and trunk and hips. The independent rotation of these segments enables greater control of the torque and free moments resulting from leg swing, and is considered key in the control of bipedal locomotion. Fossil evidence of semicircular canal morphology (Spoor et al., 1994) also indicates congruent changes in the vestibular system, which alongside the ability to track moving objects with clarity using smooth pursuit eye movements, are likely to have been fundamental to sensory integration and prioritisation during locomotion.
This research therefore assesses how the increased neurological demands of active visual tracking in environments of varying visual complexity, and the artificial recoupling of body segments, impact on foot pressure variability during locomotion in modern man. The results demonstrate that foot pressure variability appears unaffected by larger levels of background visual clutter when tracking using smooth pursuit eye movements - variability appears to be higher in very low levels of visual clutter when there is a relative absence of visual referents. This variability was found to further increase when undertaking a secondary auditory task whilst compared to visual tracking alone. When considering the effects of experimental recoupling of body segments, an increase in foot pressure variability was also observed when compared to natural unrestricted walking, with increased arm and leg swing appearing to compensate for reduced hip and shoulder rotations.
Acknowledgements
There are many people to whom I have become indebted throughout this project, and to each of you I offer my most heartfelt thanks and gratitude. Firstly, I thank the Natural Environment Research Council, without whose funding this project would not have been possible.
To my supervisor Prof Robin Crompton, thank you for your constant guidance, support and encouragement, and for always managing to find time for me - even when you didn’t really have it to spare!
To Russ Savage, thank you for the uncountable hours you have spent code writing, preparing equipment, and collecting data alongide me to name but a few. You have been an incredible help and patient guide throughout.
I am also extremely grateful for the advice and assistance of Dr Karl Bates, Dr Michael Gunther, Dr Nathan Jeffery, Dr Todd Pataky, and Dr Yannis Goulermas and Dr Georg Meyer, whose insight and suggestions throughout the course of this project have proven invaluable. Thanks also to Dr Meyer for his generosity and kindness in allowing me to use his eye-tracker for the duration of this project.
I also warmly thank the rest of Evolutionary Morphology and Biomechanics Group, particularly Dr Mary Blanchard, Colleen Goh, Juliet McClymont, Sarita Morse and Dave Collins for their friendship and support. Thank you for preventing me from losing sight of the end goal when times were tough, and for making sure I took the time to enjoy myself when they were good.
My sincere thanks are also extended to Ashan, Claire, Joe, Megan, Emily and Rachel, whose assistance with the collection of data was very much appreciated. Of course, data collection would not have been possible without the subjects who gave up their time to take part in these experiments, to all of which I also extend my gratitude.
In particular I thank my beloved grandma, Elsie, to whom this thesis is dedicated. Thank you for instilling in me that ‘Everything happens for a reason’. Your mantra continues to reassure and comfort, your strength and courage inspires me every day. Your weekly phone calls never failed to lift me and I will forever miss hearing the phone ring on Wednesdays at 7pm on the dot.
Also, I thank my Auntie Stella. You are the very definition of selfless. You have always been there for me when I needed you, no matter how big or small the problem. Thank you for always looking out for me.
Table of Figures
FIGURE 2.1: ZEBRIS-FDM FOOT PRESSURE SENSITIVE TREADMILL. ... 31
FIGURE 2.2: EXEMPLAR FOOT PRESSURE RECORD DISPLAYED AS A COLOUR MAP. COLOUR BAR
REPRESENTS ACTUAL PRESSURE (N/CM2). ... 32
FIGURE 2.3: EXAMPLE OF THE X,Y,Z COORDINATE SYSTEM AS SEEN IN QTM. DURING PROCESSING, QTM
SHOWS THE RELATIVE POSITION OF THE MOTION CAPTURE CAMERAS TO THE SUBJECT, A FEW OF
WHICH ARE SEEN FROM THIS ANGLE. EACH GREEN DOT REPRESENTS A REFLECTIVE MARKER
POSITIONED ON AN ANATOMICAL LANDMARK ON THE SUBJECT. ... 33
FIGURE 2.4: INFRARED LIGHT EMITTED BY THE MOTION CAPTURE CAMERAS IS REFLECTED BACK FROM
RETRO-REFLECTIVE MARKERS ATTACHED TO ANATOMICAL LANDMARKS ON THE SUBJECT. THE
GLOBAL COORDINATES FOR EACH MARKER ARE THEN TRACKED. ... 33
FIGURE 2.5: EXEMPLAR EYE TRACKING PROFILE OF HORIZONTAL PUPIL MOVEMENT MEASURED USING
THE EYE-TRAC SYSTEM. RED CROSSHAIRS MARK THE TRANSITIONS BETWEEN THE GAZE TRACKING
TYPES. SEGMENTS MARKED ‘S’ INDICATE THE PORTIONS OF THE TRIAL WHERE THE TARGET IS
STATIONARY AND GAZE FIXATED. SEGMENTS MARKED ‘M’ INDICATE AREAS OF TARGET
MOVEMENT, AND HENCE SMOOTH PURSUIT OCCURRENCE. ... 36
FIGURE 2.6: EXEMPLAR EYE TRACKING PROFILE OF HORIZONTAL PUPIL MOVEMENT MEASURED USING
THE VIEWPOINT SYSTEM. RED CROSSHAIRS MARK THE TRANSITIONS BETWEEN THE GAZE TRACKING
TYPES. SEGMENTS MARKED ‘S’ INDICATE THE PORTIONS OF THE TRIAL WHERE THE TARGET IS
STATIONARY AND GAZE FIXATED. SEGMENTS MARKED ‘M’ INDICATE AREAS OF TARGET
MOVEMENT, AND HENCE SMOOTH PURSUIT OCCURRENCE. ... 36
FIGURE 2.7: REGISTRATION OF FOOT PRESSURE RECORDS TRANSFORMS EACH RECORD TO ALIGN WITH
A TEMPLATE PRINT. PRESSURE RECORDS ARE ROTATED AROUND THE CENTROID TO OPTIMALLY
FIGURE 2.8: ANGLES (ᶿ) CALCULATED WERE THOSE BETWEEN TWO ANATOMICAL LANDMARKS A AND B.
THE ANGLE MEASURED IS BASED ON THE INTERSECTION OF VECTOR A-B WITH THE AXIS OF
INTEREST (DEFINED BY A-C) HENCE THE POSITION OF THE DISTAL TRAJECTORY B RELATIVE TO THAT
AXIS DETERMINED WHETHER THE ANGLE WAS POSITIVE OR NEGATIVE. ... 40
FIGURE 3.1: DIAGRAMMATIC REPRESENTATION OF THE EXPERIMENTAL SET UP, INCLUDING THE
EYETRACKER, PRESSURE SENSITIVE TREADMILL, PROJECTOR, AND CURVED PROJECTION SCREEN. . 45
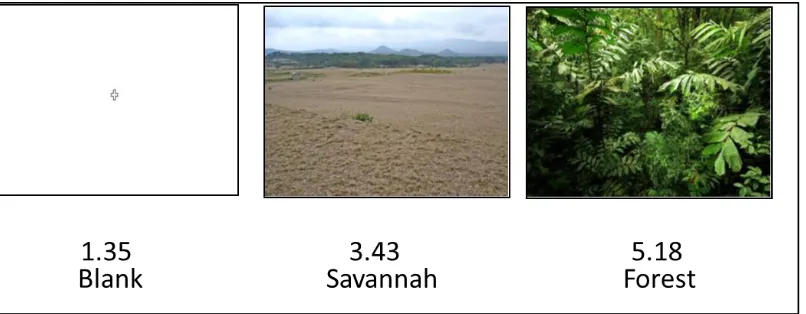
FIGURE 3.2: BACKGROUND IMAGES REPRESENTING EACH OF THE THREE VISUAL CLUTTER LEVELS
TESTED. VALUES REPRESENT FEATURE CONGESTION SCALAR VALUES GENERATED USING THE
FEATURE CONGESTION CODE OF ROSENHOLTZ ET AL. 2007. ... 47
FIGURE 3.3: EXEMPLAR EYE TRACKING PROFILE OF HORIZONTAL PUPIL MOVEMENT. RED CROSSHAIRS
MARK THE TRANSITIONS BETWEEN THE GAZE TRACKING TYPES, BUFFERS AROUND WHICH
ALLOWED THE REMOVAL OF PRESSURE RECORDS MADE DURING TRANSITIONAL PHASES FROM THE
DATA SET. SEGMENTS MARKED ‘S’ INDICATE THE PORTIONS OF THE TRIAL WHERE THE TARGET IS
STATIONARY AND GAZE FIXATED. SEGMENTS MARKED ‘M’ INDICATE AREAS OF TARGET
MOVEMENT, AND HENCE SMOOTH PURSUIT OCCURRENCE. ... 48
FIGURE 3.4: COMPARISON OF VARIANCE IN FOOT PRESSURE MEAN SQUARE ERROR (MSE) DURING
OBJECT TRACKING USING GAZE FIXATION AND SMOOTH PURSUIT. ... 50
FIGURE 3.5: COMPARISON OF VARIANCE IN FOOT PRESSURE MEAN SQUARE ERROR (MSE) DURING
OBJECT TRACKING ACROSS THREE LEVELS OF BACKGROUND VISUAL CLUTTER. ... 51
FIGURE 3.6: EXAMPLE FOOT PRINTS FOR EACH OF THE 10 SUBJECTS (1-10) DURING SMOOTH PURSUIT
TRACKING AGAINST EACH CLUTTER LEVEL (A = BLANK SCENE; B = SAVANNAH SCENE; AND C =
FOREST SCENE). THE PRINTS REPRESENTED IN EACH SET ARE THE MEAN (LEFT) AND THE PRINT
WITH THE HIGHEST MEAN SQUARE ERROR (RIGHT). ... 52
FIGURE 3.7: COMPARISON OF VARIANCE IN FOOT PRESSURE MEAN SQUARE ERROR (MSE) BETWEEN
REPEATS... 54
FIGURE 3.8: COMPARISON OF THE MEAN VARIANCE IN FOOT PRESSURE MEAN SQUARE ERROR (MSE)
REPRESENT THE MEAN VARIANCE DERIVED FROM INDIVIDUAL VALUES ACROSS ALL LEVELS OF
VISUAL CLUTTER. ... 55
FIGURE 4.1: DIAGRAMMATIC REPRESENTATION OF EXPERIMENTAL SET UP, INCLUDING THE
EYETRACKER, PRESSURE SENSITIVE TREADMILL, PROJECTOR, AND CURVED PROJECTION SCREEN. . 66
FIGURE 4.2: BACKGROUND IMAGES REPRESENTING THE TWO VISUAL CLUTTER LEVELS TESTED. VALUES
REPRESENT QUANTITATIVE ESTIMATION OF CLUTTER GENERATED USING THE CODE OF
ROSENHOLTZ ET AL. (2007) AS IN CHAPTER 3). ... 67
FIGURE 4.3: EXEMPLAR EYE TRACKING PROFILE SHOWING HORIZONTAL PUPIL MOVEMENT. SEGMENTS
MARKED ‘S’ INDICATE THE PORTIONS OF THE TRIAL WHERE THE TARGET IS STATIONARY AND GAZE
FIXATED. SEGMENTS MARKED ‘M’ INDICATE AREAS OF TARGET MOVEMENT, AND HENCE SMOOTH
PURSUIT (SP) OCCURRENCE. RED BARS INDICATE TRANSITIONAL POINTS, A BUFFER AROUND
WHICH DISCOUNTED ANY PRESSURE RECORDS MADE DURING TRANSITIONAL PHASES. ... 69
FIGURE 4.4: THE EFFECT OF THREE DIFFERENT CLUTTER LEVELS ON VARIANCE IN FOOT PRESSURE MEAN
SQUARE ERROR (MSE) DURING A DUAL VISUAL-AUDITORY TASK. ... 70
FIGURE 4.5: THE EFFECT OF TWO AUDITORY TASKS ON VARIANCE IN FOOT PRESSURE MEAN SQUARE
ERROR (MSE) DURING A DUAL VISUAL-AUDITORY TASK. ... 71
FIGURE 4.6: EXAMPLE FOOT PRESSURE RECORDS FOR EACH OF THE 10 SUBJECTS (1-10) DURING
SMOOTH PURSUIT TRACKING AGAINST THE SAVANNAH SCENE WHEN LISTENING TO MUSIC (A) OR
COMPLETING THE LANGUAGE TASK (B). THE PRINTS REPRESENTED IN EACH SET ARE THE MEAN
(LEFT) AND THE RECORD WITH HIGHEST MEAN SQUARE ERROR (MSE) (RIGHT)... 72
FIGURE 5.1 DIAGRAMMATIC REPRESENTATION OF EXPERIMENTAL SETUP INCLUDING PRESSURE
SENSITIVE TREADMILL, MOTION CAPTURE CAMERA SYSTEM. ... 84
FIGURE 5.2: REFLECTIVE MARKER PLACEMENT. NUMBERS CORRESPOND WITH EXACT ANATOMICAL
LANDMARKS DEFINED IN TABLE 5.1. MODIFIED FROM HKADIGITAL.CO.UK. ... 85
FIGURE 5.3: IMAGES OF THE CERVICAL AND LUMBAR BRACES USED IN THE EXPERIMENT. BRACES WERE
FIGURE 5.4: ANGLES (ᶿ) CALCULATED WERE THOSE BETWEEN A CENTRAL TRAJECTORY (A) AND A DISTAL
TRAJECTORY (B) AS IN TABLE 6.1. THE ANGLE MEASURED IS BASED ON THE INTERSECTION OF
VECTOR A-B WITH THE AXIS OF INTEREST (DEFINED BY A-C) HENCE THE POSITION OF THE DISTAL
TRAJECTORY B RELATIVE TO THAT AXIS DETERMINED WHETHER THE ANGLE WAS POSITIVE OR
NEGATIVE. ... 88
FIGURE 5.5: DIAGRAMMATIC REPRESENTATION OF SEGMENT ANGLES CONSIDERED. THIS INCLUDES
WHOLE ARM AND LEG ABDUCTION IN THE FRONTAL PLANE (A AND C RESPECTIVELY) AND UPPER
AND LOWER ARM AND UPPER AND LOWER LEG SWING IN THE SAGITTAL PLANE (B AND D
RESPECTIVELY). DIAGRAMS MODIFIED FROM MEDICALANATOMY.NET. E AND F REPRESENT
TRANSVERSE PLANE ANALYSIS OF SHOULDER AND PELVIC ROTATION RESPECTIVELY. DIAGRAM F
MODIFIED FROM BARTLEBY.COM/107/58. G REPRESENTS HEAD YAW(1), PITCH(2), AND ROLL(3) OF
WHICH HEAD MOVEMENT WAS ANALYSED WITH RESPECT TO THE RIGHT SHOULDER. DIAGRAM
MODIFIED FROM RESOURCESONBALANCE.COM. SEE TABLE 6.1 FOR EXACT ANATOMICAL
LANDMARKS. ... 89
FIGURE 5.6: COMPARISON OF VARIANCE IN FOOT PRESSURE MSE BETWEEN BRACED AND NON-BRACED
CONDITIONS. ... 91
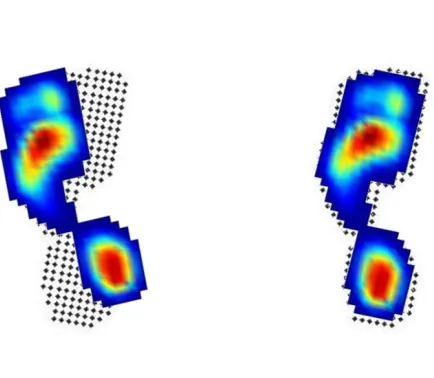
FIGURE 5.7: VISUAL COMPARISON OF FOOT PRESSURE RECORDS FOR ALL SUBJECTS (1-10) IN
NON-BRACED (A) AND NON-BRACED (B) CONDITIONS. IN EACH CASE THE MEAN FOOT PRESSURE RECORD
Table of Tables
TABLE 3.1: REPEATABILITY OF VARIANCE IN FOOT PRESSURE MSE FOR EACH COMBINATION OF
TRACKING TYPE (GF = GAZE FIXATION, SP = SMOOTH PURSUIT) AND CLUTTER TYPE (B= BLANK, S=
SAVANNAH, F= FOREST) IN SUBJECT 9. MEANS AND STANDARD DEVIATIONS ARE REPORTED FOR
EACH COMBINATION OF TRACKING TYPE AND VISUAL SCENE, AND FOR EACH REPEAT. ... 53
TABLE 5.1: BODY SEGMENTS (AS DEFINED BY PAIRS OF REFLECTIVE MARKERS) AND THE PLANES IN
WHICH THEIR MOVEMENT WAS ANALYSED. IN EACH INSTANCE THE MOVEMENT ANALYSED WAS
THAT OF THE DISTAL TRAJECTORY RELATIVE TO THE CENTRAL TRAJECTORY. NUMBERS IN
PARENTHESES CORRESPOND WITH MARKER NUMERATION IN FIGURE 5.2. ... 86
TABLE 5.2: RESULTS OF KINEMATIC ANALYSIS OF BODY SEGMENT RANGE OF MOTION (°). STATISTICAL
List of Abbreviations
* p ≤ 0.05
** p ≤ 0.01
ANOVA Analysis of Variance
c. Circa
cc Cubic Centimetres
CNS Central Nervous System
Ka Thousand Years Ago
Ma Million Years Ago
m/s-1 Metres per Second
ms Milliseconds
N/cm2 Newtons per centimetre
1 Introduction
1.1 Postural Control in Modern Humans
Postural control can be defined as the control of the position of the body in space in order to maintain stability and orientation (Shumway-Cook and Woollacott, 2000b). In this respect, orientation refers to the relationship between the segments of the body, and also the relationship between the body and the environment (Horak and Macpherson, 1996). Stability, or balance, refers to the ability to maintain the body in equilibrium: in other words, its movement is not significantly altered from the desired trajectory.
The maintenance of postural control therefore requires the integration of the central nervous system, musculoskeletal system, and sensory systems in order to generate an appropriate motor response. The highly complex interactions between these systems can be broken down into seven components to build a model of the postural control system (Cech and Martin, 2012). This includes limits of stability, sensory organisation, eye-head stabilisation, the musculoskeletal system, motor coordination, predictive central set, and environmental adaptation.
The perimeters of the base of support define the typical limits of stability. When body weight is maintained above the base of support (Shumway-Cook and Woollacott, 2000b) i.e. the centre of the body’s total mass is balanced above the area of the body in contact with the ground, posture can be maintained. Different postures have a different base of support. During quiet stance for example, the circumference of the circular area defined by anterior-posterior and medio-lateral sway over the ankles can be thought of as a ‘cone of stability’ which represents the limits within which standing posture can be maintained (Martin and Kessler, 2000).
in order to cue appropriate postural responses. Somatosensation, the combined sensory inputs of touch and proprioception (McKeon and Hertel, 2007), provides information from the lower limbs with regard to changes in pressure distribution under the feet (McKeon and Hertel, 2007), the length and tension of muscles, and activity at the ankle joint (Bray et al., 1999). The visual and vestibular systems are also crucial in providing information regarding movement of the environment and the head respectively. As the eyes must be able to maintain stability of the visual scene at all times, including as the head moves, the two act concurrently to ensure eye-head stabilisation so that vision is accurate and the head is stable in space (Cech and Martin, 2012). The importance and integration of all of the above senses is explored in more detail in chapter 1.3.
The musculoskeletal system is a highly complex mechanically linked system containing many muscles, joint, tendons, and ligaments. Normal muscle tone, the force with which a muscle resists being lengthened, is naturally present, and many muscles of the body are tonically active during quiet stance (Basmajian and De Luca, 1985). This includes the soleus and gastrocnemius since the line of gravity falls slightly forwards of the knee and ankle, and the thoracic erector spinae of the trunk because the line of gravity falls forwards of the spinal column (Basmajian and De Luca, 1985). As such, motor coordination is key in coordinating the appropriate activation of such muscles to preserve posture. This includes the use of muscle synergies, a functional coupling of a combination of muscles such that they act together as a unit, hence reducing the demands on the central nervous system (Shumway-Cook and Woollacott, 2000b). It also includes specific locomotor strategies aimed at maximising balance. Examples of both of which are described in chapter 1.4 below.
All of these factors of course ultimately depend on the exact environment and task at hand, and hence environmental adaptation is also an important component of postural control. For instance, if one sense is not providing accurate information regarding the position and movement of the body, then the input of the other senses will become more important (Horak and Macpherson, 1996). For example, somatosensory information will be less reliable on slippery or unstable surfaces, and therefore visual and vestibular information is likely to be more heavily relied on.
1.2 Types of Postural Control
Within this postural control system, four types of postural control have been defined: static, reactive, and anticipatory and adaptive postural control. Static postural control refers to the maintenance of the body’s centre of mass within the limits of the base of support (Shumway-Cook and Woollacott, 2000b). During quiet standing, postural control is considered static, although static posture in itself involves a natural degree of sway over the ankles as we maintain balance.
Reactive postural control compensates for unexpected perturbations to the centre of mass that might place it outside the base of support (Nashner, 1980). Depending on the magnitude of the perturbation, different postural movement responses are produced in response to the perturbation (Horak and Nashner, 1986). For example if the centre of mass was to be displaced to the left due to a slip, the weight shift over the left foot would be detected and automatic postural responses adjust posture to bring the centre of mass back to the right and into alignment with the base of support.
example, when planning to lift a heavy object we are aware of the load from prior experience, and hence can prepare our posture to be able to cope accordingly. In order to do this, information regarding the upcoming event based on past experiences is fed forward to the muscles involved in controlling posture and load distribution through the predictive central set to enable them to prepare for the action.
Finally, adaptive postural control allows for changes to be made to posture in response to current need (Cech and Martin, 2012), for example during environmental adaptation as described above.
The maintenance of stability therefore requires a delicate balance of systems to maintain a constant position of the centre of mass and minimise its displacement (McCollum and Leen, 1989). The vertical projection of such forces is known as the centre of pressure. The net centre of pressure lies between the feet during double support; however there is also a separate underfoot centre of pressure for each foot (Winter, 1995). Analysing the path of the underfoot centre of pressure can therefore provide considerable insight into how the body has maintained stability; for instance through the relocation of the centre of mass by coordinated movement of different body segments.
1.3 Sensory Inputs and Postural Control
1.3.1 Visuo-vestibular
restricting angular motions of the head, the ocular compensation required to maintain gaze stabilisation is also reduced. Thus, the body is able to maintain both balance and visual acuity during locomotion in a complex environment.
The importance of visual information in the control of standing balance has been known for many years, with the increased magnitude of postural sway observed when the eyes are closed argued to demonstrate the importance of visual inputs (Lee and Lishman, 1975, Edwards, 1946). However, more recently vision has been shown to take on an even greater role during locomotion due to the clear need to avoid obstacles and navigate safely (Grasso et al., 1998, Patla and Vickers, 1997). It therefore appears that by utilising information from ‘optic flow’ - the pattern of perceived motion of objects, edges, and surfaces in the visual field (Gibson, 1954) - gait characteristics such as speed (Konczak, 1994) and stride length (Prokop et al., 1997) are appropriately modulated for a situation or task at hand. Indeed, vision is the only sensory modality that can provide information concerning distant environmental features – hence, it can be used in a feedforward manner to make postural adjustments for upcoming obstacles and changes in direction (Hollands et al., 2002). This predictive and anticipatory role has been demonstrated in several situations, for example when making anticipatory eye movements prior to making a turn (Grasso et al., 1998), and when approaching (but not when stepping over) an obstacle (Patla and Vickers, 1997).
vestibulo-ocular reflex consists of components that compensate for both translational and rotational motions of the head. The translational vestibulo-ocular reflex is the phylogenetically younger of the two reflexes, and is only well described for humans and primates (Liao et al., 2010, Angelaki et al., 2000, McHenry and Angelaki, 2000). It is generally considered that the functional goal of the translational vestibulo-ocular reflex is to reduce retinal image slip, and reduce binocular disparities occurring in self-motion (Hess and Angelaki, 2003, McHenry and Angelaki, 2000).
Unlike the translational ocular reflex, The rotational vestibulo-ocular reflex is highly conserved throughout evolution (Angelaki, 2004), and is called upon to stabilise the whole of the visual field on the retina during head rotations by rotating the eyes in parallel with the axis of head rotation.
The optokinetic reflex is another highly conserved primitive motion sensing reflex that maintains a constant retinal position for images during movement. The optokinetic reflex can be observed in the majority of vertebrates with a mobile head or eyes (Huang and Neuhauss, 2008, Walls, 1962) and also in some invertebrates (Land, 1999). However, as it occurs over the entire retina, there is a resultant lack of visual acuity; thus it cannot provide information as to object identity. In humans the response is dominated by the more recently acquired fast optokinetic reflex (Cohen et al., 1981). The fast optokinetic reflex is closely associated with smooth pursuit eye movements (Barnes, 1993), the higher gain of which enables much more effective retinal image stabilisation (see below).
Other volitional eye movements evolved with the evolution of the fovea, the area of the retina where acuity is greatest (Carpenter, 1988), in order to extract more detailed information regarding the environment. The fovea is extremely small, with an angular diameter of just 0.3 and 2°; thus, the foveal depression only accounts for 1/4000th of the retinal surface (Steinman, 2003).
fovea to an object of interest, and hence ensure high clarity (Carpenter, 1988). As saccadic movements are not entirely accurate at about 5-10% of saccadic amplitude (Kowler and Blaser, 1995), they are often very quickly supplemented by smaller corrective saccades to ensure that the object is fully fixated. Furthermore, even when the eyes are fixed on the target, microsaccades of less than 0.5 degrees ensure that visual perception does not fade (Martinez-Conde et al., 2000)
1.3.2 Somatosensation
Visual and vestibular inputs are also supplemented by somatosensation which includes both the tactile and proprioceptive systems (McKeon and Hertel, 2007). The tactile system is associated with the senses of touch, vibration, and pressure, detected by mechanoreceptors including Merkels cells, Pacinian Corpuscles, Meissner’s Corpuscles, and Ruffini endings (Bray et al., 1999). As these cutaneous receptors are found within the feet, and hence are found at the interface between the body and the ground, they are considered important in the control of upright posture (Kavounoudias et al., 1998). Indeed, studies that have attempted to disrupt feedback from such receptors have demonstrated their contribution to the control of balance: for instance, research has shown that when vibration is applied to the soles of the feet during standing that involuntary whole body tilt is induced (Kavounoudias et al., 1998). Furthermore, studies have shown similar effects when cooling (McKeon and Hertel, 2007) or anaesthetising (Meyer et al., 2004) the receptors on the soles of the feet, reporting an observed decrease in postural stability.
Proprioceptive inputs include the sensations of changes in muscle length, muscle tension, and joint angles (McKeon and Hertel, 2007), and are measured by muscle spindles, joint afferents and Golgi tendon organs (McKeon and Hertel, 2007). Proprioceptive inputs provide feedback that is considered critical for automatic balance responses (Van Deursen and Simoneau, 1999, Kavounoudias et al., 1998): for example receptors in the legs provide information that can maintain posture via strategies discussed in more detail in chapter 1.4.
1.4 Motor Mechanisms for Postural Control
1.4.1 Reflexes and Muscle Synergies
Thus, after sensory inputs have been weighted depending on the environment, a range of automatic motor responses are generated to maintain balance. Inputs from the visual, vestibular, and somatosensory systems all influence ‘postural tone’: that is, the background activity of antigravity muscles that ensure the maintenance and fine-tuning of upright posture (Shumway-Cook and Woollacott, 2000b). For example, for continual fine tuning of posture, the vestibular inputs alter the distribution of postural tone in the neck and limbs in order to stabilise the head, and by association stabilise gaze.
This is achieved by two reflexes, the vestibulo-spinal reflex and the vestibulo-collic reflex (Massion and Woollacott, 1996). The vestibulo-spinal reflex consists of two sub-pathways, the lateral vestibulo-spinal tract and the medial vestibulo-spinal tract. The former stabilises upright posture through innervation of the extensor muscle of the legs (Pompeiano, 1972); the latter stabilises the position of the head in space through mediation of the vestibulo-collic reflex (Wilson and Schor, 1999, Iwamoto et al., 1996). Further, the somatosensory inputs in the neck also contribute to head stabilisation. The afferent sensory changes caused by changing neck position generate compensatory contractions though the cervico-collic reflex (Goldberg and Peterson, 1986) in order to stabilise the head on the body.
synergistically to correct for anterior-posterior instability (Nashner, 1977). Following detection of forward sway perturbation through somatosensory receptors in the legs and feet, activation of the gastrocnemius occurs at around 100 ms producing a torque to slow and reverse the forwards acceleration, which is then followed by activation of the hamstrings and paraspinal muscles to extend the hip and knees (Horak and Nashner, 1986). In response to backwards sway, the anterior tibialis is activated first, followed by the quadriceps and finally the abdominals. More recently, a lateral ankle strategy has also been proposed in which modulation of foot rollover is argued to be important in helping to quickly regain centre of mass stabilisation during medio-lateral perturbations, but also in fine-tuning through compensating for inaccurate foot placement (Hof et al., 2010). Another strategy that can be used in-place is the hip strategy (Horak and Nashner, 1986). Use of ankle strategies requires force generation in the muscles of the ankle joint and is most effective when on a stable support surface and the perturbation is small (Shumway-Cook and Woollacott, 2000b)
Another strategy that may be employed to counteract anterior-posterior imbalance is the hip strategy. The hip strategy produces large and rapid counter-acting motion at the hip, and may be implemented when perturbations are faster or larger or occur on unstable supports (Horak and Nashner, 1986). To counteract forward sway, the abdominals are first activated followed by the quadriceps. In instances of backwards sway, the paraspinal muscles are first activated followed by the hamstrings (Horak and Nashner, 1986). Both muscle synergies bring the centre of mass back into alignment with the base of support.
base of support and before the limits of stability are reached (Brown et al., 1999, McIlroy and Maki, 1993).
1.4.2 Human Gait and Balance Adaptations
Various combinations of the afore-mentioned strategies are used during standing posture, depending upon the boundaries in which they can safely be used (Horak and Nashner, 1986). However, balance is yet further compromised during locomotion. During 40% of the gait cycle the body’s weight is borne by entirely by one supporting limb (Sutherland et al., 1994), and hence the stabilisation of the body over the one limb in contact with the ground is critical to balance. A delicate balance of forces is therefore required to maintain a constant position of the centre of mass and minimise its displacement (McCollum and Leen, 1989). The vertical projection of such forces is known as the centre of pressure. The net centre of pressure lies between the feet during double support; however there is also a separate underfoot centre of pressure for each foot (Winter, 1995). Analysing the path of underfoot pressures can therefore provide considerable insight into how the body has maintained stability.
There is, however, debate as to whether these counter-rotations are advantageous at walking speeds. Bramble and Lieberman (2004) suggest that the benefits of the decoupling of body segments are linked only to running as they enable the control of destabilising torques in the aerial phase. They argue that during walking, the actions of the abductors and medial rotators of the hip of the stance leg are sufficient to control the inertially-induced rotation of the trunk. Conversely, there is evidence to suggest the recruitment of counter-rotations at walking speeds (Witte et al., 2004), and that axial rotation of the thorax increases with walking velocity (Feipel et al., 2001). This would suggest that although trunk rotations may be especially important at higher speeds, they are nonetheless advantageous during walking. Further, the lumbar lordosis of the spine enables flexion and extension of the trunk, and also absorbs body weight (Lovejoy, 2005). As the vertebrae also increase in mass caudally (Haeusler et al., 2002), this provides further adaptation to load-bearing.
Trunk counter-rotations are also aided by arm swing, the importance of which has been demonstrated both in terms of balance and energetic efficiency (Pontzer et al., 2009b, Li et al., 2001). This dual benefit of arm swing is a consequence of its active and passive components. Passive arm swing is driven by trunk rotation and the passive mass damper effect of the shoulders (Pontzer et al., 2009), thereby balancing the angular momentum produced by leg swing with minimal energetic input. However, if balance is threatened the passive component of arm swing may not be sufficient to maintain stability. Therefore, active arm swing is employed in order to increase the counter-torsional effects of arm swing when the passive component alone is insufficient (Pontzer et al., 2009). The effects of arm swing in reducing destabilising torques are increased by the broadness of the shoulders (Bramble and Lieberman, 2004).
trunk closer to the hip and position the lesser gluteal muscles at the side of the pelvis (Lovejoy, 1988). The result is that the trunk is able to tilt towards the supporting leg, providing greater stability and balance. Adaptations to high loads associated with bipedal posture are also seen in the lower limb, with large joints relative to body size (Jungers, 1988). Further, the high bicondylar angle of the femur (8-11°) (Aiello and Dean, 1990), positions the knee close to the body midline and thus helps balance the centre of mass above the base of support. 1.5 Adaptive Postural Control: Effects of Sensory Load and Attention
In order to be able to respond effectively to changes in the relationships between the body and the position of the surrounding objects in space, signals from all three sensory systems: visual, vestibular, and somatosensory must be integrated. As no one sense alone can provide accurate information regarding the movement of the body in space, the central nervous system must organise sensory inputs to generate the appropriate motor strategies for the conditions and task at hand.
It is in the parietal cortex where visual and vestibular information is integrated with that of the somatosensory system. In particular the inferior parietal lobule in Brodmann area 7 is heavily involved in the analysis and integration of higher order multi-modal integration. Neurons in area 7 process both body-referenced and world-referenced signals, and can hence provide an accurate image of the body’s position in space (Lynch, 1980). Indeed, the inferior parietal lobule is considered to act as a sensorimotor interface at which goal-directed motor actions are organised and planned (Fogassi and Luppino, 2005).
as traffic moving past, stability might be threatened by the sudden visual flow if balance was to remain strongly linked to visual inputs (Logan et al., 2010). In this instance, somatosensory and vestibular inputs become more important in maintaining an accurate picture about the body’s position within the environment and hence support upright equilibrium. Sensory reweighting therefore emphasises and de-emphasises sensory inputs based on the task at hand (Horak and Macpherson, 1996), in order to maintain stability. For example, the provision of tactile, visual, and auditory ‘perceptual anchors’ have been shown to reduce the level of postural sway induced by a visual motion stimulus (Meyer et al., 2013, Meyer et al., 2012) as postural control no longer remains heavily coupled to the moving visual stimulus.
However, despite this sensory reweighting, complex sensorimotor integration can still place considerable neurological demand on processing. Therefore, when there is conflict between postural control and other cognitive demands, motor responses must also be prioritised according to the most immediate need. The ability to prioritise tasks in this manner is controlled by executive function: the higher cognitive processes that generate and modulate behaviour based on sensory information (Lezak et al., 1995). One component of executive function is divided attention, or the ability to perform multiple tasks simultaneously (Lezak et al., 1995). The allocation of attention amongst tasks therefore impacts on how well they are performed.
secondary cognitive tasks have been shown to induce an increase in stride-to-stride variability (Taylor et al., 2013, Beauchet et al., 2005), a decrease in stride-to-stride length (Simoni et al., 2013, Taylor et al., 2013, O'Shea et al., 2002), and decreased walking speed (Simoni et al., 2013, Taylor et al., 2013, O'Shea et al., 2002).
Why then might subjects allocate attention to postural control and cognitive tasks differently? The nature of the task and environment, and prior experience my go some way to explaining these differences. For example, under most circumstances, visuo-motor responses are strongly coupled to postural control for the purposes of ensuring obstacle avoidance and recognising potential threats (Grasso et al., 1998). Hence, if the subject perceives strong risk in the environment they will likely prioritise these responses over a cognitive task. For instance, when walking on a narrow elevated walkway subjects allocated more attention to postural control than a cognitive task (Gage et al., 2003). However, if the task is simple and postural threat is low, healthy subjects with ample postural reserve will likely prioritise the cognitive task for as long as they perceive it safe to do so (Yogev‐Seligmann et al., 2012). It has also been shown that overlearned and skilled tasks place less demand on attention (Schmidt, 2008), and studies have shown that walking performance during dual-task scenarios can be improved with training (Silsupadol et al., 2009, Bherer et al., 2006). It is evident therefore, that the multi-modal control of posture is complex and highly dependent on the situation and complexity of task at hand.
1.6 Postural Control and Ageing
1.6.1 Sensorimotor Deficits Associated with Ageing
For instance, reduced visual function with ageing is known to alter eye
movement control (Knox et al., 2005, Spooner et al., 1980, Sharpe and Sylvester, 1978). An increase in the latency of eye movements including smooth pursuit eye movements (Knox et al., 2005) and saccades (Munoz et al., 1998, Fischer et al., 1997, Pratt et al., 1997, Sharpe and Zackon, 1987) has been observed when compared to younger controls. As it appears that the motor circuitry responsible for eye movements is quite resistant to the effects of age (Munoz et al., 1998, Vijayashankar and Brody, 1977), but that there is a general reduction in the ability of older subjects to detect and respond to visual signals (Willis and Anderson, 2000, Porciatti et al., 1999), it has been argued that age related decline in sensory processing may be somewhat responsible for such latencies (Knox et al., 2005). It has been shown that visual decline directly contributes to falls (Abdelhafiz and Austin, 2003, Ivers et al., 2000, Grisso et al., 1991) and increased mortality (Lee et al., 2002, Appollonio et al., 1995), even in the absence of overt eye pathology. Further, estimates suggest a total of almost 756,000 people living with age-related macular degeneration in the UK by 2020 (Minassian et al., 2011), which can further intensify the risks to postural control.
Also contributing to reduced balance control is the decline of the vestibular system. Indeed, after age 40 a 3% decline in the vestibular function is seen each decade (Schwartz, 2013), and a 37% reduction in vestibular neurons has been reported in elderly subjects when compared to younger counterparts (Bergström, 1973). Furthermore, the risk of vestibular disorders such as benign paroxysmal positional vertigo increases: at least a third of elderly individuals over 70 experience a period of such vertigo at least once (Rogers, 2010).
(Steiness, 1957) and the threshold for detection appears to be doubled at age 70 (Perry, 2006). Alongside these declines in tactile feedback, proprioceptive feedback is also affected by age, with the sensation of joint position reduced in the lower limbs (Skinner et al., 1984).
These sensory deficits are accompanied by a decline in motor abilities, increasing the risk of falls, impact injuries or inappropriate patterns of muscle contraction. Among contributing intrinsic factors are reduced joint mobility, in part due to mechanical deterioration at the joint surfaces and in muscle, tendon and ligaments. Alongside numerical loss of muscle fibres (Freemont and Hoyland, 2007), muscle strength has been shown to decline by 10-15% each decade after age 30, and as a consequence the resulting risk of falls increases (Paterson et al., 2007). Loss of spinal stability also leads to decreased range of spinal rotation, as observed during standing reach tasks and when twisting when sitting (Cavanaugh et al., 1999, Schenkman et al., 1996).
1.6.2 Balance Control in the Elderly and Infirm
Under normal circumstances, the sub-clinical symptoms of ageing do not affect function as long as the central nervous system can compensate (Woollacott, 1989); Hence, it is not uncommon for the elderly to maintain balance when rotating body segments, and even to perform turning tasks as well as young healthy subjects (Baird and Van Emmerik, 2009, Paquette et al., 2006).
walking, as performing both simultaneously is challenging (Lundin-Olsson et al., 1997).
The consequences of the increased difficulties in dealing with large sensorimotor load can be observed in the changes in gait patterns used by the elderly during locomotion. For example, some of the reported strategies observed during walking in the elderly include decreases in step length, velocity, and gait speed (Donoghue et al., 2013) and increased variability in the timing of steps (Menz et al., 2003). Generally speaking, a more conservative gait pattern has been described for elderly subjects, and is argued to be even more prevalent when the walking surface is irregular (Menz et al., 2003). This could well be in part due to the decreased somatosensory functions described above.
In the unhealthy elderly, these effects of normal aging can be further exacerbated. For example, visual deficits known to be prevalent in Parkinson’s disease include impaired visual acuity (Jones et al., 1992), contrast sensitivity (Langheinrich et al., 2000, Harris et al., 1992, Regan and Neima, 1984), and colour vision (Pieri et al., 2000, Price et al., 1992). In addition, visual attention and motion perception are also affected (Uc et al., 2005). During locomotion, these deficits manifest as an inability to maintain a straight trajectory, perceive obstacles and doorways, and negotiate uneven terrain, which in turn may lead to gait disturbance through festination, freezing and falls (Nutt et al., 2011).
It has long been known that the coordination of multiple motor components poses a challenge in Parkinson’s disease (Benecke et al., 1986). This is particularly prevalent in situations that involve coordinating separate motor tasks, for instance the transition between standing and initiating gait in a sit-to-walk task (Buckley et al., 2008). Typically, the head and trunk move en bloc
(Vaugoyeau et al., 2006), and pelvic rotation has been found to be limited (Vallabhajosula et al., 2013), possibly indicating loss of ability to uncouple shoulder and pelvic segments to produce effective trunk rotations. Axial rotations are also smaller and slower compared to healthy older adults (Vallabhajosula et al., 2013).
walk outside more often have been shown to be less functionally impaired (Kono et al., 2004), and hence it appears that increasing exposure to environmental situations can to some extent prevent some of the functional decline observed with ageing. These findings have clear implications for the design of urban environments, in order that they might optimise such benefits. 1.7 Postural Control and Human Evolution
1.7.1 The First Habitual Bipeds
It is clear that the control of balance and postural control in modern humans is highly complex, requiring a wide range of motor and sensory capabilities as well as large attentional resources to cope with the considerable cognitive demands. So when did the required motor and sensory skills appear within our evolutionary history?
It can be argued that the first evidence for the adoption of habitual bipedalism (i.e. where bipedal locomotion is the most common locomotor mode) can be associated with the genus Australopithecus. Perhaps the most well-known and most debated evidence for habitual bipedalism in archaic human ancestors comes from fossil evidence attributed to Australopithecus afarensis.
advances in inverse dynamics and evolutionary robotics have now demonstrated that Australopithecus afarensis (as represented by ‘Lucy’) was
not only compatible with fully erect bipedalism (Crompton et al., 1998), but that it would in fact have been energetically optimal, with the bent hip bent knee locomotion proposed by Stern and Susman (1983) subject to almost double the energetic cost (Sellers et al., 2005).
The AL-288-1 skeleton demonstrates several postcranial features suggesting significant adaptation to bipedalism. In the femur, this includes a high bicondylar angle implying that the leg would have been positioned close to the midline as in modern man (Johanson and Taieb, 1976). Further, the pelvis also exhibits features for efficient bipedalism, including short, wide iliac blades (McHenry, 1986, Stern Jr and Susman, 1983) which improve gluteal muscle lever arm and hence help counter the torque of body weight (Lovejoy et al., 1973). Despite this however, the morphological configuration of body segments in early australopiths is likely to have impeded the ability to rotate body segments independently of one another, in particular the head and shoulders, and trunk and pelvis. The ribcage had been thought to imply a funnel-shaped trunk as in chimpanzees (Schmid, 1991), although some suggest
However, the morphology of later species of australopiths are argued to be much more derived and closer to that of Homo and modern humans.
Australopithecus garhi for example was first discovered in the Middle Awash and dated to c 2.5 Ma (Asfaw et al., 1999). The BOU-VP-12/1 specimen demonstrates a human like humeral/femoral ratio (Asfaw et al., 1999), and crucially therefore marks the earliest appearance of the elongated femur that characterises Homo. When compared to Australopithecus afarensis therefore, the elongated femur would have increased step length and reduced inertial resistance to acceleration, making Australopithecus garhi a more efficient biped. In saying this, the forearm length was much like that of other australopiths (Asfaw et al., 1999), indicating that upper arm – lower arm proportions had yet to reach Homo-like proportions.
Arguably the most interesting evidence regarding the behaviour of
Australopithecus garhi, however, is that relating to tool-making ability and cognition. For a considerable length of time, many researchers regarded tool-making as an ability associated only with Homo, however the discovery of stone tools that correlate temporally and spatially with Australopithecus garhi (Semaw, 2000) has prompted serious reconsideration. Furthermore, Australopithecus garhi has also been associated with cut marks on bovid bones, indicating the use of stone tools in defleshing bones (De Heinzelin et al., 1999). It therefore seems that as early as 2.5 Ma, hominins were beginning to create and use primitive tools, made even more interesting by the fact that brain size had yet to increase to Homo-like proportions.
1.7.2 Homo – The Predominant Bipeds
Homo ergaster at c. 1.8 Ma, which is also associated with a move to more open country and savannah environments (Vrba, 1988). The Nariokotome Boy skeleton (KNM-WT 15000) found in Koobi Fora, Kenya (Brown et al., 1985) is human-like and is shown to have been a long distance striding biped capable of effective load carrying (Wang et al., 2004). It demonstrates all derived postcranial traits traditionally associated with such bipedalism, including short arms and long legs - the length of which are similar to those of modern humans (Ruff and Walker, 1993). Two intermediate pedal phalanges are also shorter and less curved than those of Australopithecus afarensis (Latimer et al., 1982, Day and Napier, 1964), which has been thought to suggest a more modern pressure distribution. Further, the narrower pelvis and barrel shaped rib cage (Jellema et al., 1993) indicates a move from the long funnel shaped trunk of australopiths, to a shorter barrel shaped trunk which would have aided balance through a higher position of the centre of gravity.
cognitive abilities would suggest that Homo ergaster was well equipped to actively exploit open grassland environments.
The distances over which early species of Homo ranged were yet further increased in Homo erectus, with fossil evidence indicating a very rapid dispersal out of Africa between 1.7 and 1.8 Ma (Antón et al., 2002, Gabunia and Vekua, 1995, Wanpo et al., 1995). Homo erectus demonstrates unequivocally human-like limb proportions, with femoral length indicating that overall leg length may have been up to 50% larger than in Australopithecus afarensis (Aiello and Dean, 1990). Further, the substantially larger articular surfaces of the joints of the hind limb when compared to Australopithecus also indicate adaptation to increased loading to impact forces at heel strike (Jungers, 1988). The presence of an elongate narrow waist (Jellema et al., 1993) would also have substantially increased the degree of independent rotation of the trunk from the pelvis in
Homo erectus, which would have been essential in counteracting the legs during running (Bramble and Lieberman, 2004). The dramatic reduction or absence of the extensive muscular connections between the head and shoulders (Aiello and Dean, 1990) when compared to australopiths would have also aided with balancing the destabilising torques produced by leg swing through counter-rotation of the shoulders and arms, and would have also reduced the axial rotation of the head.
when compared to australopiths, likely selected for as a consequence of its highly active lifestyle.
1.8 Summary and Gaps in Knowledge
The above discussion raises some important implications regarding the complex and adaptive nature of sensorimotor integration, and the demand it places on neuroprocessing, particularly from the perspective of healthy ageing and the infirm. It is clear that whilst visual inputs in particular are a crucial component of sensorimotor control, there is nonetheless a delicate balance and weighting of sensory information necessary for such control. This is especially the case in more demanding tasks such as dual tasking scenarios that are typical of everyday life. The emerging evidence for the potential use of feedback as a postural control mechanism may therefore be of particular interest in assisting those who may be particularly affected by complex environments. Although, the balance between the benefits and increased cognitive demands of sensory stimuli during locomotion and dynamic movements are yet to be fully established.
As humans are habitual bipeds, the sole contact that the human body has with the ground is through the plantar surface of the feet. Despite the clear importance this implies for detailing the interactions at this interface with the overall function of foot during gait, recent advances in foot pressure analysis only serve to emphasise the complexity of the issue. The longstanding method for plantar pressure measurement, ten region subsampling (Rosenbaum and Becker, 1997), involves analysing the foot as a series of defined areas, each of which is then allocated a single pressure value. However, with the recent development of techniques to analyse plantar pressures at a pixel by pixel level (Pataky et al., 2008), it has been shown that such subsampling may actually exaggerate or under-represent statistical differences when comparing pressure values. When also considering the very small numbers of pressure plate records typically used in pressure analysis using ten region subsampling, this would suggest a very poor representation of accurate pressure distributions, particularly when considering recent evidence that natural inter- and intra-subject variation in foot pressure distribution has shown to be high, even overlapping that of other apes (Bates et al., 2013b).
As a consequence, research continues to attempt to find novel solutions to determine the most likely modes of locomotion in our ancestors, particularly those species that had begun to make the transition from dense forest environments to more open grassland and savannahs. Notably this includes
Australopithecus afarensis, made famous by the 3.2 Ma ‘Lucy’ skeleton, which
possessed an apparent mosaic of features for both terrestrial bipedalism (Latimer and Lovejoy, 1989, Johanson et al., 1982) and arboreal locomotion (Stern Jr and Susman, 1983, Susman, 1983). Consequently, a number of theories have been put forward regarding the gait of Australopithecus afarensis
ranging from a chimpanzee-like bent hip bent knee gait (Stern Jr and Susman, 1983, Susman et al., 1984) to fully erect bipedalism much like that that of modern humans (Lovejoy et al., 2002, Crompton et al., 1998, Latimer, 1991). Although computer modelling techniques suggest that the latter is most probable (Crompton et al., 1998), as yet the changes in foot pressure distribution that might have accompanied the transition from arboreal locomotion in dense woodland to habitual bipedalism in open environments are yet to be considered.
Further, despite the known increase in the size of the semicircular canals in Homo (Spoor et al., 1994), and hence enhanced abilities for gaze and head stabilisation, the corresponding implications for adaptations in sensory processing that likely contributed to the efficiency of Homo erectus as a habitual biped, and its success as an endurance runner (Bramble and Lieberman, 2004) and persistence hunter (Carrier et al., 1984), have also as yet remained unassessed.
1.9 Research Question and Overarching Hypotheses
modern human analogues could provide novel insight into specific species of hominin which are surrounded by continuing debate.
As a consequence of the gaps in knowledge identified above, this project aimed to answer the following research question:
‘How might increased sensory demand and the recoupling of body
segments in modern humans impact on postural control, and what are the
implications with respect to the built environment, ageing, and the evolution of human postural control?’
From this research question, two overarching hypotheses were developed:
1) Sensory prioritisation during walking will result in alterations to
postural control as attention is allocated to secondary tasks of
varying complexity.
2) The recoupling of the head and neck, and trunk and pelvis, will
result in alterations to postural control as a consequence of the
increased rigidity of the thorax segments.
1.10 Thesis Outline
In order to test these hypotheses, this thesis has conducted a unique combination of foot pressure, kinematic, and eye movement analysis during walking. As such, it provides a unique contribution to knowledge of the impacts of sensory load and the restriction of body segments on human foot pressure variability. The results of the studies are relevant to both the evolution of bipedalism, and also to modern ageing.
Chapter 3 presents the results of a study assessing how foot pressure variability was affected by visual object tracking against varying levels of visual clutter. This involved the comparison of foot pressure records made during gaze fixation of a static object with those made during smooth pursuit against backgrounds of varying complexity.
Chapter 4 extends the object tracking task considered in Chapter 3 by incorporating a dual auditory task. This enabled the comparison of the impact of filterable background auditory stimuli with a repeat-back language task requiring an active response, and the potential effects of processing prioritisation on foot pressure variability.
Chapter 5 considered the effects of the restriction of independent counter-rotations of body segments on whole body kinematics and foot pressure variability through the use of medical body braces.
Chapter 2: Materials and Methods
This thesis set out with two overarching hypotheses in mind: 1) Sensory prioritisation during walking will result in alterations to postural control as attention is allocated to secondary tasks of varying complexity; and 2) The recoupling of the head and neck, and trunk and pelvis, will result in alterations to postural control as a consequence of the increased rigidity of the thorax segments.
In order to address these hypotheses, this thesis consisted of three studies involving the collection and analysis of foot pressure, kinematic, and pupil movement data. Of the three study chapters of this thesis, Chapters 3 and 4 investigate the first hypothesis, and Chapter 5 investigates the second. As the exact methods used for each study conducted as part of this project differ, this chapter presents an overview of the equipment, software, and data processing used. The exact protocols for each study are detailed within their own respective chapters below.
2.1 Equipment
Various pieces of equipment were used in the collection of data for this project. For all studies within this thesis, this included a Zebris FDM-T pressure sensitive treadmill (Isny im Allgäu, Germany) instrumented with an integrated sensor matrix for foot pressure measurement (Figure 2.1). This matrix consists of over 5000 sensors per 150cm x 50cm area, and hence provides a high quality and detailed record of foot pressures during walking. The treadmill was connected to a computer running the associated Zebris software, Win-FDM (Isny im Allgäu, Germany), through which data collection and processing was initiated.
patterns are captured. For each foot pressure record, a pressure value (N/cm2)
is recorded for each sensor in contact with the plantar surface of the feet.
Figure 2.1: Zebris-FDM foot pressure sensitive treadmill.
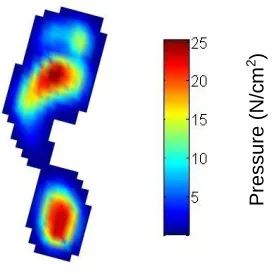
The resulting values for each pressure sensor are then displayed as a colour map image in order to represent diagrammatically the relative pressure distribution under the different areas of the foot. In each image, the largest pressure values are displayed as ‘hot’ colours, and the lowest pressure values are displayed as ‘cool’ colours (Figure 2.2). The treadmill was run at a frequency of 100Hz, and typically, for a subject walking at a slow, consistent speed of 1.1 m/s-1, around 200 foot pressure records were collected in a 2 minute trial,
Figure 2.2: Exemplar foot pressure record displayed as a colour map. Colour bar represents actual pressure (N/cm2).
When collecting kinematic data alongside foot pressure data to study the second hypothesis (specifically for Chapter 5), the trigger-out capability of the pressure sensitive treadmill enabled the automatic triggering of a 9-unit Qualisys ProReflex (Gothenberg, Sweden) motion capture camera system when foot pressure recording was initiated. This therefore allowed for accurate synchronisation when capturing foot pressure and kinematic data. In order to collect accurate 3D kinematic data, the motion capture camera system must first be calibrated. Using the Qualisys Track Manager (QTM) software (Gothenberg, Sweden), an X,Y,Z coordinate system is defined using a stationary calibration frame, over which a calibration wand is moved to define the volume of the experimental area and hence calibrate the system (Figure 2.3). When a series of Qualisys 19mm retro-reflective markers (Gothenberg, Sweden) are then attached to anatomical landmarks on the body of a subject, they reflect back the infra-red light emitted by the cameras (Figure 2.4). As the cameras detect these reflections, the system is then able to calculate the global coordinates of each marker at a frequency of 100Hz (matching that of the treadmill), providing an accurate record of the movement of body segments of interest.
P
re
ssu
re
(
N/c
m
[image:48.612.216.352.71.208.2]Figure 2.3: Example of the X,Y,Z coordinate system as seen in QTM. During processing, QTM shows the relative position of the motion capture cameras to the subject, a few of which are seen from this angle. Each green dot represents a reflective marker positioned on an anatomical landmark on the subject.
Figure 2.4: Infrared light emitted by the motion capture cameras is reflected back from retro-reflective markers attached to anatomical landmarks on the subject. The global coordinates for each marker are then tracked.
[image:49.612.202.454.379.581.2]measure pupil movement. Two different models of eyetracker were used in this project.
The first was a monocular eye-tracking system, the Eye-trac 5000, Applied Science Laboratories (ASL) (Bedford, MA, USA), mounted on a Bauer HH1000L Ice Hockey helmet (Exeter, NH, USA). This system tracks eye movement using similar principles to that of the motion capture camera system. An infrared video camera is directed at the pupil, the light from which is reflected off the corneal surface (known as the specular reflection) and is detected by the camera.
The second was a binocular eye-tracking system, the ViewPoint BSU07 USB-60x3, Arrington Research (Scottsdale, AZ, USA), mounted on a goggle-based system. In this case, the system uses a ‘dark pupil’ approach in which the video cameras directed at the eyes are able to distinguish the pupils based on colour depth. Once defined the cameras then track the movement of the entire pupil. Despite differences in the methods of tracking between the systems, both provide the XY coordinates of the pupil(s) throughout a trial. Both therefore generate an accurate representation of pupil movement in both the horizontal and vertical planes.
2.2 Data Processing
2.2.1 Pupil Movement
pressure data, the primary dependent variable for all experiments conducted within this thesis (see chapter 2.2.2 for description).
In order to utilise the pupil movement data for a trial, it was first exported in TSV format into MATLAB. Because of the differences in the format of the data files generated by the two eyetrackers, two slightly different versions of code were written to read in pupil movement data and to identify the timings for each period of each gaze tracking type. For the monocular Eye-Trac system, horizontal pupil positon was read in from the TSV file and a figure generated with horizontal pupil position at each frame of capture plotted as a line graph (Appendix A1.1). Using a series of crosshairs, each exact transitional point on this graph was marked to identify the points at which the subject switched between gaze fixation and smooth pursuit and vice versa (Figure 2.5). The frame numbers for each selected point were then returned and could then be manually converted to a value in seconds. For example, if the first exact period of gaze fixation occurred between frames 1 and 1200 frames, this was equivalent to the first 20 seconds of the trial (1200 frames / 60Hz = 20 seconds). The timings in seconds were then stored in a variable named ‘CutPoints’.