White Rose Research Online URL for this paper:
http://eprints.whiterose.ac.uk/4980/
Monograph:
Harland, K. and Stillwell, J. (2007) Commuting to School in Leeds : How useful is the
PLASC? Working Paper. The School of Geography, University of Leeds
School of Geography Working Paper 07/02
Reuse
Unless indicated otherwise, fulltext items are protected by copyright with all rights reserved. The copyright exception in section 29 of the Copyright, Designs and Patents Act 1988 allows the making of a single copy solely for the purpose of non-commercial research or private study within the limits of fair dealing. The publisher or other rights-holder may allow further reproduction and re-use of this version - refer to the White Rose Research Online record for this item. Where records identify the publisher as the copyright holder, users can verify any specific terms of use on the publisher’s website.
Takedown
If you consider content in White Rose Research Online to be in breach of UK law, please notify us by
(Working Paper 07/02)
Commuting to School in Leeds:
How useful is the PLASC?
Kirk Harland and John Stillwell
Version 1.0 May 2007
School of Geography, University of Leeds,
Leeds, LS2 9JT, United Kingdom
Children’s daily travel behaviour is dominated by the journey to school. In some cases, this movement takes only a few minutes and involves no means of
transport other than foot; in other instances, the journey can be over substantial
distances, be extensive in duration and involve some form of public or private transport. The combination of journeys taking place is likely to have a
substan-tial impact on traffic congestion, particularly since the morning peak coincides
with that associated with the journey to work. What datasets exist that allow us to measure and understand this behavour?
The National Pupil Database (NPD) is a relatively new information system that
contains data collected through the Pupil Level Annual School Census (PLASC) since 2001 - 2002 academic year that can be used to identify where every
stat-educated school pupil is living and, as a consequence, what the spatial dynamics
of commuting to school are. By examining the PLASC data for a Local Authority (LA) (Education Leeds), the paper seeks to explain what variables are available and how interaction data are identified. Moreover, the paper demonstrates a series of rigorous data validation checks and a suite of interpolation methods for estimating
data that are either incorrect or unknown. In order to accomplish this, a database
structure that allows annual PLASC data files to be linked together and to other school dataset is required. The database system and checking /interpolation
meth-ods described here provide a model forEducation Leedsand other LAs to follow.
Whilst the paper stops short of reporting any spatial analysis of the data contained in the Leeds system, it does acknowledge the commuting data that are available
for Scotland from the 2001 Census Special Travel Statistics (STS) but advises that
the investment in developing the PLASC data is likely to be more worthwhile than lobbying Office for National Statistics (ONS) to extend the STS in 2011 beyond
Scotland to the rest of the UK.
Acknowledgements
This paper has been produced as part of an ESRC CASE postgraduate
stu-dentship funded by the ESRC and Education Leedsand we acknowledge this
fi-nancial support. We are also grateful toEducation Leedsfor the supply of PLASC
and other datasets, and to Heather Eyre in particular, for her continued advice and
Contents
1 Introduction 1
2 The National Pupil Database and Pupil Level Annual School Census 2
3 Data Supplied byEducation Leeds 7
3.1 PLASC data . . . 7
3.2 Supplementary data . . . 11
3.3 Database design . . . 13
4 Content of the PLASC Data 20 4.1 PLASC school and teacher data . . . 20
4.2 PLASC variables . . . 23
4.3 PLASC variable changes . . . 26
4.4 PLASC errors and omissions . . . 30
4.4.1 Data omissions . . . 32
4.4.2 Data errors . . . 36
4.4.3 Coordinates checks . . . 38
4.4.4 Summary of data cleaning . . . 43
4.4.5 Checks over time . . . 44
4.4.6 Bias detection . . . 48
4.5 PLASC data summary . . . 49
5 Commuting Data from the 2001 Census Special Travel Statistics (STS) 52 6 Conclusions 56
List of Figures
1 National Pupil Database tables overview, December 2006 . . . 42 National Pupil Database datasets and linkage, December 2006 . . 6
3 Entity Relationship Diagram of the Leeds study area database . . 15
4 Pupil coordinates geocoded using OS Address-Point . . . 40
5 Pupil location verification method . . . 41
1 The structure of the pupil level PLASC tables supplied by
Educa-tion Leeds, 2001-2006 . . . 8
2 Excel spreadsheets containing data supplied byEducation Leeds . 12 3 Tabular realisation of entities and origin of data content . . . 18
4 School intake types . . . 21
5 School governance codes . . . 22
6 Number of schools by phase and year . . . 23
7 Teacher category codes . . . 23
8 National Curriculum year groups and corresponding pupil ages . . 24
9 First language codes . . . 25
10 Ethnicity codes used in Population Census 2001 and PLASC 2001/02 and 2003/06 . . . 27
11 SEN status codes . . . 28
12 Generic SEN status codes to be used for yearly comparison . . . . 29
13 Enrolment status codes . . . 29
14 SEN type codes . . . 30
15 Record counts for the PLASC pupil tables . . . 32
16 Ommisions from the PLASC pupil tables for pupils of compulsory school age . . . 33
17 Unique Pupil Number (UPN) and location attribute omissions from the PLASC pupil tables before and after data interpolation . . . . 35
18 Pupils not of compulsory school age and with invalid postcodes . 37 19 Pupil coordinate precision . . . 43
20 Summary of valid pupil records in the PLASC pupil tables . . . . 44
21 Individual field temporal inconsistencies in the PLASC pupil tables 45 22 Count of pupil records by multiple temporal inconsistencies in the three ‘key’ fields . . . 46
23 Temporal inconsistencies in the PLASC pupil tables after temporal interpolation . . . 47
24 Summary statistics for the excluded pupil records . . . 48
25 Summary of the PLASC pupil records . . . 50
26 Geographical unit levels for 2001 Census SMS/SWS/STS data . . 53
Glossary of Terms
AFPD All Fields Postcode Directory
CMPO Centre for Market and Public Organisation
DfES Department for Education and Skills
ERA Education Reform Act
ERD Entity Relationship Diagram
ESRC Economic and Social Research Council
FSM Free School Meal
LA Local Authority
NPD National Pupil Database
OA Output Area
OFSTED Office for Standards in Education
ONS Office for National Statistics
OOP Object Orientated Programming
OS Ordnance Survey
PLASC Pupil Level Annual School Census
PLUG PLASC/NPD User Group
SCAM Small Cell Adjustment Method
SEN Special Education Need
SILC Special Inclusive Learning Centre
SMS Special Migration Statistics
SQL Structured Query Language
STS Special Travel Statistics
SWS Special Workplace Statistics
1. Introduction
Commuting to School in Leeds: How Useful is the PLASC?
1
Introduction
Education provision and performance vary across the world. Whilst the focus in
developing countries is on making basic education available to everyone, the
sub-ject of education in the most developed nations has become more politically
ori-entated with, for example, debates about accessibility to state schools through
ad-missions procedures and ethnic and social segregation in schools (Gorard & Fitz,
2000; Johnston et al., 2005). Researchers in the UK have now begun to examine
issues such as the critical relationships between demographic trends and school
places and the links between schools and house prices in school territories.
Geographers have long been interested in identifying and explaining the spatial
dimensions of education using indicators such as personal qualifications and
exam-ination attainment. Much less attention has been paid by researchers to the way in
which the demand for schooling at different age levels is met by the supply of
pri-mary and secondary schools and the consequences for pupils commuting between
their place of residence and their place of study under particular admissions
pol-icy regimes. Estate agents report that education is now one of the most important
reasons why people move house. Freedom of school choice, introduced by Labour
under the 1988 Education Reform Act (ERA), means that perceived good schools
become oversubscribed, creating major problems for the schools concerned and
for their LA when it comes to formulating fair admissions policies. One
conse-quence has been the relative increases in the house prices in areas with perceived
good schools. More affluent parents have moved closer to ensure access to school
places for their children at perceived good schools, thus creating less opportunities
for places to be assigned to those pupils from less affluent families. The situation
is causing LAs to consider using electronic balloting or lottery-style methods of
allocating children to schools and there is considerable political interest and press
coverage of this issue at the moment across the UK.
It is also pertinent to recognise the importance that this Government attaches to
evidence and particularly to ‘evidence-based policy making’. This means that
in-formation which can be derived from the analysis of reliable data about the demand
Na-tional Center for Education Statistics (NCES) collects and collates a multitude of
surveys and longitudinal data for education at elementary, secondary and
postsec-ondary levels, including fiscal and non-fiscal data at pupil, school and state level.
In England and Wales, the Department for Education and Skills (DfES) collates
education data into a central database called the National Pupil Database (NPD).
This paper takes a closer look at the NPD and the pupil level data collection
Pupil Level Annual School Census (PLASC), with a view to using the latter for
analysis of the magnitude, composition and spatial patterns of commuting to school
in Leeds since 2001, which is the particular focus of our research. In fact, the
PLASC datasets described in Sections 3 and 4 of the paper are those data supplied
by the Local Authority (LA),Education Leeds, and are supplemented by other sets
of data on schools, attainment and preferences. The paper aims to clarify the
na-ture and content of the Leeds PLASC data and to demonstrate how essential it is to
check and clean the data prior to its analysis. The structure of the database that has
been designed for storing, linking and checking the various datasets provided by
Education Leedsis outlined in Section 3 whilst the methods used for verification and interpolation are explained in detail in Section 4 of the paper. This section
is likely to be of particular interest toEducation Leedsand to other LAs lacking sufficient resources to commit to data validation processes. The paper does not
include any spatial analysis of the PLASC data for Leeds; preliminary analysis is
reported in Harland & Stillwell (2007). However, the detailed documentation of
PLASC data contained in this paper does provide the opportunity for some
com-parisons to be made with travel to study data available from the 2001 Census of
Population for Scotland and allow conclusions to be drawn about whether Special
Travel Statistics (STS) in 2011 might usefully be extended to cover the rest of the
Great Britain. We begin, however, with a synopsis of the national context of data
collection in this sector.
2
The National Pupil Database and Pupil Level Annual
School Census
The NPD is a relatively new dataset created in 2002 and contains individual pupil
records for all state educated school children (Ewens, 2005). It is updated on an
2. The National Pupil Database and Pupil Level Annual School Census
by each LA in England and Wales and is maintained by the DfES (Jones & Elias,
2006). Access to the NPD has recently been provided through a central gateway
funded jointly by the DfES and the Economic and Social Research Council (ESRC)
and managed by the Centre for Market and Public Organisation (CMPO) at the
Uni-versity of Bristol where the PLASC/NPD User Group (PLUG) is based (Burgess
et al., 2006). The NPD is stored in a relational database structure with several
different datasets capable of being linked together using either a UPN or a unique
establishment identification number to allow for both temporal and cross-sectional
analysis, creating a powerful information resource for policy formulation (Jones &
Elias, 2006).
Completion of the Pupil Level Annual School Census (PLASC) is statutory for
all state maintained primary, secondary and special schools under section 537A of
the Education Act 1996 (Jones & Elias, 2006). The DfES began collection of the
data in 2002 and it now forms the cornerstone of the NPD. Individual schools are
required to submit a PLASC return to the LA on the third Thursday of January each
year. The return consists of entries for every pupil on role with data such as home
postcode, ethnicity, Special Education Need (SEN) status and Free School Meal
(FSM) eligibility, plus information relating to the school and its staff. In actual fact,
the data collection of pupil information is no longer referred to as PLASC because
a tri-annual data collection procedure called the School Census with a modular
structure was introduced in 2006 for secondary schools and will be introduced in
2007 for primary schools (DfES, 2006b). One of the three data collections will still
be carried out in January, with two further collections on the third Thursday in May
and the third Thursday in September augmenting the January collection (DfES,
2006a). The tri-annual data collections coincide with the three school terms and
will enable more effective tracking of pupil migrations; specifically moves between
homes and moves between schools, throughout the year.
On receipt of the PLASC data in January each year from 2002 to 2006, the
Leeds LA collated all the entries from individual schools and carried out data
val-idation. Details relating to the collection of PLASC data in Leeds were obtained
during meetings withEducation Leedsdata management staff. Commonly
occur-ring problems detected in the validation process include duplicate pupils in the
dataset, especially when a pupil has changed school mid-year and appears to be
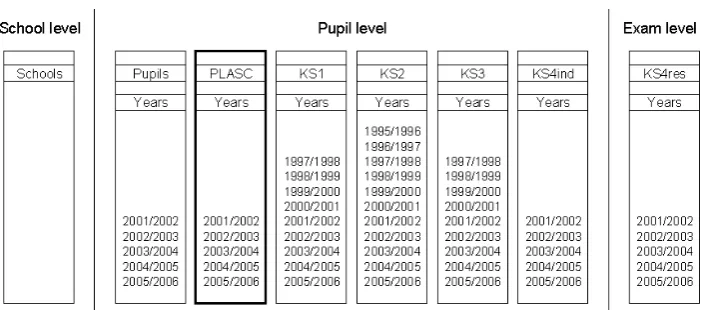
Figure 1: National Pupil Database tables overview, December 2006
Source: adapted from Jones & Elias (2006, p.7)
does not match an expected list and data omissions where no entry is made. These
issues are referred back to the schools concerned for rectification. This was, and
still remains for the tri-annual collection, an iterative process until the data are as
robust as possible. On completion of the data checks by the LA, the PLASC data
are submitted to the DfES in March for further cross-LA border validation,
initi-ating another round of iterative data corrections to rectify any issues pertaining to
multiple LAs. The most frequently occurring problems at this stage are pupils that
have moved schools, leaving a school in one LA to attend a school in a different
LA area and are shown to be attending both institutions in different LA areas at
the same time. After compilation into a national PLASC dataset by the DfES, the
collected data are integrated into the NPD tables where they can then be linked to
the other data tables at school, pupil and exam level (Figure 1) through the use of
the UPN and the unique establishment identification number.
The varying number of years of collected data tables can be seen in Figure
1 which also shows how the tables in the NPD are represented at three different
levels. At theschool level, only one table exists and this holds data relating to individual schools such as school capacity, number of computers and number of
staff by qualification. At the pupil level, six tables exist, each holding data for pupils at the different stages of their school careers. The ‘Pupils’ table is a master
table holding information on every pupil appearing in the NPD. This differs from
the ‘PLASC’ table because not every pupil in the NPD attends a state school and
2. The National Pupil Database and Pupil Level Annual School Census
Pupils attending independent schools sit some, if not all, of the Key Stage
ex-aminations and therefore must have a recorded UPN to enable linking between
ta-bles. Pupils may also move out of the state education system into private education
at some point in their schooling and it is important that the NPD be structured in a
way that allows these moves to be tracked. Therefore, the ‘PLASC’ table contains
only pupils from the state education system at the point in time when the data were
collected, and the ‘Pupils’ table contains a record of all pupils in the NPD, both in
the state sector and in the private sector. Each of the Key Stage (KS) tables records
the results of Key Stage tests at the individual pupil level. Theexam levelhas only one table which contains data relating to exam results at a school level rather than
at the individual pupil level. KS tables have been collected since 1995/96 whilst
PLASC tables were first assembled in 2001/02.
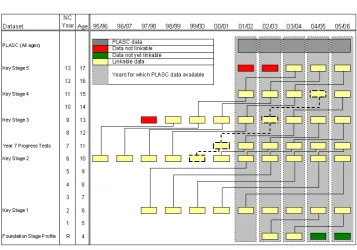
Figure 2 is an alternative representation of the datasets held in the NPD but in
this case the individual years of data are represented by coloured blocks. Figure 2
shows that ‘Key Stage 2’ (‘KS2’ in Figure 1) is the dataset with the most years of
collected data and the ‘Foundation Stage Profile’ is the dataset with the least.
Ad-ditionally, Figure 2 also shows how each dataset links to others within the database
building up the temporal dimension. Note that to follow a cohort of pupils through
the database, it is not a simple task of linking one collection year to the next as
the KS tables are collected with different time spans between them. For example,
following the path highlighted by the dashed lines shows that the link between Key
Stage 4 results tables collected in ‘04/05’ and Key Stage 3 results for this
partic-ular cohort of pupils skips the collection year ‘03/04’ and links to collection year
‘02/03’. This is because the Key Stage 3 tests are taken in year 9, two years before
the Key Stage 4 tests taken in year 11. Following the path back further to the link
between the year 7 progress tests and the Key Stage 2 tests, it can be seen that the
link is just one year as the tests are taken in successive years.
This example illustrates the complex nature of the linkages between the
differ-ent datasets with differing time spans between tests and datasets having differing
numbers of years of recorded results (some starting in 1995/96 and some as late
as 2002/03). This has lead to data in certain years being unable to be linked to
result tables in other datasets within the database, limiting the temporal aspect of
any analysis performed on this early cohort of pupils. The unlinkable datasets are
Figure 2: National Pupil Database datasets and linkage, December 2006
Source: adapted from Jones & Elias (2006, p.6)
is not linkable to the PLASC dataset. The datasets highlighted in green are unable
to be linked in 2006 but will become linkable in subsequent years as new data are
added for 2006/07, 2007/08 and so forth.
PLASC and the master ‘Pupil’ table form one part of the NPD holding the pupil
characteristics and the UPN. The second half of the NPD is constructed using the
attainment tables Key Stage 1 through to Key Stage 5 (represented by the ‘KS1’,
‘KS2’, ‘KS3’ and ‘KS4ind’ tables in Figure 1). “In particular, the attainment data
includes
• Levels attained in reading, writing and mathematics at Key Stage 1;
• Levels attained and the marks achieved in English, Mathematics and Science
at Key Stage 2 and Key Stage 3;
• GCSE or equivalent results;
• AS and Advanced level results.” (Jones & Elias, 2006, p.5).
The PLASC data collection and the master ‘Pupil’ table combined with the
3. Data Supplied byEducation Leeds
as 1995/96 for some of the datasets, the ever-increasing longitudinal search and
analysis possibilities play an important role in educational model formulation as
noted by Jones & Elias (2006, p.6). “Statistically, such data allow for more
pre-cise formulation of models to consider the effect on educational outcomes of, say,
pupil attributes or circumstances, policy interventions, and so on.” Furthermore,
Ewens (2005, p.4) comments that “the National Pupil Dataset is amongst the most
important national innovations in data collection in the recent past. Its potential
is considerable and the scope for development is also considerable.” However, he
also notes that the NPD is still a relatively new and unknown dataset and holds
many pitfalls for inexperienced or ‘unwary’ users.
3
Data Supplied by
Education Leeds
3.1 PLASC data
Whilst Section 2 has introduced the national database in which the PLASC are
embedded, the PLASC data utilised in this study have been supplied byEducation
Leedsfor six years, 2000/01 through to 2005/06. The data have been supplied in a Microsoft Access database with data for each year in a separate table that contains
the fields as shown in Table 1. It is evident that not all fields are present across
all years of the PLASC data and not all field types are consistent across the years
when they are present. However, it is possible to convert the inconsistent data types
using either explicit or implicit ‘cast’ functions without loss of data to ensure data
compatibility in the temporal dimension. Cast functions are native functions in
a programming language and are designed to convert data from one datatype to
another datatype with minimal data loss.
The building of longitudinal properties of the pupil data collection provides
for powerful analysis of the data, especially when considering policy formulation
and its impacts. However, the structure of the data must be stable throughout the
duration of collection, otherwise it is possible to introduce truncation of data items
leading to possible loss of data and inconsistencies across years. The PLASC data
for Leeds are currently stored in a Microsoft SQL Server database atEducation
Leedsas one part of a much wider data resource for the Leeds Metropolitan Dis-trict, in addition to their integration in the NPD. The data supplied for this study
for-Communting to School in Leeds: Ho w useful is the PLASC? Dummy Pupil ID Number (LONG) Dummy Pupil ID Number (LONG) Dummy Pupil ID Number (LONG) Dummy Pupil ID Number (LONG) Dummy Pupil ID Number (LONG) DUMMY PUPI Number (Double) DFEE Number (DOUBLE) Estab Number (LONG) Estab Number (INTEGER) Estab Number (INTEGER) Estab Number (INTEGER) ESTAB Number (DOUBLE)
YEAR Text(5)
Actual- NC-YearGrp
Text(2)
NCYear-Actual
Text(255)
NCYear-Actual
Text(2)
NCYear-Actual
Text(2)
NCYEAR-ACTU Text(2) DATE-OF BI Date/Time Dateof-Birth
Date/Time DOB Date/Time DOB Date/Time DOB Date/Time DOB Date/Time
GENDER Text(10) Gender Text(1) Gender Text(255) Gender Text(1) Gender Text(1) GENDER Text(1)
ETHNI-CITY
Text(10)
Ethnic-Group
Number
(BYTE)
Ethnicity Text(255) Ethnicity Text(4) Ethnicity Text(4)
ETHNI-CITY
Text(4)
MOTHER-TON
Text(10)
Mother-Tongue
Text(3)
First-Language
Text(255)
First-Language
Text(3)
First-Language
Text(3)
FIRST-LANGU
Text(3)
MEAL Text(10)
Free- School-Meal
Text(1)
FSM-Eligibility
Text(255)
FSM-Eligibility
Text(1)
FSM-Eligibility
Text(1)
FSM-ELIGIBI Text(5) DATE-OF AD Date/Time Dateof-Joining Date/Time Entry-Date Date/Time Entry-Date Date/Time Entry-Date Date/Time ENTRY-DATE Date/Time POST-CODE
Text(10)
Home-Postcode
Text(8) Postcode Text(255) Postcode Text(8) Postcode Text(8)
POST-CODE Text(8) XCOORD Number (DOUBLE) X Number (DOUBLE) X Number (DOUBLE) x Number (DOUBLE) X Number (DOUBLE)
X Text(50)
YCOORD Number (DOUBLE) Y Number (DOUBLE) Y Number (DOUBLE) y Number (DOUBLE) Y Number (DOUBLE)
Y Text(50)
SEN-Stage
Text(1)
SEN-Status
Text(255)
SEN-Status
Text(1)
SEN-status
Text(1)
SEN-STATUS
Text(1)
Registra-tionType
Text(1)
Enrol-Status
Text(255)
Enrol-Status
Text(1)
Enrol-status
Text(1)
ENROL-STATU
Text(1)
InCare Text(255) InCare Text(1) InCare Text(1) INCARE Text(5)
Primary-SENType
Text(4)
Primary-SENType
Text(4)
PRIMA-RYSEN
Text(4)
Secondary-SENType
Text(4)
Secondary-SENType
Text(4)
SECON-DARYS
Text(4)
[image:15.595.102.739.79.516.2]3.1 PLASC data
mat. Despite the supplied PLASC data tables originating from the same source,
the methods of extraction must have been inconsistent to produce the difference in
data types between the fields shown in Table 1.
The first field shown in Table 1 for all years is ‘Dummy Pupil ID’ (truncated
to ‘DUMMY PUPI’ in year 2006). This field has a datatype of ‘Number (LONG)’
for all years except 2006 where it has a datatype of ‘Number (DOUBLE)’. Each
datatype requires a specific amount of computer memory space be set aside to
ac-commodate the data that datatype variables or fields will contain. A common
mis-use of datatypes in databases is to set fields to be a datatype requiring more
com-puter memory space than is actually necessary. This process artificially increases
the database size and slows down any queries performed on the database (Self &
Dunckley, 2003a). Thus, it is important to standardise all tables that hold
simi-lar data using the appropriate datatypes to represent the data during the database
design phase.
The most common difference across the PLASC tables is the length
associ-ated with text field datatypes. In 2003, all the text datatype fields are set to 255,
the maximum length for a text field in Microsoft Access and also the import
wiz-ard default. The inconsistency that would cause the most disruption to analysis is
the change of datatypes between the coordinate fields from ‘Number (DOUBLE)’
through years 2001 to 2005 to ‘Text (50)’ in year 2006. Any attempt to geocode
the home locations for the pupils in year 2006 without first altering the datatype of
the coordinate fields would fail, due to them not being a numeric datatype.
Table 1 summarizes the structure of the PLASC data provided byEducation
Leeds. The list below expands the description of each field, whilst the content of the tables will be considered in more depth in Section 4. The variables available in
all years are as follows:
Dummy Pupil ID/DUMMY PUPI henceforth referred to as the UPN and, as with
the original UPN, this tracks a child through their school career, allowing
temporal analysis. The original UPN has been replaced with a dummy UPN
in order to ensure that pupil records are untraceable and thus meet the strict
data disclosure policies ofEducation Leeds.
Generic field name ‘UPN’.
DFEE/Estab/ESTAB is the unique identification number associated with the
Generic field name ‘Estab’.
YEAR/ActualNCYearGrp/NCYearActual/NCYEARACTU refers to the actual
year group of schooling the child is currently attending.
Generic field name ‘NC Year’.
DATE OF BI/DateofBirth/DOB is the pupil’s date of birth.
Generic field name ‘DOB’.
GENDER/Gender is the pupil’s gender.
Generic field name ‘Gender’.
ETHNICITY/Ethnicity/EthnicGroup is the coded representation of the pupil’s
ethnic orientation. The code structure changed in 2003, moving from a 14
category structure to a 20 category structure that is comparable with the
eth-nicity code structure used in the 2001 Census.
Generic field name ‘Ethnicity’.
MOTHER TON/MotherTongue/FirstLanguage/FIRSTLANGU is the pupil’s
main language and is coded into six categories.
Generic field name ‘First Language’.
MEAL/FreeSchoolMeal/FSMEligibility/FSMELIGIBI is a flag that relates to
the pupil’s eligibility to claim a Free School Meal (FSM), although this does
not identify that the pupil actually takes up the FSM.
Generic field name ‘FSM’.
DATE OF AD/DateOfJoining/EntryDate/ENTRYDATE is the date the pupil
began attending the institution referred to in the DFEE/Estab field.
Generic field name ‘Entry Date’.
POSTCODE/HomePostcode/Postcode is the pupil’s home postcode.
Generic field name ‘Postcode’.
XCOORD/X/x is the geocoded x coordinate of the pupils home. The geocoding
of both X and Y coordinates has been undertaken byEducation Leedsand
uses Address Point to extract the easting and northing grid coordinates for
each pupil’s home address.
3.2 Supplementary data
YCOORD/Y/y is the geocoded y coordinate of the pupil’s home.
Generic field name ‘Y’.
The variables available for the years 2002 through to 2006 are as follows:
SENStage/SENStatus/SENSTATUS is a flag that shows if the pupil has a Special
Education Need (SEN).
Generic field name ‘SEN’.
RegistrationType/EnrolStatus/ENROLSTATU is a flag showing whether the pupil
is currently enroled at the institution.
Generic field name ‘Enrolment Status’.
The variable available for years 2003 through to 2006 is as follows:
InCare/INCARE is a flag to indicate if the pupil is currently in care.
Generic field name ‘In Care’.
The variables available for years 2004, 2005 and 2006 is as follows:
PrimarySENType/PRIMARYSEN is a coded indicator of the pupil’s primary
Special Education Need (SEN).
Generic field name ‘Primary SEN’.
SecondarySENType/SECONDARYS is a coded indicator of the pupil’s secondary
Special Education Need (SEN) if the pupil has more than one SEN.
Generic field name ‘Secondary SEN’.
3.2 Supplementary data
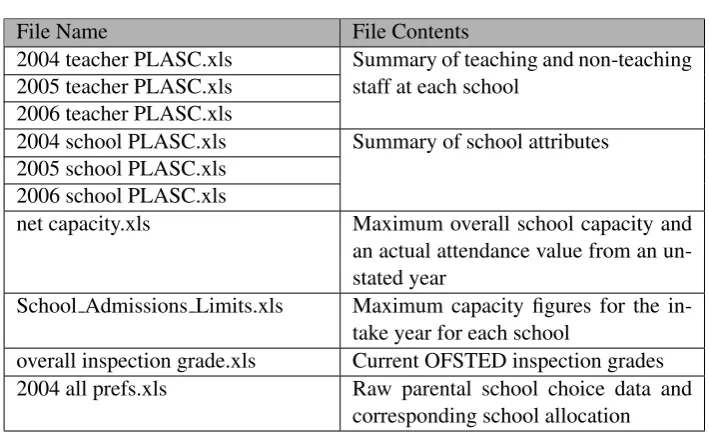
In addition to the pupil level data supplied byEducation Leeds, several
spread-sheets in Microsoft Excel format have also been received. These are shown in Table
2 together with a summary description of the contents. The additional data
con-tained in the spreadsheets are not intended to provide a comprehensive time series
equivalent of PLASC but will be used in later analysis to help quantify the
attrac-tiveness of schools. The resulting attracattrac-tiveness values will be utilised in the
mod-elling techniques applied to the PLASC data. The first three files contain
spread-sheets with information relating to the LA unique identifier, the establishment
File Name File Contents
2004 teacher PLASC.xls Summary of teaching and non-teaching
2005 teacher PLASC.xls staff at each school
2006 teacher PLASC.xls
2004 school PLASC.xls Summary of school attributes
2005 school PLASC.xls 2006 school PLASC.xls
net capacity.xls Maximum overall school capacity and
an actual attendance value from an un-stated year
School Admissions Limits.xls Maximum capacity figures for the
in-take year for each school
overall inspection grade.xls Current OFSTED inspection grades
2004 all prefs.xls Raw parental school choice data and
[image:19.595.110.465.120.336.2]corresponding school allocation
Table 2: Excel spreadsheets containing data supplied byEducation Leeds
full-time female and part-time female staff members in each individual category.
The next two files contain information about schools. The 2004 school spreadsheet
contains the LA unique identifier, followed by the establishment unique identifier,
establishment name, teaching phase, type of intake, type of governance, lowest
na-tional curriculum year and highest Nana-tional Curriculum year. The 2005 and 2006
school spreadsheet contains the same fields as 2004 with the addition of a count of
computers at each institution.
The ‘net capacity.xls’ file contains the unique establishment identifier,
estab-lishment name, the net capacity of the school and the number of pupils on role.
From the latter two columns, the number of surplus places and the percentage of
surplus places in each school have been derived. ‘School Admissions Limits.xls’
contains both the unique identifier of the establishment and its name along with
the maximum number of pupils that can be admitted to the intake year group;
‘overall inspection grade.xls’ again contains both the unique establishment
iden-tifier and the establishment name with information on the Office for Standards in
Education (OFSTED) framework that the school was last inspected on and the
grade that was achieved.
Finally, ‘2004 all prefs.xls’ contains information on the child, the preferences
of schools they would like to attend and also the allocation process. Information
3.3 Database design
child will attend into in the coming academic year (r = reception/infant school, j
= junior school and h = high school), a unique identifier for the child made up
of a combination of the category identification letter and an incremented number,
gender, current institution attended and its name, whether the child has a SEN and
location coordinates geocoded from the child’s home postcode. The preference
information is held in the form of a preference number (1 to 5), the unique identifier
of the corresponding chosen establishment and a yes/no flag to indicate whether the
child has a sibling at the corresponding establishment. Information held relating
to the allocation of institution is the unique establishment identifier and name of
the allocated school, the stage of allocation and finally the reason for allocation of
institution in relation to the LA’s admissions policy.
3.3 Database design
The use of databases to organise vast quantities of data is widespread in today’s
business and public service sectors. Self & Dunckley (2003b, p.7) define a database
as “a collection of data stored in a computer system.” Different database models
exist for structuring how the data are stored. The most common models being:
hierarchical, network, relational, object-relational and object. Currently, the most
widely used model is the relational model first presented by Codd (1970) that was
superior to those in use at the time of invention. It was only after the birth of the
relational data model that the hierarchical and network models were produced to fit
the current systems and enable comparisons to be drawn. The design process
asso-ciated with relational databases promotes data independence from other data and
also separation from information systems that use the data through the application
of Structured Query Language (SQL). The database design process also
encour-ages the description of the data using its own natural structure rather than imposing
an arbitrary structure onto the data (Codd, 1970).
The development of object and object-relational databases has been troubled
by a lack of general uptake. Object databases are designed to be used with
Ob-ject Orientated Programming (OOP) languages such as Java, Visual Basic.Net or
C++ and use the same design model as the actual programming language. The
ob-ject relational database model uses the same relational structure but with an obob-ject
orientated mapping schema to make integration with OOP more effective. Both
hold the record for the largest database and the world’s fastest data ingestion rate.
However, the encapsulation paradigm that is the fundamental building block of
both OOP and object databases works against the general acceptance of the object
database model over the relational model. Encapsulation demands that the data be
hidden away inside an object and only be available through predefined programmed
interfaces, whereas the relational model allows access to the data, for viewing and
editing, as long as the user has sufficient security privileges. The prospect of using
a high-level programming language such as Java or C++ to access data held within
a database is a daunting prospect for many database users, whereas the use of a
simple query builder or easy to learn descriptive language such as SQL is much
more attractive; thus the relational model continues to thrive.
Because of the wider acceptance of the relational data model and because both
the NPD and the locally held pupil database at Education Leeds are relational
databases, this study will use the relational database model as the main database
structure. The relational database design process consists of two main stages. The
first stage is to produce an Entity Relationship Diagram (ERD) using the rules
as-sociated with entity relationship modelling. This can be broken down into three
steps as presented by Dawson (2001):
1. Identify the entities and attributes.
2. Determine the relationships.
3. Combine the entities and relationships into one diagram.
The second stage is to go through a process called data normalisation which
re-moves duplicate data and can be used to check that the original ERD has the correct
structure. The process of normalisation breaks larger tables down into smaller ones
that relate to each other. However, it is possible to over-normalise a database which
then becomes too defragmented with large numbers of defined relationships which,
in turn, increases processing times for queries. The ideal balance is to reduce data
duplication to a minimum and eliminate unused space in fields whilst maintaining
the maximum size for tables. For an in depth discussion, refer to Dawson (2001).
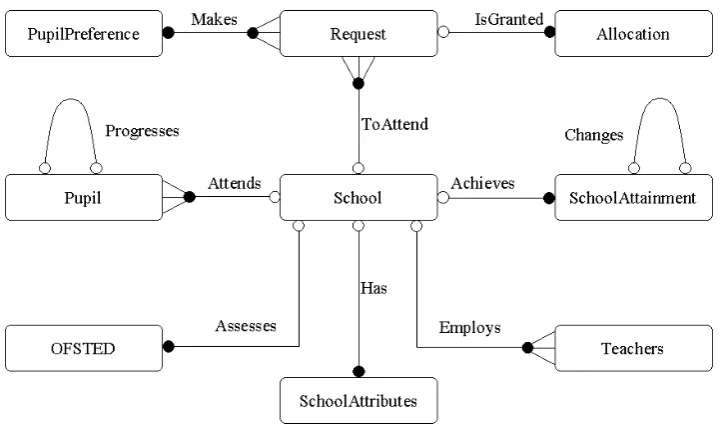
The final ERD of the database design established to house the data described in
Section 3 is shown in Figure 3.
To understand this diagram it is important to have a grasp of the general
3.3 Database design
Entity types
Allocation (Pref UPN, Estab, Stage, Reason)
Request (Pref UPN, Preference, Estab, Sibling)
PupilPreference (Pref UPN, Pupil Category, Gender, Current Estab, SEN, X, Y)
Pupil (UPN, Estab, NC Year, DOB, Gender, Ethnicity, First Language, FSM, Entry Date, PostCode, X, Y, SEN, Primary SEN,
Sec-ondary SEN, Enrolment Status, In Care, Ethnicity Stand,
Post-code Stand)
School (Estab, Estab Name)
SchoolAttributes (Estab, Phase, Intake, Governance, Lowest NC Year, Highest NC Year, Computers, Net Capacity, Intake Year Capacity)
SchoolAttainment (Estab, KeyStage, English, Math, Science, Average-PointScore)
OFSTED (Estab, Framework, Grade)
[image:22.595.124.484.160.375.2]Teachers (Estab, Teacher Category, Male FT, Male PT, Female FT, Fe-male PT)
but is a conceptual representation of a set of related data attributes that can be
grouped together to form a logical block representative of a real world object (Self
& Dunckley, 2003b). Indeed, an entity can end up being the diagrammatic design
representation of a single table or it can represent multiple tables that have the same
structure and contain similar attributes. The entity structure is displayed in the list
at the bottom of the ERD under the heading entity types. Each entity has an entry
in the entity type list and a list of attributes contained by the entity type are shown
within the parentheses that follow. The underlined attributes at the beginning of the
list indicate an attribute or a combination of attributes that will be unique for every
row within a table realisation of the entity. The unique row identifier for a table
is referred to as the primary key. Other types of table keys exist, such as alternate
and foreign keys, however a full explanation of these features fall outside of the
remit for explanation here but a full description can be found in Self & Dunckley
(2003b) or Dawson (2001).
The lines between the entities represent relationships between the entity types.
Each relationship has a name assigned to it which is descriptive of the way the
entity types relate to each other. For example, in Figure 3, the ‘Pupil’ entity has
a relationship of ‘Attends’ with the ‘School’ entity describing that pupils attend a
school. The circles at the end of the relationship lines show relationship
partici-pation. If the circle is black then participation in the relationship is compulsory.
Every row in a table represented by an entity with compulsory participation must
participate in the relationship. If the circle is white then the participation is
op-tional, indicating that rows in represented tables may or may not take part in this
relationship.
The end type of a relationship line dictates whether that particular side of the
relationship has a one or a many involvement with the relationship. If it ends in
a participation circle then that side of the relationship is a 1: indicating that only
one row of any represented table will be involved in the relationship at any one
time. If the end of the relationship ends with the participation circle and then
three lines opening out to the entity (sometimes referred to as a crow’s foot) then
this indicated that the relationship at this end is an n: or many relationship and
many rows of a represented table may take part in the relationship at the same
time. Using the example of the ‘Attends’ relationship a ‘Pupil’ may only attend
3.3 Database design
has many attending ‘Pupil’ entries thus the ‘Pupil’ end of the relationship is an n:.
The ‘Attends’ relationship is described as an n:1 or many to one relationship. Two
further relationship types can be defined, these are 1:1 (one to one) or n:m (many
to many). An example of a one to one relationship is the ‘progresses’ relationship
in Figure 3. Because this relationship begins and ends on the ‘Pupil’ entity, it
indicates that only one row in a table representation of the entity type ‘Pupil’ can
refer to one row in either the same table or another table of the ‘Pupil’ entity type.
The many to many relationship type has not been required for the design of this
database, therefore it will not be discussed in any detail. For further information
on ERD notation and general database design, refer to Dawson (2001) or Self &
Dunckley (2003a,b,c,d).
The implementation of the above database design reduces the amount of
du-plicated data to a minimum while maintaining flexibility in the database structure.
Table 3 displays the tables created within the database, the entity structure that
each table is based upon and the source of the data. Examining Figure 3 and
Ta-ble 3 together shows the data structure for each of the taTa-bles in an entity type and
how tables from different entity types relate to each other. The ‘School’ entity type
has only one table based upon it which is also called ‘School’, although this table
draws data from three spreadsheets supplied byEducation Leedsand is also
sup-plemented by data extracted from EduBase, the DfES online database of education
institutions. The ‘School’ table is the master school table and contains an entry for
every school that has been open during the period 2001 through to 2006.
The ‘School’ table can be linked to the three tables representing the
‘SchoolAt-tribute’ entity type through the relationship ‘Has’. This relationship utilises the
‘Es-tab’ fields and forms a link between the master ‘Schools’ table and the changable
‘SchoolAttributes’ that were associated with a particular school in a given year.
Because not all schools are open in all years, the ‘Has’ relationship participation is
optional at the ‘School’ side but compulsory on the ‘SchoolAttribute’ side as every
school must appear in the master table.
The ‘Pupil’ entity type has six tables based on it, each one holding the data
collected in one year and taken from the PLASC data supplied in Microsoft
Ac-cess database format byEducation Leeds. Each ‘Pupil’ table contains a field with the identifier of the school attended called ‘Estab’. This field can be joined with
re-Entity Name Table Name Data Origin
School School 2004 school PLASC.xls
2005 school PLASC.xls 2006 school PLASC.xls
with additional information for closed schools taken from the DfES EduBase database
SchoolAttributes School 2004 2004 school PLASC.xls
net capacity.xls
School Admissions Limits.xls
School 2005 2005 school PLASC.xls
net capacity.xls
School Admissions Limits.xls
School 2006 2006 school PLASC.xls
net capacity.xls
School Admissions Limits.xls
Pupil PLASC 2001 PLASC databases
PLASC 2002 PLASC 2003 PLASC 2004 PLASC 2005 PLASC 2006
SchoolAttainment Results 2001 DfES Attainment tables
Results 2002 Results 2003 Results 2004 Results 2005 Results 2006
PupilPreference PupilPreference 2004 all prefs.xls
Request PreferenceRequest
Allocation PreferenceAllocation
OFSTED OFSTED overall inspection grade.xls
Teachers Teachers 2004 2004 teacher PLASC.xls
Teachers 2005 2005 teacher PLASC.xls
Teachers 2006 2006 teacher PLASC.xls
Table 3: Tabular realisation of entities and origin of data content
lationship ‘Attends’. The ‘UPN’ field in the ‘Pupil’ tables can be joined to the
‘UPN’ fields in other ‘Pupil’ tables to form a temporal join across several years of
data fulfilling the ‘Progresses’ relationship. The optional participation of the
3.3 Database design
not being present in previous years’ data or leaving school so not being present in
subsequent years’ data.
The ‘SchoolAttainment’ entity is realised into six separate tables holding
re-sults of Key Stage 2, 3 and 4 examinations taken from the DfES attainment tables
for the years 2001 through to 2006. The ‘Estab’ field in the ‘School’ table can
be linked to the ‘Estab’ field in any of the ‘SchoolAttainment’ entity type tables
although as schools are closed over the period 2001 to 2006 they do not appear
in the ‘SchoolAttainment’ tables thus the optional participation of the relationship
‘Achieves’ on the ‘School’ side. The ‘Estab’ field in the ‘SchoolAttainment’ tables
can be used to join the tables across years to assess ‘Changes’ in the performance
of schools. However, the participation of both ends of this relationship have to be
optional to allow new schools to be opened and existing schools to be closed.
The ‘2004 all prefs.xls’ is split into three different logical entity types through
the application of the normalisation process. The three different entity types are
realised into three tables called ‘PupilPreference’, ‘PreferenceRequest’ and
‘Pref-erenceAllocation’. The ‘PupilPreference’ table contains all the data relating to the
pupil including a ‘Pref UPN’ field which unfortunately does not allow a join to
the ‘UPN’ field in the ‘Pupil’ entity type tables. However, the ‘Pref UPN’ field
does allow a join to the ‘PreferenceRequest’ table realising the ‘Makes’
relation-ship. The ‘PreferenceRequest’ table holds information about the requests made to
attend institutions by a pupil. Each pupil will make one or more requests and so the
‘Makes’ relationship is a one to many relationship with both sides having a
com-pulsory participation. Using the ‘Estab’ field in the ‘PreferenceRequest’ table the
‘ToAttend’ relationship can be made to the ‘School’ table. Not every school has to
be part of a request, indeed no pupils may request to attend any given school
there-fore the ‘ToAttend’ relationship has an optional participation on the ‘School’ side.
The ‘IsGranted’ relationship allows a join to the ‘PreferenceAllocation’ table
al-though not every request is granted, as pupils may make up to five ranked requests
but they can only be allocated to one school, making the ‘PreferenceRequest’ side
of the ‘IsGranted’ relationship optional.
The ‘OFSTED’ table relates on a one to one basis with the ‘School’ table using
the ‘Estab’ fields and holds information on the school’s last inspection grade. Not
every school has a current inspection grade as inspections are only carried out every
participa-tion in the ‘Assesses’ relaparticipa-tionship opparticipa-tional on the ‘School’ side. The ‘Employs’
relationship joins the ‘School’ table with the ‘Teacher’ entity type tables using the
‘Estab’ fields. Optional participation on the ‘School’ side of the ‘Employs’
rela-tionship is due to the closing of schools. Thus they do not employ any teachers in
subsequent years.
Having esablished the database design and structure for the research, the
fol-lowing section will deal with data content. It will begin by examining some general
summary statistics for the data before presenting an analysis of errors and
omis-sions and finally considering the temporal aspect of the data.
4
Content of the PLASC Data
4.1 PLASC school and teacher data
Three types of data are recorded in the PLASC returns: pupil data, school data
and teacher data. The school data includes the unique establishment ID, the phase
of schooling that is catered for by the institution, intake type, governance,
low-est and highlow-est National Curriculum years taught and the number of computers in
the school. The school tables contained in the study area database created for this
project are supplemented with data on each school’s net capacity and intake year
capacity. The phase of schooling provided by an institution falls into one of three
categories: primary school (PS), secondary school (SS) and special school
nor-mally referred to as Special Inclusive Learning Centre (SILC). The intake type of
schools is more complex and a brief overview of the development of the education
system is required to understand the diversity contained in this field.
The development of the education system from 1900 through to the
introduc-tion of the 1988 ERA had been fraught with a lack of specific guidance at a naintroduc-tional
level. The Hadow report in 1926 called for compulsory schooling up to the age of
15 for children and suggested a comprehensive school system (Armytage, 1970).
The Spen report in 1938 also called for compusory schooling for children but
sug-gested a school leaving age of 16 and favoured a selective tripartite school system
containing grammar, secondary and technical schools (Lawrence, 1992). The onset
of the Second World War delayed education reforms until the historic 1944
Educa-tion Act that is widely accepted as the Act that “laid the foundaEduca-tion for the modern
4.1 PLASC school and teacher data
a lack of cohesive legislative guidance at a national level lead to many different
education systems being implemented in parallel at a local level for many years,
the remnants of which are reflected in the diversity of school types still available in
England and Wales.
Table 4 shows the valid intake type codes for schools and a brief description
of each code. The code ‘COMP’ refers to ‘comprehensive’ schools, the favoured
secondary school system suggested in the Hadow report of 1926. Comprehensives
do not select their pupil intake on academic aptitude (Armytage, 1970). Up to
1976, the comprehensive school system, the tripartite school system and several
systems that fell somewhere between the two all existed in different LAs across
England and Wales. The Labour party’s 1976 Education Act brought in legislation
to officially end both the tripartite school system and selection by ability in state
schools (Gordon et al., 1991). However, resistance to the abolition of the tripartite
system of schooling in some LAs and changing political views has lead to state
run ‘grammar’, ‘technical’ and ‘secondary modern’ schools remaining. These are
reflected by the codes ‘SEL1’, ‘SEL2’ and ‘SEL3’, although none of these school
types exist in the Leeds study area. The code ‘SEL4’ refers to schools that are
se-lective on religious grounds. The code ‘SPEC’ refers to SILCs, where the school’s
intake consists of children with SEN.
Code Decription
COMP Comprehensive
SEL1 Selective (Grammar)
SEL2 Selective (Secondary Modern)
SEL3 Selective (Technical)
SEL4 Selective (Religion)
SPEC Special
Table 4: School intake types
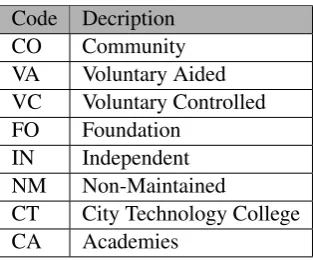
Definitions of the governance status of the different types of schools found in
England are supplied by Teachernet (2007) and are summarized in Table 5. Schools
with a ‘community’ governance type are controlled by the LA. The buildings and
land are LA owned, the staff are employed by the LA and the LA decides and
implements the school admissions policy. ‘Voluntary aided’ schools are normally
church schools, with the land and buildings being owned by a charitable
the staff and has responsibility for the schools admissions policy.
‘Voluntary controlled’ schools are similar to voluntary aided schools although
the LA employs the staff and has responsibility for the admissions policy of the
school. ‘Foundation’ schools were formerly known as grant maintained schools.
School land and buildings are owned by the governing body or by a charitable
foundation in this case. The governing body employs the school staff and has
responsibility for the school’s admissions policy. ‘City academies’ and ‘city
tech-nology colleges’ are funded through schemes directly from the Government with
academies being partially funded through private investment. ‘Non-maintained’
schools are not-for-profit charitable schools and ‘independent’ schools are
sup-ported by fee-paying students and are not maintained by state funding.
Code Decription
CO Community
VA Voluntary Aided
VC Voluntary Controlled
FO Foundation
IN Independent
NM Non-Maintained
CT City Technology College
[image:29.595.213.370.326.456.2]CA Academies
Table 5: School governance codes
The lowest and highest National Curriculum years are the lowest and highest
year groups that the establishment provides education for. The computers field is
simply a count of the computers available for use at the school. Table 6 summarizes
the number of schools within the study area over the six years of PLASC data. The
number of schools in the Leeds study area show a consistent decrease in numbers,
especially in the primary phase (PS) where 19 schools have been closed. Secondary
schools (SS) and SILC (SP) both have the lowest number of school closures with
three, however, when put in context of the total number of schools in each phase,
the SILCs have declined in number by a third.
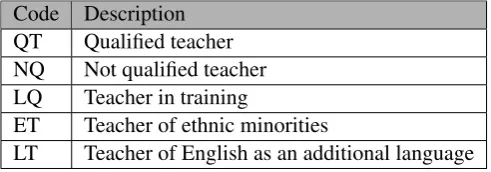
The teacher data counts the number of staff at a school by qualification
cate-gory. The first field contains the unique establishment identifier of the school. The
second field contains the category of teacher that is being counted. Table 7 shows
4.2 PLASC variables
Phase 2001 2002 2003 2004 2005 2006
PS 244 244 240 241 230 225
SS 43 43 43 43 41 40
[image:30.595.180.424.129.189.2]SP 9 10 10 10 6 6
Table 6: Number of schools by phase and year
‘QT’ indicates a qualified teacher and should include the head or acting head. The
code ‘NQ’ relates to staff employed at the school that are not qualified teachers
and are not on a course to become a qualified teacher. The code ‘LQ’ refers to staff
that are not yet qualified teachers but are on a training course leading to qualified
teacher status, although, students at the school on teaching practice should not be
counted. The code ‘ET’ is for any teacher employed to meet the needs of ethnic
minority pupils and ‘LT’ is for teachers that teach English as an additional
lan-guage. The remaining four fields in this dataset contain the counts of the full-time
female staff, full-time male staff, part-time female staff and part-time male staff in
the relevant staff qualification category.
Code Description
QT Qualified teacher
NQ Not qualified teacher
LQ Teacher in training
ET Teacher of ethnic minorities
LT Teacher of English as an additional language
Table 7: Teacher category codes
4.2 PLASC variables
The PLASC data for individual pupils are contained in six tables within the database,
each one representing an annual data collection as discussed in Section 3.3 and
il-lustrated in Table 1. The ‘UPN’ field is a unique numeric identifier that is retained
by the pupil throughout his/her school career and enables temporal analysis of the
data in the pupil tables. The ‘Estab’ field contains a numeric identifier which is the
unique identification number associated with the institution the child is currently
attending.
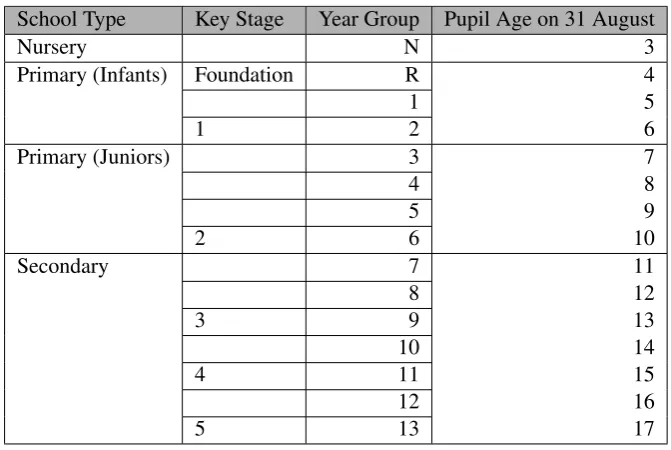
[image:30.595.181.427.418.504.2]Curriculum year group field, ‘NC Year’. The valid entries for this field are shown
in Table 8, however these year groups include additional school years to those
defined as compulsory schooling. Under Section 8 of the Education Act 1996,
compulsory school age is defined as follows: “a person begins to be of compulsory
school age when he attains the age of five.” and “a person ceases to be of
com-pulsory school age at the end of the day which is the school leaving date for any
calendar year
(a) if he attains the age of 16 after that day but before the beginning of the
school year next following,
(b) if he attains that age on that day, or
(c) (unless paragraph (a) applies) if that day is the school leaving date next
following his attaining that age.” (HMSO, 1996).
Therefore the National Curriculum year groups for children of compulsory school
age are reception and years 1 to 11.
School Type Key Stage Year Group Pupil Age on 31 August
Nursery N 3
Primary (Infants) Foundation R 4
1 5
1 2 6
Primary (Juniors) 3 7
4 8
5 9
2 6 10
Secondary 7 11
8 12
3 9 13
10 14
4 11 15
12 16
[image:31.595.123.459.374.599.2]5 13 17
Table 8: National Curriculum year groups and corresponding pupil ages
The field ‘DOB’ holds the date of birth for each pupil and the ‘Gender’ field
holds a single character either an ‘M’ for male or ‘F’ for female pupils. The
‘Eth-nicity’ field contains a coded representation of the ethnic origin of each pupil,
however the categories changed both in number and structure in 2003. The field’s
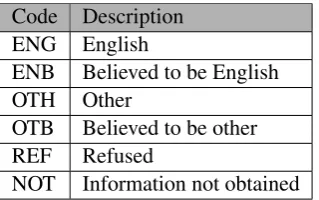
4.2 PLASC variables
in Section 4.3. ‘First Language’ contains the coded representation of the pupil’s
primary spoken language as shown in Table 9. There are six codes: two relating to
whether English is known or believed to be the pupil’s first language, two relating
to the pupil’s first language being one other than or believed to be other than
En-glish. The final two codes indicate that the information on first language has been
refused by either the pupil or their parents or that the information has not yet been
obtained.
Code Description
ENG English
ENB Believed to be English
OTH Other
OTB Believed to be other
REF Refused
[image:32.595.225.385.276.376.2]NOT Information not obtained
Table 9: First language codes
FSM eligibility is stored in the ‘FSM’ field and is recorded as either true when
the pupil is eligible to receive FSMs or false when the child is not eligible to receive
FSMs. FSM entitlement in the Leeds study area is subject to the following
condi-tions “Children whose parents receive Income Support, Income-based Job Seekers
Allowance, or support under Part VI of the Immigration and Asylum Act 1999 are
entitled to free school meals. Children who receive these benefits in their own right
are also entitled to free school meals”(Leeds, 2006).
The ‘Entry Date’ field contains the date that the pupil began attending the
in-stitution indicated in the ‘Estab’ field. The home postcode of the pupil is stored in
the ‘Postcode’ field and must be a valid alpha-numeric entry. Two fields, ‘X’ and
‘Y’, contain the geocoded coordinates of the pupil’s home address. The geocoding
process has been completed byEducation Leedsusing the Ordnance Survey dataset
Address-Point. However,Education Leeds data management staff confirmed that
not all pupil addresses could be matched using Address-Point and those that could
4.3 PLASC variable changes
Each of the PLASC pupil tables has the same structure although not all the data
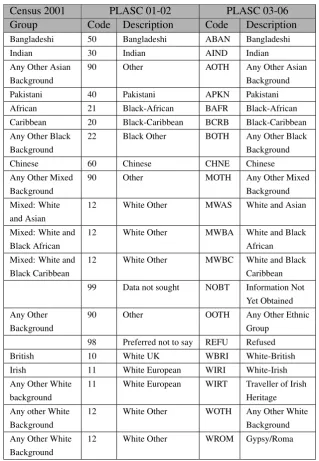
attributes were collected in all years. In 2003, the ethnic origin codes entered into
the ‘Ethnicity’ field were changed to make them compatible with the codes used in
the 2001 Census (Godfrey, 2004). Table 10 shows the 16 ethnic group categories
used in the Census of Population 2001 and the 14 original broad ethnic codes used
in PLASC. The 20 new broad ethnic codes used in PLASC since 2003 can also
be seen in Table 10. Education Leeds use extended codes to further distinguish
between the Pakistani category, these consist of:
• APKN - Pakistani
• AMPK - Mirpuri Pakistani
• AKPA - Kashmiri Pakistani
• AOPK - Other Pakistani
Godfrey (2004) has examined the implications of the change in ethnic codes
using the national data from PLASC 2002 and 2003. He shows how some pupils
changed between broad ethnic classifications between these years. One
explana-tion is that these errors may be due to large amounts of mis-entered data in the
2002 collection due to the numeric coding that was employed in that year.
How-ever, Godfrey dismisses this explanation as unlikely for explaining all the category
changes which involved approximately one record in every 50 for some categories.
A second explanation is that the selection of ethnic category is seen as a political
statement and that the choice may have been made based on a person’s perceived
nationality rather than their ethnic background. However, Godfrey (2004) suggests
that a third explanation may be that the introduction of the new categories clarified
the data requirements leading to more accurate classification by the respondents.
Whatever the reason for the discrepancies, it is clear that the change in ethnic
cat-egories leads to some disruption in the data.
In 2002, variables were added to the data collection for Special Education Need
(SEN) status, the ‘SEN’ field and for enrolment status, the ‘Enrolment Status’
field. The SEN status variable consists of four single character codes (Table 11).
‘N’ indicates that the child has no SEN. ‘A’ indicates that a child has a SEN and
4.3 PLASC variable changes
Census 2001 PLASC 01-02 PLASC 03-06
Group Code Description Code Description
Bangladeshi 50 Bangladeshi ABAN Bangladeshi
Indian 30 Indian AIND Indian
Any Other Asian 90 Other AOTH Any Other Asian
Background Background
Pakistani 40 Pakistani APKN Pakistani
African 21 Black-African BAFR Black-African
Caribbean 20 Black-Caribbean BCRB Black-Caribbean
Any Other Black 22 Black Other BOTH Any Other Black
Background Background
Chinese 60 Chinese CHNE Chinese
Any Other Mixed 90 Other MOTH Any Other Mixed
Background Background
Mixed: White 12 White Other MWAS White and Asian and Asian
Mixed: White and 12 White Other MWBA White and Black
Black African African
Mixed: White and 12 White Other MWBC White and Black
Black Caribbean Caribbean
99 Data not sought NOBT Information Not
Yet Obtained
Any Other 90 Other OOTH Any Other Ethnic
Background Group
98 Preferred not to say REFU Refused
British 10 White UK WBRI White-British
Irish 11 White European WIRI White-Irish
Any Other White 11 White European WIRT Traveller of Irish
background Heritage
Any other White 12 White Other WOTH Any Other White
Background Background
[image:34.595.143.463.125.587.2]Any Other White 12 White Other WROM Gypsy/Roma Background
Table 10: Ethnicity codes used in Population Census 2001 and PLASC 2001/02 and 2003/06
group sessions) to the child from within the school’s main budget. ‘P’ requires
that the child be given support from an appropriate external service as well as from
Code Description
N None
A School action
P School action plus
S Statemented
Q School action plus and statutory assessment*
[image:35.595.164.417.127.225.2]*Category only used in 2003 and 2004 data collections.
Table 11: SEN status codes
The school, external support provider and parents are all included in the
strat-egy creation and implementation for the child’s continued support. ‘S’ means that
a child has been assessed and found to need additional support that cannot be
rea-sonably met by a school’s normal resources. Detailed definitions for the stages of
SEN status can be found athttp://eduaction.com/. In 2003 and 2004, an additional
code of ‘Q’ was used relating to pupils that require aid from an external service
and are also undergoing a statutory assessment. From 2005 onwards, this code was
not used and the pupils were reallocated into either category ‘P’ or ‘S’ as required.
In 2002, the categories for data collection were numeric, ranging from 0 to 5 with
0 representing a child with no SEN and 5 representing a child with a statement of
SEN. Data collection in 2002 returned mostly the numeric codes in 2002 but also
some of the new character codes to be adopted as standard from 2003. The
incon-sistencies in the collection in 2002 and the category change that occured in 2003,
coupled with the exclusion of the ‘Q’ category after 2004 demands that a
standard-isation method be adopted to allow comparison of SEN data between years. Table
12 shows the reclassification codes to be used and how they translate to the codes
used for PLASC data collection in each year. The reclassification adopted here
is based on the reclassification strategy used by DfES statisticians in 2004 (DfES,
2004).
The enrolment status variable introduced in 2002 contained four codes as shown
in Table 13. An enrolment status of ‘C’ indicates that the pupil is registered for
normal attendance at the indicated school in the ‘Estab’ field. A status of ‘G’
in-dicates that the pupil is not registered at the school but is attending some classes.
The PLASC guidance notes (published each year on the Teachernet website at
http://www.teachernet.gov.uk/) state that pupils that are not registered at a school