promoting access to White Rose research papers
Universities of Leeds, Sheffield and York
http://eprints.whiterose.ac.uk/
This is an author produced version of a paper published in Journal of Structural Engineering.
White Rose Research Online URL for this paper:
Published paper
Pilakoutas, K., Li, X. (2003) Alternative shear reinforcement for reinforced concrete flat slabs, Journal of Structural Engineering, 129 (9), pp. 1164-1172
Alternative Shear Reinforcement for
Reinforced Concrete Flat Slabs
By K. Pilakoutas1 and X. Li2
Abstract: This paper presents the first series of validation tests for a patented shear
reinforcement system for reinforced concrete flat slabs. The system called “Shearband” consists
of elongated thin steel strips punched with holes, which undulate into the slab from the top
surface. The main advantages of the new reinforcement system are structural effectiveness,
flexibility, simplicity and speed of construction. Four reinforced concrete slabs were tested in a
specially designed test-rig. The slabs reinforced in shear exhibited ductile behavior having
achieved their full flexural potential; thus, proving the effectiveness of the new reinforcement.
This paper reviews briefly existing types of shear reinforcement and identifies the need for more
efficient and economic solutions. Details of the experimental set up and results are given,
including strain and deflection measurements as well as photographs of sections through the
slabs. Finally, comparisons are made with the ACI 318 and BS8110 code predictions, which
confirm that the system enabled the slabs to avoid punching shear failure and achieve their
flexural potential. In addition, both codes are shown to lead to conservative estimates of flexural
and punching shear capacities of RC slabs.
1 Reader, The University of Sheffield, Department of Civil and Structural Engineering, Mappin Street, Sheffield, S1 3JD, UK, e-mail: k.pilakoutas@sheffield.ac.uk
2 PhD Graduate, The University of Sheffield, Department of Civil and Structural Engineering, Mappin Street, Sheffield, S1 3JD, UK, e-mail: xli@ctisinc.com
INTRODUCTION
Reinforced concrete (RC) flat slab floors lead to architecturally pleasing buildings and bridges as
well as simplify and accelerate site operations. They allow easy and flexible partitioning of space
and reduce the overall height of tall buildings. However, flat slab construction can lead to high
shear stresses around supporting columns, which can cause abrupt punching shear failures at
loads well below the slab flexural strength.
At the design stage, there are several ways of avoiding punching shear failure, such as:
1) reducing the applied loads,
2) reducing the effective length of the slab,
3) increasing the overall thickness of the slab,
4) increasing the thickness of the slab locally with a drop panel or an inverted cone,
5) increasing the column head dimensions and
6) providing some kind of shear reinforcement.
The first five solutions either increase the overall floor height, are impractical, architecturally
unacceptable or expensive. Consequently, very often, to achieve an elegant thin flat slab, shear
reinforcement is required. Properly designed shear reinforcement can prevent brittle punching
failure and increase the strength and ductility of the slab-column connection.
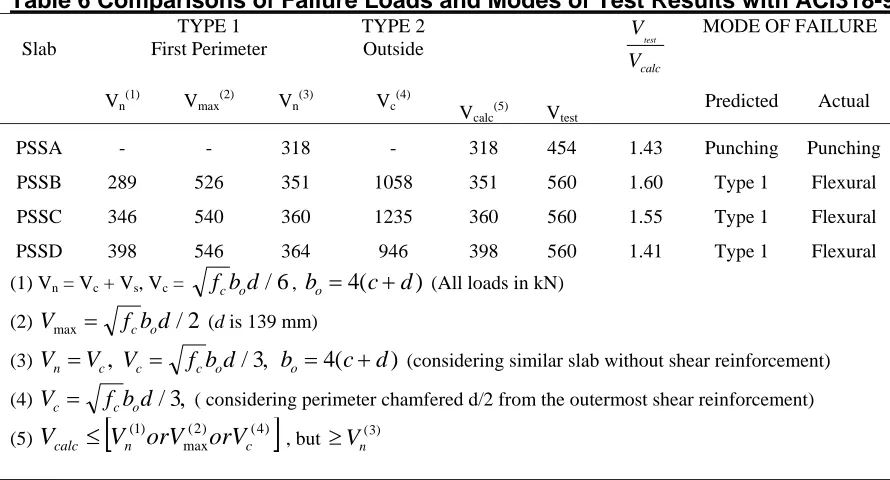
Traditionally, to prevent shear failure, reinforcement is provided either at an angle or
perpendicular to the main flexural reinforcement, as shown in figure 1. However, in thin
difficult, because full anchorage should be provided to develop the shear reinforcement yield
strength within the depth of the slab. This problem is further aggravated by the fact that
conventional shear reinforcement, due to its cross-sectional dimensions, cannot be placed in the
cover region above the top layer of flexural reinforcement without reducing durability or the
efficiency of flexural reinforcement.
Stirrup shear reinforcement was first investigated by Graf (1938) and later by Elstner and
Hognestad (1956), Kinnunen and Nylander (1960), Franz (1963), Wantur (1969), Carpenter, et al
(1970) and others. Much of the experimental work reported until now led to the conclusion that
shear reinforcement consisting of bars is not fully effective, because it does not reach its yield
strength before slab failure. Broms (1990) tested eight specimens with different types of shear
reinforcement from ordinary stirrup and bent bars. The test results showed that ordinary shear
reinforcement in the form of open links (see figure 1) enclosing only the tension flexural
reinforcement were not effective enough to give flat slabs the desired ductility. The authors (Li
and Pilakoutas, 1995) tested one specimen with similar U-shaped shear reinforcement from
ordinary stirrup reinforcement. The results confirmed that this kind of shear reinforcement is not
fully effective, because it does not develop high enough strain to reach yield.
Closed hoops, as shown in figure 1, are best suited for shear reinforcement; however, their
integration involves building up reinforcement cages from individual bars. This increases the
costs and time required for fixing reinforcement. In the UK, the conventional solution is
“sausage” links (shown in figure 1) since they are relatively easy to install. However, they are
though effective, is difficult to design, manufacture and place. It is also not suited for earthquake
resistant design, where a reversal of moment may occur.
Cages of prefabricated reinforcement in all forms and shapes are available commercially and
depend on factory bending and welding operations. The solutions tend to be more economical
and practical than conventional reinforcement. In the UK, one such prefabricated stirrup system,
developed by the BCA (1990), is the Shearhoop System.
Other solutions
Due to the difficulties with conventional reinforcement, there have been many attempts to
develop easy to place and effective shear reinforcement for flat slabs. Hawkins (1974)
summarized most of the different types of shear reinforcement. All current types of shear
reinforcement have advantages and disadvantages concerning ease of detailing, anchorage
effectiveness, cost effectiveness and ease of placement. However, many of the existing systems
increase not only the shear capacity of the connection, but also the flexural capacity. Increasing
the flexural capacity may not be undesirable in most construction away from earthquake regions,
but it may mean that if failure does occur it could be of a brittle nature. Two types of
Steel section shearhead reinforcement. Shearhead reinforcement includes the use of I
Sections, Channel sections, D-collars or Steel Plates. Shearhead cages were also used by Moe
(1961) and Anderson (1963). Shearheads consisting of structural steel plates or structural steel
sections, or both, were investigated by Tasker and Wyatt (1963) and Corley and Hawkins (1968).
Shearheads provide an effective, but cumbersome way of reinforcing against shear. Steel
sections tend to be heavy, expensive relative to conventional reinforcement and normally require
welding at the intersection right above the column. They can be difficult to integrate with
conventional reinforcement and may obstruct passage of the column bars through the connection.
Due to their high stiffness, they attract extra moment to the connection, which can lead to
problems at the ends of the steel sections.
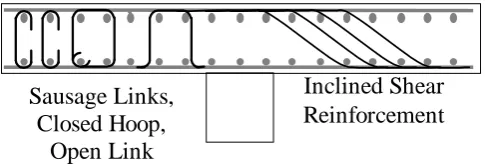
Stud type reinforcement. This is an efficient solution used in North America and Germany
and involves the use of shear studs welded on a metal strip (as shown in figure 2). Extensive tests
in Germany (Andrä, Dilger and Ghali, (1979), Andrä, (1981)) and Canada (Dilger, Walter, and
Ghali (1981), Mokhtar, Ghali, and Dilger, (1985), Elgabry and Ghali (1987)) on full-size
slab-column connections verified that stud type reinforcement substantially increases the strength and
ductility of slabs.
SHEARBAND REINFORCEMENT
Research undertaken at the “Centre for Cement and Concrete” of the University of Sheffield,
shear reinforcement, called the “Shearband” system. The Shearband system is now patented in
many regions internationally, including North America, Europe and Japan.
This new shear reinforcement system is made of steel strip of high ductility. The strip is
punched with holes, because this has been demonstrated experimentally to increase its anchoring
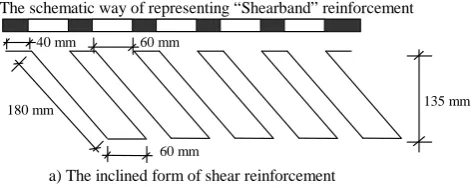
characteristics over short lengths (Li and Pilakoutas, 1995). The strip can be bent to a variety of
shapes, and for the initial tests the strip was punched and bent, as shown in figure 3.
This new shear reinforcement system differs from all existing systems. Due to its small
thickness the reinforcement can be placed from the top, after all flexural reinforcement is in
place, with minimal loss of cover. This leads to major benefits because the shear reinforcement:
1) anchors above the outermost layer of reinforcement,
2) acts over the entire concrete core, maximizing its effectiveness in resisting shear,
3) does not decrease the effective depth of flexural reinforcement,
4) is very simple and efficient to place and
5) does not increase the slab flexural capacity.
This system is adaptable and can accommodate greater tolerances in placement and enables
quick addition of extra reinforcement where required at a later stage. In addition:
1) it can enable the construction of thinner slabs (below what is currently acceptable by the
codes),
2) it can be designed by using existing design codes,
On the practical side, since it is light it is easy to store and transport.
EXPERIMENTAL VALIDATION OF SHEARBAND SYSTEM
The experimental validation of the system was undertaken through several series of flat slab
testing, beam testing and pullout tests. This paper will discuss and present the results from the
first series of flat slab testing.
Slab details
Four slabs were designed and tested in the heavy structures laboratory of the University of
Sheffield. The slabs were given codes PSS- (Punching Shear Slabs) A to D. PSS-A was a control
specimen without shear reinforcement. Slabs PSS-B, PSS-C and PSS-D were reinforced with
different forms of the alternative shear reinforcement system, as will be discussed later.
The dimensions of the slabs were chosen to be similar to those in tests undertaken previously
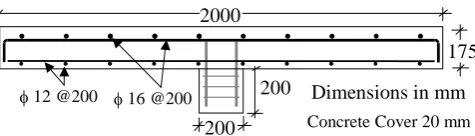
by Li and Pilakoutas (1995) at Sheffield and Chana at BCA (1990). The four slabs were 175 mm
thick and 2000 mm square with a 200 x 200 x 200 mm column stub located centrally below the
plate. The slabs were reinforced with bottom and top flexural reinforcement mats, as shown in
figure 4.
The slab dimensions represent 1:1.5-scaled models of full-scale slabs. As a result, the depth
of the slab was below the minimum (200 mm) allowed by the British Standard BS 8110 (1985).
inability of conventional shear reinforcement to anchor effectively over short lengths. This
implies that such a test is more severe than for deeper slabs and if punching shear failure is
avoided in this slab, then the results are applicable for all slabs deeper than 175 mm.
Shear reinforcement
For comparison and control purposes, PSS-A was left without shear reinforcement. Slabs
PSS-B, PSS-C and PSS-D were reinforced with the new shear reinforcement system. The new
shear reinforcement was made of a high strength, high ductility flat steel strip of width 25.4 mm
and thickness 0.8 mm.
For PSS-B, the strip was punched with 8 mm diameter circular holes along the central line of
the strip and with semi-circular holes at both edges. Preliminary tests by the authors (Li, 1995)
showed that the holes in the strip are necessary to maintain good anchorage characteristics in the
strip over short embedment lengths. The strip was bent in the inclined form shown in figure 3a.
This was done, because it was felt that shear reinforcement should be placed perpendicularly to
the potential shear crack. The effectiveness of inclined compared to vertical reinforcement was
one of the parameters studied in this series of testing, as well as in subsequent series.
The amount of shear reinforcement required was determined in accordance with the
requirements of BS 8110 (1985) to avoid punching shear failure with the distribution shown in
figure 5. The minimum spacing of shear reinforcement was one of the main parameters
which was thought to be excessive, the American practice of providing reinforcement in the two
principal directions was adopted. Figure 6 shows a photograph of the slab reinforcement.
The shear reinforcement for PSS-C was similar to that of PSS-B, as shown in figure 5, but
without any holes in the strip. The only difference with slab PSS-B was that each length of
Shearband reinforcement in PSS-C had two additional legs, one at each end. Extra legs of shear
reinforcement were demonstrated in earlier pullout tests to be sufficient for anchorage purposes.
Clearly, this test aimed at examining the performance of the shear reinforcement without holes.
The shear reinforcement for slab PSS-D was made by using the steel strip with holes, but this
time it was bent with vertical legs as shown in figure 7. The shear reinforcement was distributed
more evenly in the required perimeters. Because the length of reinforcement spanned only in one
direction, only one depth of shear legs was required. This is thought to simplify matters on site,
by eliminating the possibility of placement errors. It is also more efficient, because it anchors on
the top layer of reinforcement.
The shear reinforcement in PSS-B and PSS-C was placed above the two top layers of flexural
reinforcement only. However, the reinforcement for PSS-D, though placed from the top, was also
bent manually during fixing around the bottom flexural reinforcement, as shown in figure 7. This
was done so as to provide additional anchorage to the reinforcement in the compression zone.
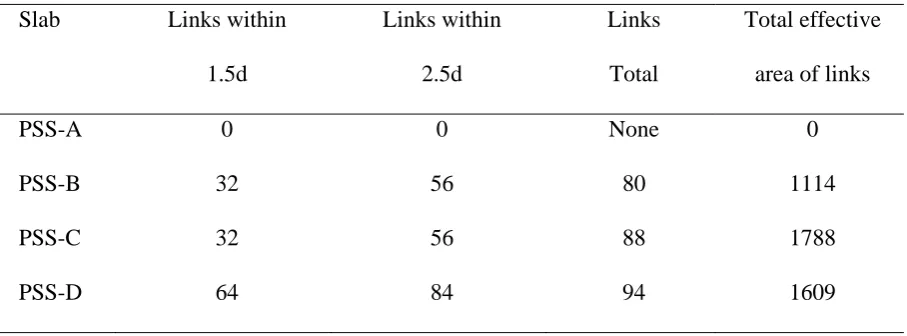
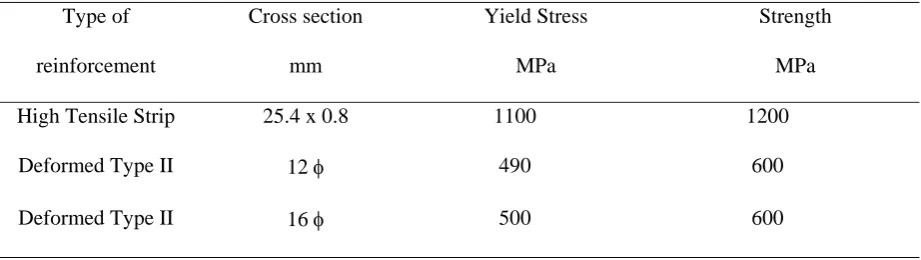
The shear reinforcement details are shown in table 1. The characteristics of the steel strip and
Concrete
Normal weight ready-mix concrete of nominal strength C35 (35 MPa) was used. The
specification for the concrete was: nominal maximum aggregate size 20 mm; slump 50 mm.
Cubes, cylinders and prisms of concrete were taken for control purposes. The four slabs were
cast at the same time in specially prepared wooden forms, from the same batch of concrete to
eliminate variations in concrete quality. Concrete was compacted by poker-vibrators. After
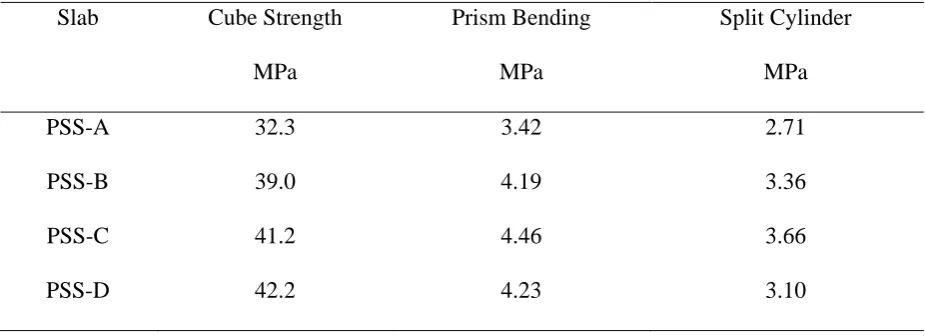
casting, the slabs were cured for one week. For control purposes, sets of four cubes, split
cylinders and prismatic specimens were cast along side each of the slabs. The results from
control specimens tested on the same day as the slabs are summarized in table 3.
Instrumentation
Extensive measurements were made of strains at key locations on the flexural and shear
reinforcement. Electrical transducers were also used to measure the vertical and horizontal
deflections, as well as concrete strains. The width of cracking was not measured during the test,
but the development of the cracks was marked on the top surface.
The positions of strain gauges on the flexural reinforcement is shown in figure 8, whilst the
strain gauges on the vertical legs of the shear reinforcement are shown in figures 5 and 7.
The positions of the LVDT transducers are shown in figure 8. Transducers D1 to D11 were
positioned to measure the vertical displacement of the slab. Transducer D1 was intended to
perpendicular to each other to measure the concrete strains in the radial and tangential directions
at the column edge and on the bottom soffit of the slab. Transducers RS3 to RS6 were placed in
pairs on the top and bottom surfaces of the slab to measure the radial strains on the concrete.
Testing Arrangement
Traditionally, in punching shear tests, the slabs are supported on their four edges, or through
tie rods, and loaded through the column stub in the center. This arrangement imposes the support
deformation of the test specimens. However, real slabs are not truly symmetric about the
diagonal. The stiffness of slabs is different in the two orthogonal directions, due to the different
lever arm offered by the two layers of top reinforcement and, hence, the moment of resistance
will differ according to the boundary conditions. Furthermore, specimens supported along four
edges are expected to lift up at the four corners and this further distorts the boundary.
The testing arrangement was similar to that used in previous tests by the authors (Li and
Pilakoutas, 1995). Symmetric point loads were applied at eight locations on a circle of diameter
1.7 meters, as shown diagrammatically in figure 9 and in the photograph of figure 10. These
points correspond roughly to the points of contraflexure of a 4 meter span, or a 6 meter prototype
span. Eight hydraulic jacks of 100 kN capacity were used and connected to the same pressured
oil supply so that each jack applied the same load. The jacks were restrained against horizontal
movement, but the slab at the loading points was free to rotate and displace laterally.
The test-rig developed does not define the deformation of the specimens either in the
at each loading point is kept the same. This provides the best simulation of uniform loading
conditions.
Experimental Procedure
The applied load was manually controlled and increased incrementally. The service load
(assuming an average load factor of 1.6) and design capacity were calculated by flexural design
using the equations of BS 8110 (1985) (yield capacity of flexural bars 460 MPa). The loading
procedure followed consisted of several load cycles as follows:
Phase A: Two cycles were applied up to the service load, 150 kN.
Phase B: Two cycles were applied up to the design capacity 250 kN.
Phase C: One cycle was applied up to 450 kN, just below the expected punching shear
capacity.
Phase D: The slab was loaded to failure.
TEST RESULTS
Test observations
The initial crack development in all four slabs followed a similar pattern. The first cracks opened
up on the top surface in the form of flexural cracks near the column, in the weaker direction, at
around 100 kN. The weaker direction was the one with the smaller effective depth. After 100 kN,
the cracks propagated from the middle outwards and reached the slab edges. Subsequently, with
increasing loads, more cracks developed that advanced radially along the four axes of symmetry
of the slab from the column faces towards the slab edges. Cracks parallel to the X and Y axes
load greater than 200 kN. By the time the applied load reached 300 kN, only a few new diagonal
cracks developed. After that, with increasing load, the width of the cracks close to the column
increased substantially.
PSS-A, which served as the control specimen, failed abruptly in punching shear at a load of
454 kN. The crack pattern through the section at failure can be seen in figure 11. The zone of
concrete punched out was similar to the expected truncated cone and surfaced at the top of the
slab through inclined cracks. Penetration of the column into the slab was observed and at the end
of the test, as the column was found to have punched into the slab by about 23 mm. The widths
of the flexural cracks near the column were considerable, exceeding 1mm. No concrete
compressive crushing was observed near the column.
PSS-B and PSS-C failed gradually after reaching the maximum flexural load and undergoing
substantial deflections. Penetration of the column into the slab was also noticed after the end of
the tests. However, no clear evidence of the punching shear cracks was found on the top surface
of the slabs, as in PSS-A. The width of the flexural cracks directly above the column was
considerable, greater than 5 mm in several locations. The maximum recorded load for these two
slabs was 560 kN. During testing, it was observed that the flexural cracks on the top surface
followed the expected hogging yield lines, indicating that the slabs reached their full flexural
potential before failure. This conclusion is also supported by strain readings (from high
elongation strain gauges) on the flexural reinforcement in excess of 20,000 . The failure
PSS-D failed eventually in punching shear failure, after reaching the maximum flexural load
and undergoing substantial deflections. However, in this case the column did not penetrate the
slab, but the punching shear failure resulted due to failure outside the shear reinforced area
around the four loading jacks located on the diagonals. The maximum recorded load for PSS-D
was also 560 kN. The failure pattern through a cross section of PSS-D is shown in figure 11. The
failure of this slab highlights the huge potential of strip reinforcement in preventing failure in the
desired zone.
Instrumental results
Full details of the test results are presented elsewhere (Pilakoutas and Li, 1995, Li 1997). The
load history versus deflection in position D11 is shown in figure 12. The load history versus
strain on the flexural reinforcement is shown in figure 13 for locations S1 and S7. The load
history versus microstrain for the shear reinforcement is shown in figure 14 for locations S3, S4,
S5 and S6.
DISCUSSION OF TEST RESULTS
Deflections and Ultimate Punching Shear Capacity
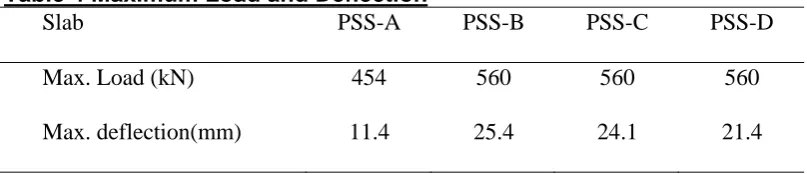
Figure 12 indicates a significant increase in the ductility of PSS-B, PSS-C and PSS-D
reinforced with shearband reinforcement, as compared to control slab PSS-A. The deflections in
slabs with shearband reinforcement are more than two times the deflection of the control slab, as
shown in Table 4. In addition, because all three slabs reinforced in shear reached their full
Strain on flexural reinforcement
As shown by the large plastic strains in strain gauges S1 (higher top bar) and S7 (lower top
bar) of figure 13, in slabs with shear reinforcement, the flexural reinforcement close to the
column yielded significantly before failure. This indicates that plastic hinge regions, formed
close to the column face, enabling moment redistribution within the slab, leading to yield lines
radiating from the center outwards in between the loading points. Much larger strains were
recorded by S1 than by S7 and S1 appears to have yielded first.
Effectiveness of Shear Reinforcement in PSS-B and PSS-C
As shown in figure 14, prior to the initiation of cracking, the strains in the shearband
reinforcement, with or without holes, are relatively small. After that, however, strain on the shear
reinforcement with holes is seen to be smaller than strain on reinforcement without holes. This
can be attributed to the better anchorage of the reinforcement with holes, which arrests the
cracking from opening over a shorter length.
The internal inclined shear cracks in these two slabs are shown in figure 11. More shear
cracks can be noticed in these slabs than for PSS-A, for which there is evidence of only a single
crack that defines the failure surface. This means that the shear reinforcement was effective in
stopping failure along this first potential surface of weakness. In fact, the figure shows that the
reinforcement was also effective at least along a second surface of weakness, as indicated by the
large shear cracks further out. It is interesting to note that none of these shear cracks reached the
top surface of the slabs, which explains why spalling of concrete has not been observed on the
The first set of inclined shear cracks appears to have started from near the top reinforcement
and ended near the column. Even though at the end of testing, it was noticed that the column
penetrated into the slab, the first two legs of shear reinforcement were actually avoided by the
first inclined shear cracks, which propagated inside the cover. These cracks were more inclined
away from the column and appeared to span at least two legs of shear reinforcement. It can be
concluded that substantial yielding and rigid body rotations must be responsible for the apparent
penetration of the column into the slab, which explains why the load was maintained during this
process. Because there was shear failure surface through the concrete in compression, the shear
resistance of concrete along that surface can be considered to have been adversely affected by
shear cracking. This assumption appears to be supported by the ACI code of practice, which
adopts a reduced concrete shear contribution when the slab requires shear reinforcement (Vc in
equation 11-37 is twice as much as allowed in 11.12.3.1), but not by the British Standards which
assume the same concrete shear resistance before and after the initiation of shear cracks.
Load versus strain relationship of shear reinforcement in slab PSS-D
The load versus strain relationship of shear reinforcement in PSS-D is shown in figure 15.
Strains in S2 are much smaller than in S6 and S8 and show no yielding took place at that
location. Strains S6 and S8 show massive strains indicating that the shearband was well anchored
and fully utilized. This can give an explanation why the inclined failure surface of slab PSS-D is
The inclined failure crack of PSS-D differed from that of PSS-B and PSS-C, because more
shear reinforcement was spread all round the column and enclosed both the top and bottom
flexural reinforcement. Hence, the slab was more rigid in the punching zone of the column and,
hence, eventual failure was obtained just at the edges of the shear reinforced zone. The better
performance near the column indicates that the European approach of distributing reinforcement
over a larger area may have some merit.
Comparisons between arrangements of shear reinforcement
The amount of shear reinforcement used was almost the same in all three slabs reinforced in
shear, as shown in table 1. Nevertheless, due to the fact that failure in PSS-D was outside the
reinforced zone, it appears that the vertical shear reinforcement in slab PSS-D performed better
than the shear reinforcement in slabs PSS-B and PSS-C. This cannot be concluded clearly,
because the reinforcement was better distributed and also anchored under the bottom
reinforcement. However, as there are practical advantages in having the shear reinforcement
vertical, this was a subject of further investigation during a second phase of testing.
It is clear that because all slabs with shear reinforcement reached the same maximum load of
560 kN, the ultimate capacity of these slabs was determined by their flexural capacity.
Effectiveness of shear reinforcement
The shear reinforcement has little effect before the initiation of the inclined shear cracks
inside the slab, as shown by the load versus strain curves for shear reinforcement. After the
across the shear crack and delays the further widening of the shear crack, thus increasing the
punching shear capacity (in the case of PSSB, C and D beyond the flexural capacity) and
ductility of the slab. To achieve this, the reinforcement needs to be well anchored and have
enough ductility to allow the mobilization of many legs of reinforcement. For this task, the shear
reinforcement with holes was considered to be more efficient and it was thus adopted during the
subsequent stages of development testing.
Comparisons of flexural Capacity with BS 8110
The flexural capacity of the slabs, calculated using BS 8110 (1985) and assuming a yield-line
pattern radiating outwards form the center towards the middle of loading points is given below:
• the serviceability load was found to be around 270 kN (load factors of 1 used),
• the design flexural capacity was found to be 418.3 kN (using material safety factors),
• the expected (unfactored) flexural capacity was found to be 498 kN (without using
material safety factors).
The predicted upper bound flexural load for the slabs by using the true material
characteristics (steel strength as obtained from tests) and a section analysis computer programme
(Pilakoutas, 1990) is 571 kN. This was very close to the experimentally obtained value of 560
kN, which shows that the three shear reinforced slabs reached their flexural capacity. Similar
results are expected when using the American standards. It should be pointed out that the actual
steel mechanical characteristics include strain hardening and the measured strength is higher than
Comparisons of Shear Capacity with BS 8110 and ACI 318-99
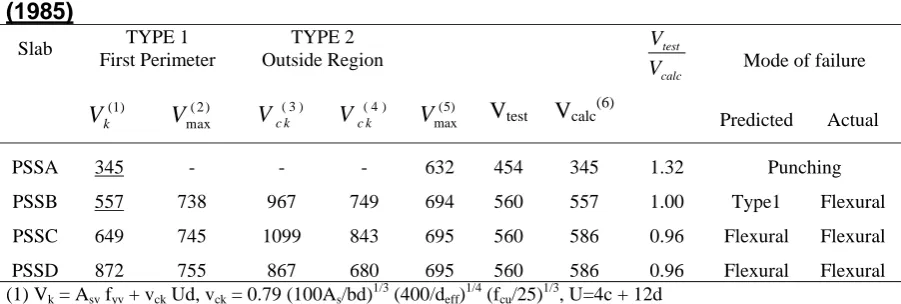
The failure loads are summarized in Tables 5 and 6, where they are compared with
characteristic strengths predicted by BS 8110 (1985) and ACI 318-99 (1999), respectively. The
partial safety factors or strength reduction factors are set equal to 1.0 and the mean compressive
strength of the concrete obtained from the control specimens is used in the calculations. The
limitation of 40 MPa in the BS 8110 equation has been ignored, to avoid making the code results
appear even more conservative.
Two types of punching shear failure are considered for predicting the failure loads.
Type 1 Punching shear failure through the links in the first failure zone
For BS 8110, this is calculated as the concrete shear resistance at 1.5 d plus the contribution
of all links within the first failure zone, i.e. 1.5 d from the column face. For ACI 318-99, this is
calculated as the concrete shear resistance at 0.5 d plus the contribution of all links within the
first failure zone, i.e. 0.5 d from the column face.
Type 2 Punching shear failure outside the shear reinforcement region
For the BS 8110 calculations for PSS-B and PSS-C this relates to the concrete shear
resistance at (3.75 + 0.75) d from the column face. For slab PSS-D this is calculated as the
concrete shear resistance at (1.45 + 0.75) d plus the contribution of all shear links within this
failure zone. For ACI 318-99, calculations for PSS-B and PSS-C this is calculated as the concrete
concrete shear resistance at (1.45 + 0.5) d plus the contribution of all shear links within this
failure zone. For PSS-D, the perimeter was chosen to reflect the observed mode of failure.
From table 5, it can be seen that the punching shear capacity predicted for the control slab by
the British Standard is well below the experimental value. In addition, Slab B, which failed in
flexure, is predicted to fail in shear Type 1. Slab D was not expected to have any shear problems
due to the large amount of shear reinforcement present. Hence, it can be concluded that the
British Standard is in general conservative (though less conservative than the ACI code) and that
the shear reinforcement behaved at least as well as expected.
From table 6, it can be seen that the ACI code is very conservative, predicting shear failures
for all slabs. It underestimates both the concrete shear contribution and the additional resistance
provided by the reinforcement. In fact, all the shear reinforced slabs exceed even the upper limit
of the maximum capacity expected from a section with the maximum amount possible of shear
reinforcement. Again, by using the ACI approach it can be concluded that the shear
reinforcement behaved extremely well.
DESIGN RECOMMENDATIONS
It is clear from the above that the design codes examined are very conservative and
underestimate the contribution of concrete and shearband reinforcement. Hence, for the
design of slabs with the current shear reinforcement system, no extra or specific design rules
are required. However, it is recommended limiting the characteristic yield capacity of the
each code of practice. This limitation will ensure that the width of shear cracks is controlled
during design loads to the same strains as for conventional reinforcement.
CONCLUSIONS
The present shear reinforcement system provides an effective and simple system against
brittle punching shear failure. The system leads to improved structural performance, when
compared with other shear reinforcement systems, because it:
prevents brittle punching shear failure and improves greatly the ductility of flat slabs,
increases the ultimate design capacity,
allows yielding of the flexural reinforcement and moment redistribution,
can be used in thin slabs,
can be designed using existing design codes.
Both BS8110 and ACI318 codes of practice appear to be conservative in predicting the
resistance of unreinforced concrete slabs and both underestimate the shear reinforcement
contribution.
The ACI318 code is more conservative when it comes to calculating the resistance of shear
reinforced slabs, because it reduces to half the contribution of the concrete shear resistance. This
practice is not adopted in Europe, where the punching shear reinforcement is distributed in all the
ACKNOWLEDGMENTS
The authors wish to acknowledge the initial financial support by ROM Ltd, UK and
subsequent support from Abcot Ltd UK.
References
ACI 318-99 / ACI 318R-99 (1999) ‘Building Code Requirements for Reinforced Concrete and
Commentary’, American Concrete Institute Committee 318, Detroit, 353.
Anderson, J. L.,(1963). " Punching of Concrete Slabs with Shear Reinforcement," Transaction
No. 212. Royal Institute of Technology, Stockholm, Sweden
Andrä, H. P. (1981). " Zum Tragverhalten von Flachdecken mit Dübelleisten-Bewehrung im
Auflagerbereich," Beton- und Stalbetonbau (Berlin), 76(3), 53-57, and 76(4), 100-104.
Andrä, H. P. Dilger, W. H., and Ghali, A. (1979). " Durchstanzbewehrung für Flachdecken,"
Beton und Stalbetonbau (Berlin), 74(5), 129-132.
British Cement Association (1990), " Flat Slab Shear Reinforcement Manual, "Shearhead
Manual, BCA, Wrexham Springs, Slough.
Broms, C.E. (1990). "Shear Reinforcement for Deflection Ductility of Flat Plates," ACI Journal,
87(5), 696-705
Carpenter, J. E., Kaar, P.H. and Hanson, N.W., (1970). Discussion of "Proposed Revision of ACI
318-63: Building Code Requirements for Reinforced Concrete," ACI Journal, 68(3), 696-697.
Corley, W.G., and Hawkins, N.M. (1968). " Shearhead Reinforcement for Slabs," Proceedings,
American Concrete Institute, 65, 811-824.
Dilger, Walter H., and Ghali, A. (1981). " Shear Reinforcement for Concrete Slabs," Proceedings
ASCE, Vol. 107, ST 12, 2403 -2420.
Elgabry, A. and Ghali, A. (1987). " Tests on Concrete Slab-Column Connections with Stud Shear
Reinforcement Subjected to Shear-moment Transfer," ACI Structural Journal, 84(5), 433-442.
Elstner, R. C. and Hognestad, E. (1956). " Shearing Strength of Reinforced Concrete Slabs," ACI
Journal, Proceedings, 53(1), 29-58.
Franz, G. (1963). "Versuche an Stalbetonkröpern der Flachdecke im Stützenbereich," Bericht
über die Versuchreihe I (II) für die Deutsche Forschungsgemeinschaft, Bad Godesberg, Institut
für Beton and Stalbeton, Technische Hochschule Karlsruhe.
Graf, O. (1938). " Strength Tests of Thick Reinforced Concrete Slabs Supported on All Sides
Under Concentrated Loads," ("Versuche über die Widerstandsfähigkeit von allseitigen
aufliegended dicked Eisenbetonplatten unter Einzellasted"), Deutscher Ausschuss für Eisenbeton
Hawkins, N.M., (1974). "Shear Strength of Slabs with Shear Reinforcement," Shear in
Reinforced Concrete, SP-42, American Concrete Institute, Special Publication, 785-816.
Kinnunen, S. and Nylander, H. Punching Shear of Concrete Slabs without Shear Reinforcement,
Meddelande Nr 38, Institutionen för Byggnadsstatik, Kungliga Tekniska Högskolan, Stockholm,
1960.
Li, X. (1995). " Pull-out Test of Metal Flat strip," Research report, Center for Cement and
Concrete, The University of Sheffield, 14
Li, X., and Pilakoutas, K. (1995). " Behavior of RC Flat Slabs with Hoop reinforcement,"
Research report, Center for Cement and Concrete, The University of Sheffield, 54
Li, X., and Pilakoutas, K. (1996). " Alternative shear reinforcement for RC beams ", Report No
CCC/94/0040A, Center for Cement and Concrete, Department of Civil and Structural
Engineering, The University of Sheffield, May 1996, 31
Moe, J. (1961). " Shearing Strength of Reinforced Slabs and Footings under Concentrated Load,"
Bulletin D47, Portland Cement Association, 130
Mokhtar, A., Ghali, A, and Dilger, W.H. (1985). "Stud Shear Reinforcement for Flat Concrete
Pilakoutas, K. and Li, X. (1995) "Alternative shear reinforcement in flat slabs", Report No
CCC/94/0030A, Center for Cement and Concrete, Department of Civil and Structural
Engineering, The University of Sheffield, June 1995, 42
Tasker, H.Z., and Wyatt, R.J. (1963). "Shear in Flat-Plate Construction under Uniform Loading,"
Special Report No. 23, Australian Commonwealth Experimental Building Station, Sydney,
Australia.
Wantur, H. (1969). " Dimensioning of Flat Slabs in the Column Region with Simultaneous
Consideration of the Bending and Vertical Reinforcement," Ph.D. Disertation, University of
Table 1 Shear reinforcement details
Slab Links within
1.5d
Links within
2.5d
Links
Total
Total effective
area of links
PSS-A 0 0 None 0
PSS-B 32 56 80 1114
PSS-C 32 56 88 1788
Table 2 Reinforcement Characteristics
Type of reinforcement
Cross section mm
Yield Stress MPa
Strength MPa
High Tensile Strip 25.4 x 0.8 1100 1200
Deformed Type II 12 490 600
Table 3 Concrete Cube, Cylinder and Prism Strength
Slab Cube Strength
MPa
Prism Bending
MPa
Split Cylinder
MPa
PSS-A 32.3 3.42 2.71
PSS-B 39.0 4.19 3.36
PSS-C 41.2 4.46 3.66
Table 4 Maximum Load and Deflection
Slab PSS-A PSS-B PSS-C PSS-D
Max. Load (kN) 454 560 560 560
Table 5 Comparisons of Failure Loads and Modes of Test Results Using BS8110 (1985)
Slab TYPE 1 First Perimeter TYPE 2 Outside Region V V test calc
Mode of failure
Vk(1) Vmax( )2 Vc k(3) Vc k(4) Vmax( )5 Vtest Vcalc(6) Predicted Actual
PSSA 345 - - - 632 454 345 1.32 Punching
PSSB 557 738 967 749 694 560 557 1.00 Type1 Flexural
PSSC 649 745 1099 843 695 560 586 0.96 Flexural Flexural
PSSD 872 755 867 680 695 560 586 0.96 Flexural Flexural (1) Vk = Asv fyv + vck Ud, vck = 0.79 (100As/bd)1/3 (400/deff)1/4 (fcu/25)1/3, U=4c + 12d
(2) Vmax = 2Vc considering a similar slab without shear reinforcement at critical section
(3) Vck = vckUd, using square perimeter 1.5d from the last layer
(4) Vck = Vck(3) but using chamfered perimeter, plus 1.5d for slabs PSSB to PSSE
(5) Maximum shear capacity at column face, shear stress less than 5 x 1.25=6.25 MPa or fcu (6) Vcalc is the lesser of Vk
(1),
Vmax ( )2 , V
ck
( )3,
Vck( )4 , Vmax
( )5 or V
flex, where, Vflex is the expected flexural capacity
Table 6 Comparisons of Failure Loads and Modes of Test Results with ACI318-99
Slab
TYPE 1 First Perimeter
TYPE 2 Outside
V
V
test
calc
MODE OF FAILURE
Vn(1) Vmax(2) Vn(3) Vc(4) V
calc(5) Vtest
Predicted Actual
PSSA - - 318 - 318 454 1.43 Punching Punching
PSSB 289 526 351 1058 351 560 1.60 Type 1 Flexural
PSSC 346 540 360 1235 360 560 1.55 Type 1 Flexural
PSSD 398 546 364 946 398 560 1.41 Type 1 Flexural
(1) Vn = Vc + Vs, Vc = f b dc o / 6, bo 4(cd) (All loads in kN) (2) Vmax f b dc o /2 (d is 139 mm)
(3) Vn Vc, Vc f b dc o / ,3 bo 4(cd) (considering similar slab without shear reinforcement) (4) Vc f b dc o / ,3 ( considering perimeter chamfered d/2 from the outermost shear reinforcement) (5) Vcalc
Vn(1)orVmax(2)orVc(4)
, but VnInclined Shear Reinforcement Sausage Links,
[image:33.595.176.419.104.187.2]Closed Hoop, Open Link
b) Flat steel strip punched with holes
a) The inclined form of shear reinforcement
180 mm 135 mm
The schematic way of representing “Shearband” reinforcement
60 mm
[image:35.595.182.419.109.204.2]60 mm 40 mm
16 @200
12 @200
175 2000
200
200 Dimensions in mm
[image:36.595.179.417.131.199.2]Concrete Cover 20 mm
SS3 SS4
SS5 SS6
SS7 SS8
CL
Slab B
SS1 SS2
Slab C
Strain Gauge Location
SS5
SS6
SS4
SS3 SS7
SS8
Slab D
SS1 SS2
60 80
60 135
60
D5 D4 D3 D2 D1 D6 D7 D8 R25 R40 R60 R85 D9 D10 D11 RS5, RS3 TS1 RS7,8 200 0 RS1 RS2 S1 S2 S3 S4 S5 S6 S8 S9 S10 S11 S12 2000 S7 TS2
S– Strain Gauge
D – LVDT
TS – LVDT
[image:40.595.179.417.102.336.2]RS – LVDT
Loading Frame
Jacks
Slab
[image:41.595.176.423.96.392.2]Reaction
Frame
Loading Frame
[image:42.595.179.416.103.269.2]Slab
A
B
C
D
0
100
200
300
400
500
600
0
5
10
15
20
25
30
Displacement (mm)
Load (kN)
PSSA
PSSB
PSSC
PSSD
[image:44.595.82.515.134.391.2]D11
Fig. 12 Load-displacement relationship for locations D10 and D11
0
100
200
300
400
500
600
0
5000
10000 15000 20000 25000
Microstrain
Load (kN)
PSSA
PSSB
PSSC
PSSD
S1
0
100
200
300
400
500
600
0
5000
10000
15000
Microstrain
Load (kN)
PSSA
PSSB
PSSC
PSSD
S7
Fig.13 Load-strain relationship for strain gauges S1 and S7 on the flexural reinforcement
0
100
200
300
400
500
600
0
1000
2000
Microstrain
Load (kN)
PSSB
PSSC
S3
0
100
200
300
400
500
600
0
500
1000
1500
2000
2500
Microstrain
Load (kN)
PSSB
PSSC
[image:46.595.77.521.107.598.2]S4
Fig. 14 Load-strain relationship on shear reinforcement on locations S3 and S4 in PSSB and
PSSC
0
100
200
300
400
500
600
0
500
1000
Microstrain
Load (kN)
PSSD
S2
0
100
200
300
400
500
600
0
2000
4000
6000
8000
Microstrain
Load (kN)
S6
S8
[image:47.595.88.510.108.578.2]PSSD
Fig. 15 Typical load-strain relationship in shear reinforcement in PSSD
LIST OF FIGURE CAPTIONS
Fig. 1 Typical types of conventional shear reinforcement
Fig. 2 Stud Rail shear reinforcement
Fig. 3 Inclined Shearband reinforcement
Fig. 4 Detail of flexural reinforcement and column reinforcement
Fig.5 Shear reinforcement of slabs PSSB (left) and PSSC (right)
Fig. 6 Reinforcement in slab PSS-B
Fig.7 Shear Reinforcement in Slab PSSD
Fig. 8 Positions of instrumentation
Fig. 9 Schematic representation of test set-up
Fig. 10 Slab PSS-B under load
Fig.11 Section through the slabs at failure
Fig. 12 Load-displacement relationship for locations D10 and D11
Fig.13 Load-strain relationship for strain gauges S1 and S7 on the flexural reinforcement
Fig. 14 Load-strain relationship on shear reinforcement on locations S3 and S4 in PSSB and PSSC