This is a repository copy of Climate-surface-pore-water interactions on a salt crusted playa: implications for crust pattern and surface roughness development measured using terrestrial laser scanning.
White Rose Research Online URL for this paper: http://eprints.whiterose.ac.uk/92263/
Version: Accepted Version
Article:
Nield, J.M., Wiggs, G.F.S., King, J. et al. (4 more authors) Climate-surface-pore-water interactions on a salt crusted playa: implications for crust pattern and surface roughness development measured using terrestrial laser scanning. Earth Surface Processes and Landforms. ISSN 1096-9837
https://doi.org/10.1002/esp.3860
This is the peer reviewed version of the following article: 10.1002/esp.3860, which has been published in final form at http://dx.doi.org/10.1002/esp.3860. This article may be used for non-commercial purposes in accordance with Wiley Terms and Conditions for Self-Archiving.
[email protected] https://eprints.whiterose.ac.uk/ Reuse
Unless indicated otherwise, fulltext items are protected by copyright with all rights reserved. The copyright exception in section 29 of the Copyright, Designs and Patents Act 1988 allows the making of a single copy solely for the purpose of non-commercial research or private study within the limits of fair dealing. The publisher or other rights-holder may allow further reproduction and re-use of this version - refer to the White Rose Research Online record for this item. Where records identify the publisher as the copyright holder, users can verify any specific terms of use on the publisher’s website.
Takedown
If you consider content in White Rose Research Online to be in breach of UK law, please notify us by
Climate-surface-pore-water interactions on a salt crusted playa: implications for crust pattern and surface roughness development measured using terrestrial laser scanning
Joanna M. Nield1*, Giles F.S. Wiggs2, James King2,6, Robert G. Bryant3, Frank D. Eckardt4,
David S.G. Thomas2,4,5, Richard Washington2
*Corresponding author: Email: [email protected]; Tel: + 44 23 8059 4749
1
Geography and Environment, University of Southampton, Highfield, Southampton, SO17
1BJ, UK
2
School of Geography and the Environment, Oxford University Centre for the Environment,
University of Oxford, Oxford, OX1 3QY, UK
3
Department of Geography, University of Sheffield, Sheffield, S10 2TN, UK
4
Department of Environmental and Geographical Science, University of Cape Town,
Rondebosch 7701, South Africa
5
Geography, Archaeology and Environmental Studies, University of the Witwatersrand,
Johannesburg 2050, South Africa
6
Département de géographie, Université de Montréal, Montréal, QC, H3C 3J7, Canada
Abstract
Sodium accumulating playas (also termed sodic or natric playas) are typically covered by
polygonal crusts with different pattern characteristics, but little is known about the short-term
(hours) dynamics of these patterns or how pore water may respond to or drive changing salt
crust patterning and surface roughness. It is important to understand these interactions
because playa-crust surface pore-water and roughness both influence wind erosion and dust
emission through controlling erodibility and erosivity. Here we present the first high
resolution (10-3m; hours) co-located measurements of changing moisture and salt crust
topography using terrestrial laser scanning (TLS) and infra-red imagery for Sua Pan,
Botswana. Maximum nocturnal moisture pattern change was found on the crests of ridged
surfaces during periods of low temperature and high relative humidity. These peaks
experienced non-elastic expansion overnight, of up to 30 mm and up to an average of 1.5
mm/night during the 39 day measurement period. Continuous crusts on the other hand
showed little nocturnal change in moisture or elevation. The dynamic nature of salt crusts and
the complex feedback patterns identified emphasise how processes both above and below the
surface may govern the response of playa surfaces to microclimate diurnal cycles.
Key Words: sodium sulphate, terrestrial laser scanning (TLS), aeolian dust source, playa
Introduction
Playas (or salt pans; see Briere, 2000) are common in dryland landscapes and typically form
salt or clay crusts which exhibit variable moisture both spatially and temporally (Bryant,
2013; Cahill et al., 1996; Gillette et al., 2001; King et al., 2011; Nickling and Ecclestone,
1981; Nickling, 1984). Quantifying moisture within salt containing crusts and sediments on
playas is important because it is a major contributor to uncertainty in: i) surface energy and
moisture balances (Bryant and Rainey, 2002; Burrough et al., 2009) ii) dust emission
(Baddock et al., 2009; Bullard et al., 2011; Haustein et al., 2015; Prospero et al., 2002;
Washington et al., 2003; Washington et al., 2006) and iii) salt accumulation rates and styles
(Rosen, 1994; Tyler et al., 2006). We know that salt crusts can influence surface topography
and patternation on playa surfaces in both a profound and rapid manner (crusts can develop at
a rate of as much as 30 mm/week; Nield et al., 2015). Once developed, surface salt crust
patterns can significantly alter surface and aerodynamic roughness and ultimately dust
emission thresholds (Darmenova et al., 2009; Lancaster, 2004; MacKinnon et al., 2004;
Marticorena and Bergametti, 1995; Nield et al., 2013b). Although remote sensing studies
have attempted to depict crust moisture and roughness variability on playas over monthly
timescales (Archer and Wadge, 2001; Bryant, 1999; Mahowald et al., 2003; Tollerud and
Fantle, 2014; Wadge and Archer, 2002; Wadge and Archer, 2003); the results show
significant spatial/temporal variability and are far from straightforward to interpret.
Ultimately, we know very little about the small-scale temporal (hours) and spatial (mm)
dynamics of interstitial or pore moisture patterns on playas, and how the interaction of the
moisture with evaporite minerals relates to the development of both crust topography and
Polygonal salt crusts (Figure 1) are commonly found on playas (Reeves, 1969), including at
Owens Lake, USA (Gillette et al., 2001; Saint-Amand et al., 1986; Saint-Amand et al., 1987),
Lake Eyre Australia (Bonython, 1956), and in the Atacama desert (Stoertz and Ericksen,
1974). Polygonal pressure ridges form when expansive evaporite minerals precipitate at the
surface of a playa through a combination of thermodynamic and geochemical mechanisms
(Kendall and Warren, 1987; Krinsley, 1970; Lowenstein and Hardie, 1985; Pakzad and
Kulke, 2007; Reeves, 1969). The accumulation of evaporite minerals on a playa surface is
broadly controlled by a combination of water table depth, evaporation rates and the
salinity/geochemistry of shallow groundwater; which is itself a function of basin
inflow/closure (Tyler et al., 1997). Therefore playas with the most erodible crusts (providing
opportunity for significant dust flux) typically form when saline groundwater is in close
proximity to the playa surface (often < 1m); thereby maximising the impact of evaporation
rates on the underlying groundwater, which can lead to movement of salts upwards through
the sediment pile, development/breakdown of clay-rich sedimentary fabrics, and ultimately
salt deposition at the surface (Buck et al., 2011; Reynolds et al., 2007; Rosen, 1994). In these
cases, salt accumulation at the surface of playas can take place over time-scales ranging from
hours to many thousands of years through free evaporation at the surface driving the
movement and precipitation of evaporite minerals within the shallow capillary fringe (Tyler
et al., 1997).
Playa surfaces dominated by sodium-rich salts can be particularly responsive to changes in
surface moisture/pore water (Legates et al., 2011; Pelletier, 2006; Reynolds et al., 2007) as
these salts (both sodium carbonates and sulphates) readily alter their phase in response to
threshold changes in temperature and humidity (Saint-Amand et al., 1986). For example, the
dehydrated salt thenardite (Na2SO4) can hydrate to form mirabilite (Na2SO4•10H2O) which
equilibrium or deliquescence relative humidity RHeq) and where temperatures range between
0 and 20°C (Kracek, 1928; Steiger and Asmussen, 2008). Indeed, it is typical for hydrated
phases of sodium sulphate and sodium carbonate salts to decrease in solubility as temperature
falls (e.g. Benavente et al., 2015). Ultimately, when reduction in temperature is rapid, the
phase change to hydrated Na2-SO4/Na-2CO3 phases (e.g. thenardite mirabilite) can lead to
an increase in the size of deposited salt crystals, often by fourfold or more, and is often
accompanied by significant changes to the crystallisation pressure (Benavente et al., 2015;
Saint-Amand et al., 1986; Tsui et al., 2003) resulting in further changes to internal surface
crust structure, surface crust expansion and cracking. Within most playa systems (particularly
those with pore water chemistry dominated by Na-CO3-SO4-Cl) a range of indicative
hydration/dehydration evaporite mineral phase transitions may be achieved both within playa
crusts (Drake, 1995; Eugster and Jones, 1979; Eugster and Smith, 1965) and the dust particles
that they produce (Jentzsch et al., 2013).
The microclimates of desert playas can be extreme with atmospheric- and pore-moisture
fluctuating diurnally in response to changes in relative humidity, temperature, and depth to
ground water. High diurnal temperature ranges mean that fluctuations in playa surface
pore-water concentration and chemistry are particularly significant both overnight and early in the
morning (Groeneveld et al., 2010; Kampf et al., 2005). This general change in moisture
availability at the sediment surface can be manifested either within the chemical structure of
the evaporite minerals or as free water within the pores of the crust fabric (Mees et al., 2011).
On playa surfaces, moisture transfer can occur both above and below any apparent crust
through evaporation, capillary transport (Benavente et al., 2004; Benavente et al., 2011;
Genkinger and Putnis, 2007; Grossi et al., 2011; Rodriguez-Navarro et al., 2000), and
occasionally surface condensation (Kinsman, 1976; Thorburn et al., 1992). The effectiveness
(e.g. pore connectivity), the shape of the crust (as depicted in Figure 1), and the degree of
connectivity between the crust and the underlying moist substrate (Peck, 1960; Turk, 1975).
Thus, as a salt crust develops at the surface through precipitation of evaporite minerals,
surface roughness and subsurface texture/connectivity can change dramatically. In addition,
changes to the relative contribution of moisture inputs from release of water of hydrated
minerals, as well as atmospheric or soil/groundwater sources are also apparent
(Sanchez-Moral et al., 2002). In particular, continuous, sealed crusts may reduce evaporation from the
playa surface to extremely low levels (Gran et al., 2011; Groeneveld et al., 2010; Tyler et al.,
1997). Conversely, degraded, cracked or discontinuous crusts may encourage or control the
spatial distribution of evaporation, moisture flux and surface efflorescence (Krinsley, 1970).
Terrestrial laser scanning (TLS) is a non-invasive tool (Buckley et al., 2008) that is able to
provide high resolution spatial information (millimetres) about salt crust surface change
through time, both in terms of topography (Nield et al., 2015) and also various characteristics
of surface properties derived from the intensity of the return signal (Lichti, 2005), including
surface moisture (Armesto-González et al., 2010; Nield et al., 2011; Nield and Wiggs, 2011).
Time-lapse cameras are also useful for examining changes in surface patterns. For example
they have been used to identify i) ripple migration (Lorenz, 2011; Lorenz and Valdez, 2011),
ii) salt crystal formation in heritage buildings (Zehnder and Schoch, 2009)) and iii) surface
moisture (Darke et al., 2009; Darke and Neuman, 2008; McKenna Neuman and Langston,
2006).
Here, for the first time, we seek to untangle the behaviour of playa surfaces; and in particular
surface, pore or hydrated salt moisture and polygonal pattern dynamics of salt crusts. We do
this through three targeted experiments and identify for the first time how dynamic these
examine nocturnal moisture changes on a crust with a mix of ridged and continuous sections
over a 39 day period using infra-red (IR) imagery and determine the change in elevation at
this site over the same period using TLS. Next, (Experiment 2) we use TLS to examine the
relationship between topographic and moisture change for different crusted surfaces during
the night and, finally, (Experiment 3) we determine how the crust dries at dawn, again using
TLS. For each crust type we relate differences in moisture and topographic change to distinct
temperature and relative humidity conditions; which are in turn used to infer geochemical and
thermodynamic processes occurring in surface and groundwater within the critical zone. We
limit our study to nocturnal and early morning changes because this is when evaporation rates
are suppressed and the surface has the potential to remain moist through fluxes via subsurface
capillary or atmospheric condensation mechanisms (Groeneveld et al., 2010; Kinsman, 1976;
Sturman and McGowan, 2009; Thorburn et al., 1992) for a sufficient time and magnitude that
can be detected by IR camera and TLS (Nield et al., 2011; Nield et al., 2014).
Study Site
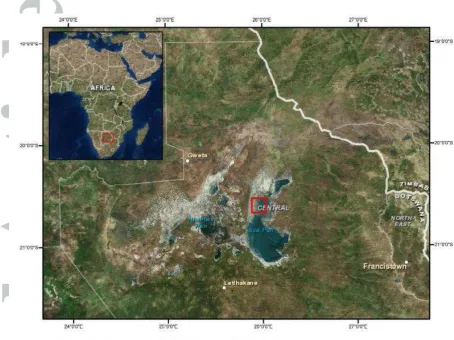
Field experiments were conducted on Sua Pan, Botswana (site location is centred at
20.5754°S, 25.959°E; See Figure 2) during the dry season in August, 2011 and August and
September 2012. Sua Pan is a 3400 km2 wet terminal discharge playa (Rosen, 1994) with a
predominantly trona [Na3H(CO3)2:2H2O], halite [NaCl] and thenardite[Na2SO4] crust
(Eckardt et al., 2008; Vickery, 2014) and is part of the Makgadikgadi Pan complex; one of
the southern hemisphere’s largest aeolian dust source areas (Prospero et al., 2002; Vickery et
al., 2013; Washington et al., 2003; Zender and Kwon, 2005). Sua Pan periodically floods
during the summer but the surface remains dry for most of the year (Bryant et al., 2007), with
groundwater depths typically in the range 0.5-3.0 m over much of the pan (Eckardt et al.,
ranges of 9.6˚C to 29.3˚C and 13.3˚C to 32.9˚C in August and September respectively and
mean monthly rainfall is 0.3 mm and 4.7 mm respectively. The pan is covered by a polygonal
salt crust with spatially varying topographic characteristics (Nield et al., 2015; Nield et al.,
2013b). Measurements for each experiment were collected at sites with three distinct crust
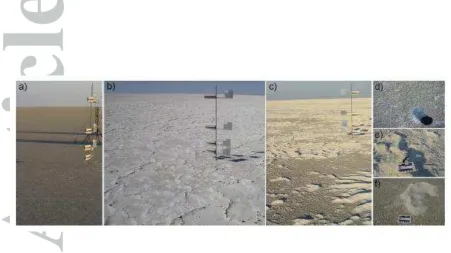
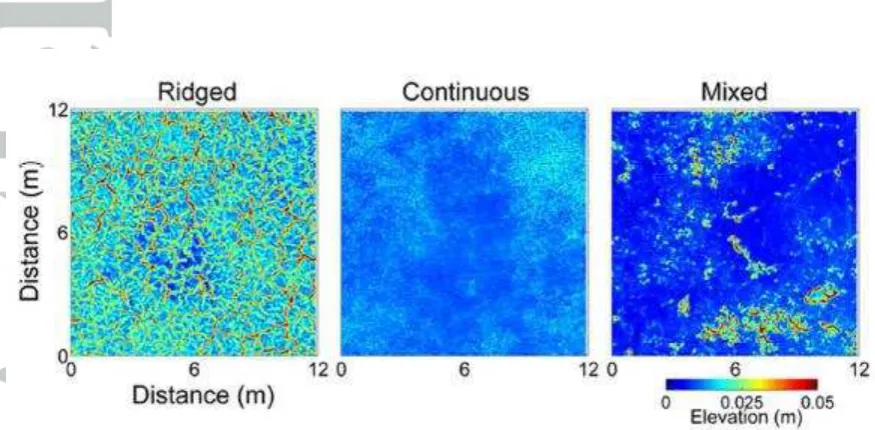
types: (1) Ridged, (2) Continuous and (3) Mixed (Figure 1). Ridged surfaces consisted of
well-formed, widely spaced, deep polygon ridges with some evidence of degradation and
cracks within ridge surfaces and were composed of trona, halite and thenardite (Vickery,
2014). The Continuous sites were dominated by flat crust with occasional small, closed
ridges and were predominantly composed of thenardite, with some mirabilite, halite and trona
(Vickery, 2014). Mixed sites contained more irregular surface crust patterns, predominantly
continuous and flat but with some notable disconnected ridged portions.
Methods
Time-lapse camera data collection and processing
Experiment 1 investigated the relationship between nocturnal moisture and climatic
conditions using temporal series of LTL Acorn 5211A time-lapse camera images collected
during 39 nights. A mixed surface (M1) was targeted to compare the response of ridged and
continuous surfaces simultaneously with the same external climatic forcing. The camera was
placed at a height of 1.5 m above the crust and programmed to record images every ten
minutes with a resolution of 5 mega-pixels. The camera recorded true colour images
passively during daylight and switched to active infra-red (IR) flash mode once its light
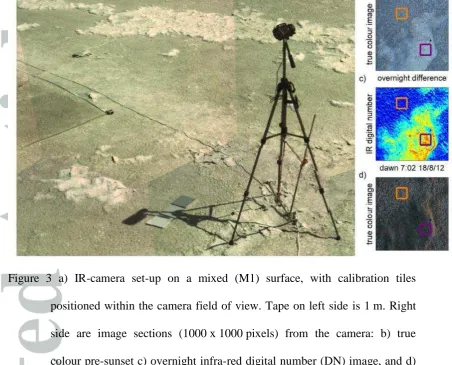
sensor detected darkness (Figure 3). The photo sequences were post-processed to determine
when the IR flash was used and a sequence of photos for each night were extracted between 1
hour after darkness and 30 minutes before sunrise to exclude any residual sunlight
of the crust or water vapour derived from the crust) was then inferred from these IR photo
sequences. The IR flash on the camera was 940 nm which is ideal for moisture detection
because it is close to a key interstitial moisture absorption band for soils and sediments (Clark
et al., 2007), and so lower digital numbers (DN; akin to reflectance factor) within an IR
image were likely to correspond to higher moisture within the top few mm of the crust.
Atmospheric conditions can also influence general reflectivity collected by this sort of
imaging sensor, and so careful normalisation of crust reflectance values was undertaken using
a standard grey calibration tile (15 x 15 cm) that was placed within the camera field-of-view
on the surface of the crust. Similar links to decreased reflectance in response to higher pore
moisture, or from minerals with greater structural or absorbed water, have been made in
larger scale remote sensing of sodic playas by Mees et al. (2011). We therefore calculated
mean DN values of 100 x100 pixel squares in each IR image for a) the calibration tile, b) a
ridged crust and c) a continuous crust. The two crust sections were adjacent to each other and
within the centre of the camera field-of-view (Figure 3). Mean values for the crust sections
were then normalised using the calibration tile value for each individual image. We refer to
this ratio as the dimensionless DN ratio (DNR). A DNR time-series collected in this manner
gave us a non-invasive time-dependant index of surface absorption of the active infra-red
light source; and is used here to infer variability in surface moisture with the playa salt crust.
Further active IR measurements were collected in a similar manner using this approach at
ridged (R3), mixed (M2) and continuous (C3) sites over a single night to enable a comparison
of the IR and TLS relative moisture methods. DNR values were calculated in the same
manner, using a calibration tile and a single 100 x 100 pixel crust section in the centre of the
TLS data collection and processing
Experiment 1 was complemented by TLS measurement of surface change over the same 39
night period. Crust topography was characterised on a) night 1 and b) night 39 using a
time-of-flight Leica Scanstation. The TLS was placed at a height of 2.3 m and undertook a 360°
scan overnight with a specified resolution of 5 mm at 30 m distance. A 10 x 10 m section of
points were extracted from registered scans for each of the two nights (mean registration error
1 mm). Elevation points were gridded using mean values and 1 cm spacing, and empty cells
were interpolated in MATLAB (Mathworks Inc) using the natural neighbour method and the
surfaces were differenced to determine total change.
TLS return signal intensity (532 nm) has been documented as a useful tool for examining
surface moisture on sand, particularly within a range 0 to 4 % gravimetric moisture content
(Kaasalainen et al., 2008; Nield et al., 2011) and salt crusts, including surfaces sprayed with
up to 800 ml/m2 (Nield et al., 2014). TLS is ideal for measuring changes in moisture on the
playa surface, as it indicates the relative moisture of the crust at the surface (sub-mm), which
is important for dust emission thresholds, rather than a depth averaged measurement as
typically recorded by theta probes (Edwards et al., 2013). We indicate relative moisture
change by normalising the nocturnal return signal intensity by daytime values on the same
surface following the methods of Nield et al. (2014). This comparison excludes any influence
of distance (metres) on intensity values (Burton et al., 2011; Nield et al., 2013a; Nield et al.,
2014) because each nocturnal value is normalised by the coincident value measured at the site
during the previous day. Lower ratio values indicate an increase in moisture on the crust
because more of the TLS signal has been absorbed.
In experiment 2 we use both the elevation and relative moisture capabilities of the TLS to
We investigated two ridged (R1, R2) and two continuous (C1, C2) crust surfaces to explore
the crust topography-moisture change relationship under different climate conditions. For
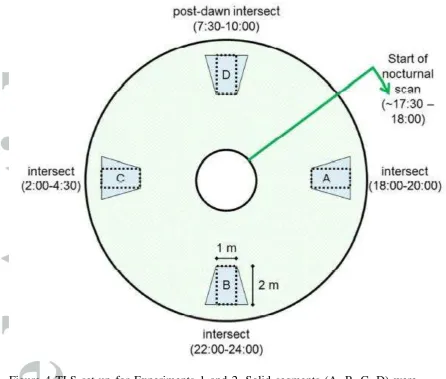
experiment 2 nocturnal surface changes were assessed using four coincident 1 m x 2 m
sections of crust (Figure 4). Initial scans of these four areas were undertaken during the day
(before 16:40, scan times indicated in Table 1) to determine the daytime surface topography
and surface dryness. These small pre-nocturnal scan sections took approximately 5 minutes to
acquire, had an average point density of 34,500 points/m2, and were located at a Euclidean
distance of approximately 12.2 m from the scanner location and approximately 90° from each
other. During the 360° nocturnal scan, three of these areas were rescanned overnight and the
final area was rescanned after sunrise (Figure 4; see Table 1 for scan, sunset and sunrise
times). These co-located repeat scan sections were then used to determine overnight and
post-nocturnal net topographic change using the same topographic methods as experiment 1.
Relative moisture change was determined from the same TLS point measurements over these
co-located repeat scan sections following the methodology of Nield et al. (2014) and outlined
above. For TLS moisture ratios, average intensity values for each 1 cm2 grid cell were
smoothed using a 9 x 9 cm moving window to reduce the influence of mixed pixels due to the
laser footprint size (Hofle and Pfeifer, 2007; Nield et al., 2011). The 360° scan values for
each co-incident 1 cm2 grid cell were then normalised using the daytime small section grid
cell values to determine overnight and post-nocturnal relative moisture change and recovery.
In experiment 3 we explore the relationship between climatic conditions and crust drying at
dawn when atmospheric temperatures increase. For this experiment, a small section of the
same ridged crust (1 x 2 m) was scanned over a two day period when climate varied (R4, R5).
TLS measurements of the surface were repeated hourly before (5:40) and after (6:40, 7:40)
sunrise. This area was also located at a Euclidean distance of 12.2 m from the TLS. Changes
The TLS was unable to detect changes in topography or moisture during the day. Spatially
coincident daytime scans at a ridged site measured during the same day had uninterpolated
elevation differences of less than 3 mm which is within the error range estimated by Hodge et
al. (2009) for repeat scans of stony surfaces. Relative TLS moisture ratios measured during
the day on the same crust surface did not detect any moisture change.
At each site examined in experiments 2 and 3 (R1, R2, R4, R5, C1, C2), 12 m x 12 m
sections of points were extracted from an overnight 360° scan and processed into surfaces
using the same methods as experiment 1. Additional scans were also undertaken following
the same collection and processing methods as experiment 2 at a mixed (M2) and ridged (R3)
site to enable a comparison of TLS and IR camera relative moisture calculations. Ridge width
and spacing was calculated for all surfaces measured by TLS using the zero-up- and
down-crossing method (Goda, 2000) to identify individual ridge units on 1 cm resolution transects,
following the methods of Nield et al. (2013b).
Near-surface and sub-surface climate and geochemistry
TLS and camera data were supplemented with a range of additional meteorological
measurements pertinent to examining atmospheric surface and subsurface feedbacks.
Temperature and relative humidity were measured every ten minutes below the crust during
experiments 1 and 2 using DS1923 iButtons (Maxim Integrated). These were inserted at each
site approximately 1 cm beneath the crust at least two weeks before measurements
commenced and several metres away from the section of crust being measured with the TLS
to minimise any crust disturbance. An additional iButton was placed directly on top of the
crust in a flat section for the experiment 3. Temperature and relative humidity at 1 m above
the surface were also recorded every 10 minutes throughout the experiments in the centre of
probe, housed in a radiation shield. Delta T theta probes recorded gravimetric moisture
content integrated over a depth of 2 cm from the surface. Theta probe measurements were
averaged to indicate daily mean values.
Across the field site, shallow groundwater samples were collected to investigate the
geochemistry of natural water within the capillary/critical zone. Using a sterile pump
sampler, water samples were extracted from pre-installed dip-wells. Groundwater depths
ranged from 0.5-1.3m across the study area. In situ measurements of water temperature and
pH were obtained at the time of sample collection. Samples were then immediately sealed,
bagged in a light-tight container and were returned to the laboratory for analyses with
minimal change in sample temperature. Once in the laboratory, standard methods were used
to derive major cation and anion species (see Eckardt et al., 2008). As Benavente et al.,
(2015) outline, salt precipitation in a solution can occur through (i) changes in relative
humidity (to reach the RHeq), (ii) changes (often reduction) in temperature which can invoke
changes in mineral solubility, and (iii) via dissolution of lower hydrated forms and the
precipitation of the hydrated salts through changes in thermodynamic conditions. We provide
here simulations of key components of these processes, using PHREEQC version 3.2
(Parkhurst and Appelo, 1999) with the Pitzer Database (Bryant et al., 1994) in order to
characterise the stability and presence of likely mineral phases from the Na2SO4-H2O and
Na2CO3-H2O systems under a range of recorded surface conditions.
Crust and underlying sediment samples were also analysed for bulk salt content. Surface
sediment samples were sealed in bags and returned to the laboratory where soluble salts were
removed using a standard rinse treatment with distilled water to determine the percentage
Results
Crust samples from the centre of the study site in 2011 had up to 82 % soluble salt by mass,
whilst the underlying sediment contained up to 51 % soluble salt. In 2012 soluble salts by
mass ranged from 57.7 to 76.9 % on the crust surface (Table 1). Generally, samples of
shallow groundwater water displayed a pH > 9, and had high conductivity values (> 300,000
µS/cm). Analysis of mineral saturation data via PHREEQC (Bryant et al., 1994) suggest that
typical shallow groundwater at our sites sampled at temperatures of between 20oC and 25oC
were readily able to precipitate (i.e. were either saturated or supersaturated with respect to) a
range of key Na2SO4-H2O and Na2CO3-H2O evaporite phases (Table 2 (a)).
Using PHREEQ we were able to determine key mineral components within our groundwater
samples. At in situ daytime sample temperatures of between 20C and 25C, groundwater
samples were generally saturated with respect to CaCO3 phases (Calcite, Dolomite, Huntite)
and undersaturated with regard to both Na2SO4-H20 (thenardite, mirabilite ) and Na2CO3-H2O
(Natron, Trona, Nacholite) phases. However some samples were initially saturated with
regard to Nacholite (NaHCO3) Pirssonite (Na2Ca(CO3)2:2H2O) and Gaylussite
CaNa2(CO3)2:5H2O; suggesting that these phases could be present at the groundwater
interface. Given these data, we were then able to simulate changes in mineral saturation
within the samples as temperatures were either lowered or raised (i.e. from 0°C to 60°C)
without further evaporation. In the first instance (Table 2), we found that as temperatures
tended towards 0°C, mirabilite consistently reached super-saturation, Nacholite became
under-saturated, and Pirssonite/Gaylussite were unaffected. Thereafter, as the temperatures
were increased above 30°C (Table 2 (b)) we observed supersaturation with respect to Trona
For each sample, we were able to use PHREEQ to forward-model the evaporation process in
order to chart the precipitation (expressed as a molar yield) of likely key evaporite phases as
the groundwater sample becomes concentrated over time; simulating the capillary rise and
evolution of moisture as it moves to the surface. Given the importance of night-time
temperature and RH, these experiments were undertaken at, 3°C, 8°C, 12°C, 20°C (Table 2
(c)). Importantly these data suggest that further evaporation of our samples at 20°C and above
would yield a surface evaporite mineral assemblage of Thenardite and Trona with additional
Pirssonite. As the temperature was systematically reduced to 3°C we found that the evaporite
mineral assemblage changed to Halite, Mirabilite, Trona, and Pirssonite. The change in
Mirabilite/Thenardite stability was observed to be apparent as the temperature dropped below
18°C. These experiments therefore highlight two key factors which can help us understand
salt crust and moisture dynamics on our field site: (1) the confirmed presence of key Na2SO4
-H2O and Na2CO3--H2O evaporite phases (Thenardite, Mirabilite, Trona, Pirssonite, with
ancillary Halite), and (2) the likely hydration/dehydration of Mirabilite/Thenardite under
observed conditions in the presence of moisture.
TLS topographic measurements show three distinct ridged, continuous and mixed surface
patterns (Figure 5). Mean ridge heights and widths range from 0.018 m and 0.2 m on
well-developed ridged surfaces, to 0.004 m and 0.08 m on continuous surfaces (Table 1).
TLS ratio and DNR measurements both indicate a similar synchronous variation in mean
relative surface moisture for the different crust types (R2 = 0.98; Figure 6). Co-incident theta
probe moisture measurements integrated over the top 2 cm of each crust follow the same
consistent trend as the TLS and DNR measurements and, specifically, the ridged surfaces are
highlighted as being the driest and the continuous surfaces as the wettest. Surface or pore
topographic patterning. This was most noticeable on mixed and continuous crust examples
(Figure 6c and 6e) where the inferred moisture had the greatest standard deviation.
Experiment 1: Changes in moisture on a mixed surface
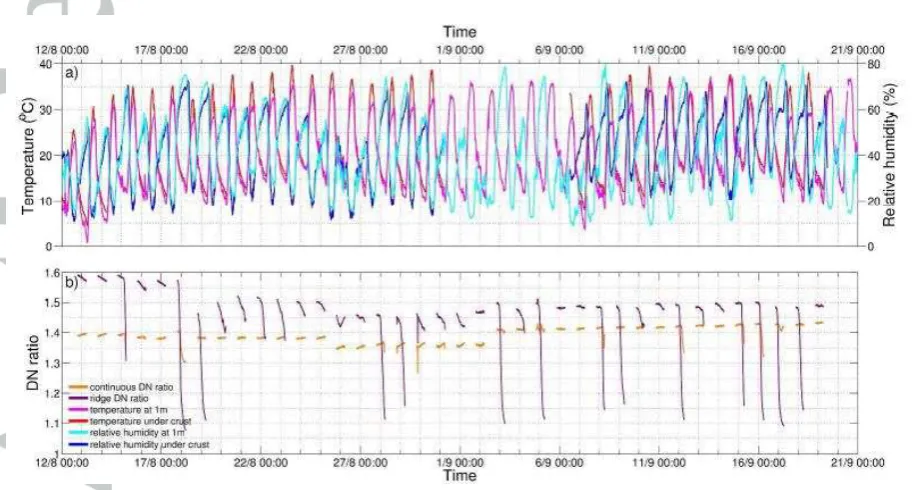
During experiment 1 relative humidity and temperature at site M1 were inversely correlated
(coefficient = -0.65), with high humidity and low temperatures experienced overnight (Figure
7 a). In general, the ridged area at M1 was drier than the continuous surface (Figure 7 b).
However, on nights with high relative humidity (>70%; 14 occasions during the measurement
period) the IR camera data showed that the DNR on the ridges dropped below the DNR
observed on the continuous areas (approximately 1.4). During these periods when night-time
relative humidity was high, the moisture of the continuous areas remained stable (9
occasions) or only increased by a small amount (<0.1), whereas a much larger increase
(>0.28) in moisture was observed on the ridges. Importantly, this indicated that: (a) moisture
on crust ridges fluctuated more than moisture on continuous crusted surfaces and (b) that
ridged components of crusts were significantly more responsive to changes in atmospheric
relative humidity. Mean overnight wind speeds during the measurement period varied from
0.68 m/s to 6.1 m/s, and did not appear to influence the responsiveness of the ridged surfaces
(correlation coefficient = 0.09).
Interestingly, during experiment 1 the ridges on the mixed crust surface were seen to change
significantly in both elevation and width (Figure 8); by as much as 1.5 mm/night on larger
ridges. However, at the same time, continuous crusted areas remained relatively static
(asymmetric distribution; mean elevation change = 0.187 mm/night; Figure 8c). This
differential spatial trend in development in the ridged components of crusts is confirmed by a
Experiment 2: Topographic and moisture change for different crusted surfaces
When observing ridged (R1, R2) and continuous (C1, C2) surfaces we can see that surface
moisture within the crusts responded to climatic conditions in a similar way to the mixed
surface (M1; experiment 1). Minimum temperature and maximum relative humidity values at
1 m above the surface varied during each of the four nocturnal study periods (R1, R2, C1, C2;
Figure 9). Importantly, overnight surface temperatures at 1 m for an example of each crust
type (R1, C2) were seen to drop below the 10°C threshold, that Saint-Amand et al. (1986)
and Gillette et al. (2001) suggested was important for the salt phase switch from thenardite to
mirabilite on Owens Lake. This period of low temperature also corresponded to an increased
relative humidity at 1 m (> 60 %) indicative of a thenardite to mirabilite phase change. All of
our relative humidity measurements were below 75 % which previous studies suggest is the
minimum relative humidity required to observe overnight condensation on halite dominant
crusts (Kinsman, 1976; Thorburn et al., 1992). Wind speeds were low and similar during each
experiment (Table 1).
The morphology of the crust was observed to have a significant impact on sub-crust
micrometeorology. At the ridged sites (R1, R2), cracks within the crust enabled the relative
humidity below the crust on the ridged area to increase at a similar rate to that measured at 1
m above the surface (Figure 9). The subsequent decrease in relative humidity at dawn below
the crust lagged behind the above crust relative humidity by an average of 1.5 hours. In
contrast, the closed continuous crusts (C1, C2) maintained a high and stable sub-crust relative
humidity throughout the experiment periods (Figure 9). This stability in relative humidity
was irrespective of the conditions measured at 1 m height.
The nocturnal change in moisture in response to overnight decreases in temperature and
general, the ridged surfaces had a topographically controlled and spatially organised response
(Figures 10 and 11). Overnight, ridged areas of crusts became progressively moister
(elevation and TLS intensity ratio negatively correlated; Table 3), while continuous areas of
crusts (between ridges) remained at, or close to, daytime moisture levels. The moistening of
ridged areas was seen to be strongest during the night where high relative humidity
conditions prevailed (correlation coefficient -0.63; Figure 11 R1). During the night with
lower relative humidity (R2), the TLS only detected an increase in moisture on the upper
sections of ridges (correlation coefficient -0.03; Figure 11 R2). Importantly, we observed that
all crust surfaces quickly returned to typical daytime moisture values in the morning (9:00,
9:50 for R1 and R2 respectively); almost entirely replicating the same TLS intensity values as
observed on the previous day.
Overnight change in surface elevation on the ridged surfaces was observed to vary depending
on the prevailing atmospheric conditions (Figure 12). During the evening with high relative
humidity (Figure 12a R1), the continuous parts of the surface (between ridges) swelled by an
average of 3 mm, whilst ridges either expanded or opened (mean coefficient for ridge areas
and increased elevation = 0.21). Some isolated ridge sections changed their elevation by up to
30 mm; an order of magnitude higher than the continuous crusted areas. However, by 9.00
am, the continuous sections of crust had sunk back to their normal daytime elevation; but
some ridge expansion remained. During the warmer, drier evening (Figure 12b R2), there was
no detectable change in the continuous (inter-ridge) areas (mean elevation change less than 1
mm), but irreversible ridge expansion still occurred (maximum 8 mm).
Notably, the overnight moisture patterning of the continuous crusts was not correlated to
topography (Figures 10 and 11; Table 3). Instead, small, isolated patches on the surface
measurements show that moistening was greater on the warmer, drier night (C1), and the
surface dried more slowly on the cooler night (C2), when some moist patches were still
measurable at 7:30am. There was minimal surface swelling overnight on the continuous
surfaces (mean values ~2 mm), within the detection limits of the TLS and without spatial
coherence. In contrast to the ridged surfaces the continuous surfaces returned to the same
elevation as the previous day after sunrise.
Experiment 3: Early morning changes in moisture on a ridged surface
During the dawn drying experiment (3) the atmospheric relative humidity at 1 m above the
crust was high on the first morning (maximum 83%; R4) and moderate on the second
morning (maximum 70%; R5; Figure 13). During this experiment moisture was observed to
be greatest on the ridged areas, while the continuous areas remained relatively constant
(Figure 14). On the morning with high relative humidity (17th September 2012), the overall
surface took longer to return to its daytime moisture levels; some ridges still indicated higher
moisture levels 1.5 hours after sunrise. On the moderately humid morning (18th September)
the majority of the surface had returned to daytime moisture levels 1.6 hours after sunrise.
The IR camera (Figure 7b) on the mixed site (M1) demonstrated that on the night of the
16-17th September, the DNR of ridged surface dropped from 1.48 to 1.095, indicating a
significant increase in moisture. IR camera DNR measurements during the night with
moderate relative humidity (17-18th September) agree with TLS findings and show a smaller
ridge moisture increase (DN ratio 1.48 to 1.145).
Atmospheric conditions, crust dynamics and the sodium sulphate phase diagram
Results from experiment 3 show how responsive crust dynamics can be to variable
atmospheric conditions. During the drier (RH 70%) morning of the 18th (R5), the crust
stability zone of the thenardite-mirabilite phase diagram (Figure 13;Kracek, 1928; Steiger
and Asmussen, 2008), while on the cooler, more humid morning of the 17th (R4), the first two
measurements fall within the mirabilite stability zone. Given that the initial findings from
geochemical modelling of groundwater also confirm that these phases are likely to be present
under these conditions, we use this phase diagram as a proxy for the likelihood that the salts
will absorb atmospheric and surface moisture when temperature and relative humidity are
conducive to sodium sulphate mineral hydration (mirabilite formation). The phase diagram
itself describes the stability thresholds for pure samples of thenardite and mirabilite. Thus,
although we have shown that our crusts are more likely to be made up of intricate mixtures of
sodium sulphate/carbonate evaporites and other minerals (clays, clastic, halite, etc), it is clear
that the relative stability of these surfaces will still be governed by differential changes in
atmospheric and surface temperature and humidity observed both within and above the
surface crusts. Therefore, although the maximum relative humidity at 1 m above the surface
for both nights was within the mirabilite stability zone (Kracek, 1928; Steiger and Asmussen,
2008), conditions remained in this zone for a much longer period on the 17th. By sunrise
(6:08) on the 18th, the measurements at 1 m height were situated on the mirabilite-thenardite
boundary, and measurements on the continuous surface were inside the thenardite stability
zone (Kracek, 1928; Steiger and Asmussen, 2008). On the 17th, both the 1 m and continuous
surface measurements of temperature and humidity remained in the mirabilite stability zone
until half an hour after sunrise (6:40 am), which agrees with similar observed magnitudes of
the intensity TLS ratios for the 5:40 am and 6:40 am scans (Figure 14). On both days,
measurements of temperature and relative humidity at 2 cm and 5 cm below the continuous
crust remained inside the mirabilite stability zone. We therefore attribute crust dynamics at
these sites to the relative diurnal hydration and dehydration of key sulphate bearing evaporite
Importantly, the longer IR camera sequence from experiment 1 (M1) also follows a similar
phase- shifting behaviour within the mirabilite/thenardite phase diagram (Figure 15).
Maximum overnight relative humidity values were again within the mirabilite stability zone
on the sodium sulphate phase diagram when the ridge DNR dropped below the continuous
DNR. Further indicative evidence of moisture-flux was also apparent, as condensation was
observed on the ridge crests in the early morning true-colour pictures during these
exceedance periods (Figure 3d). Significantly, these observations agree with the Groeneveld
et al. (2010) postulation that increased overnight moisture measured on the surface of Owens
Lake was due to topographic control and atmospheric water condensing on the surface of
ridges. Similar observations of surface moisture condensation on ridges overnight have been
made by Sanchez-Moral et al. (2002). Together, our data provide the first direct evidence
linking atmospheric conditions, spatially and temporally explicit salt crust dynamics and
likelihood of sodium sulphate phase variability.
Feedbacks and implications of crust and moisture patterns
We have shown that the diurnal variation of moisture on a salt crust is linked to the crust
topography (Figure 10; Table 3). These observed patterns may be controlled by a number of
different micrometeorological, chemical, hydrological and physical processes and more data
is required to explore the controls on surface pattern development. It is likely that the distinct
pore-water-topography relationship may also enhance patterns in crust geochemistry at a
similar micro-scale, and this leads us to further question this relationship. For example i) does
the surface moisture patterning relate to changes in salt hydrology, or the condensation and
evaporation of free water; and ii) does the elastic and inelastic expansion of the crust relate to
salt phase changes and different capillary efficiency through variable pore spacing. Clearly,
(e.g. Groeneveld et al., 2010) and chemical analysis (e.g. spectroscopy, XRD and SEM; e.g.
Drake, 1995; Buck et al., 2011;) to explore these intricate but important crust-geochemistry
relationships. The crusts on Sua Pan are predominately fine grained and abiotic but in general
variable physical (e.g. salt grain size and shape; Rad and Shokri, 2014; Singer et al., 2003)
and microbiological (e.g. Acosta-Martinez et al., 2015; Rasuk et al., 2014; Viles, 2008) crust
constituents also likely modulate or enhance surface pattern change by changing moisture
absorption, crust elasticity, cohesion and porosity. Further, whilst our study highlights the
complex behaviour of sodium sulphate rich salt crusts, more studies need to be conducted on
geochemically diverse playas to determine the interplay of salts and clays in the construction
of crust patterns.
Our data also emphasise that the development of different surface patterns over time is likely
to be controlled by complex feedbacks between above and below-crust moisture transfers;
fluxes which ultimately have the potential to modify salt chemistry and thereby influence
topographic change rates and magnitudes . These environmental processes also exert
fundamental and significant change on surface roughness (Nield et al., 2013) and likely pore
connectivity (Nickling and Ecclestone, 1981) which can in turn alter atmospheric and
subsurface moisture transfer rates respectively; and ultimately surface erodibility
(Saint-Amand et al., 1986) and evaporation rates (Groeneveld et al., 2010).
Although the continuous surfaces that we monitored experienced some increase in moisture
and minimal surface expansion overnight (Figure 11), this was patchy and likely controlled
by heterogeneity within the geochemistry, pore spacing and topography (Eloukabi et al.,
2013). While the surface expansion was possibly a result of crystal growth either on or below
the crust and potentially interactions with hygroscopic clay minerals, the elastic behaviour of
suggests that an initial phase of topographic perturbation may be needed to help induce crust
expansion and thrusting. Surface perturbations could be internally driven, or the consequence
of external disturbances including animals, motor vehicles, dust devils or thunderstorms.
Ultimately the need for perturbation stimulus may account for the reduced rate of change
measured on these flat, continuous and relatively homogeneous surfaces (Figure 8c) as they
have a much reduced propensity to the range of possible feedbacks mentioned above. These
findings agree with observations of moisture driven crust patterns made at a larger-scale
(Nield et al., 2015) and elucidate the importance of surface and atmospheric moisture fluxes
in enhancing polygonal pressure ridge pattern development.
In terms of surface morphometric change, the observed thrusting of crust ridges agrees to
some extent with the conceptual efflorescence and polygon thermal thrust model proposed by
Krinsley (1970), particularly the assertion that maximum expansion occurs on the ridge
crests. However, unlike the Krinsley model, we observed maximum expansion of ridges
overnight, suggesting that differential salt efflorescence and surface hydration also play a role
in crust surface expansion and contraction. Importantly, we find that the rapid rates of
polygonal development (>30 mm/week) found by Nield et al. (2015) can occur in a single
night on isolated crust sections given ideal temperature and relative humidity conditions
(Figure 12a). This has significant implications for our understanding of changes in surface
roughness (i.e. magnitude, rate, range) and represents a phase change in our understanding of
the time-scales over which aerodynamic roughness and emission thresholds can change on
Conclusions
There is a complex relationship between patterns of surface topography and moisture
response on sodic playas. Here we show the first high resolution (TLS) measurements of
nocturnal complex surface change on a salt crust. Significantly, we identify temporal surface
feedbacks between moisture and crust morphology to aid in our understanding of playa dust
emissivity and evaporation variability.
Inelastic surface expansion is limited to ridged areas with higher topography, which also
exhibit a temporary increase in moisture overnight. Continuous areas are less responsive to
changes in atmospheric relative humidity, showing a reduced increase in non-spatially
coherent moisture overnight and a slight, elastic increase in topography. These high
resolution measurements of fast acting diurnal surface changes and the feedbacks both above
and below the surface on moisture, potential sulphate salt phase and crust roughness, provide
the first physical evidence of diurnal small-scale (mm) pattern changes on a dynamic, dust
emitting playa and the ability of these moisture-pattern interactions to facilitate the
development of polygonal ridges. Understanding how these ridges develop is important for
accurately characterising surface roughness and evaporation rates which will enable the
Acknowledgements
This study was part funded by NERC as part of the DO4models project (NE/H021841/1),
with travel support for Nield from a World University Network mobility grant and a
University of Southampton SIRDF grant. Data processing was undertaken using the IRIDIS
High Performance Computing Facility at the University of Southampton. K Vickery is
thanked for excellent field discussions and helpful manuscript comments, EJ Milton, RT
Wilson and G Roberts for valuable infra-red camera discussions and JA Gillies and WG
Nickling for insightful discussions about relationships between our results and those from
previous studies at Owens Lake. Anonymous reviewers and the ESPL editors are thanked for
extensive comments on earlier versions of this manuscript that helped modify its direction.
We thank the Botswana Ministry of Environment, Wildlife, and Tourism (permit EWT 8/36/4
References
Acosta-Martinez V, Van Pelt S, Moore-Kucera J, Baddock MC, Zobeck TM. 2015. Microbiology of wind-eroded sediments: Current knowledge and future research directions: Aeolian Research, 18: 99-113.
Archer DJ, Wadge G. 2001. Modeling the backscatter response due to salt crust development: IEEE Transactions on Geoscience and Remote Sensing, 39: 2307-2310.
Armesto-González J, Riveiro-Rodríguez B, González-Aguilera D, Rivas-Brea MT. 2010. Terrestrial laser scanning intensity data applied to damage detection for historical buildings: Journal of Archaeological Science, 37: 3037-3047.
Baddock MC, Bullard JE, Bryant RG. 2009. Dust source identification using MODIS: A comparison of techniques applied to the Lake Eyre Basin, Australia: Remote Sensing of Environment, 113: 1511-1528.
Benavente D, Brimblecombe P, Grossi CM. 2015. Thermodynamic calculations for the salt crystallisation damage in porous built heritage using PHREEQC: Environmental Earth Sciences, 74: 2297-2313.
Benavente D, del Cura MAG, Garcia-Guinea J, Sanchez-Moral S, Ordonez S. 2004. Role of pore structure in salt crystallisation in unsaturated porous stone: Journal of Crystal Growth, 260: 532-544.
Benavente D, Sanchez-Moral S, Fernandez-Cortes A, Canaveras JC, Elez J, Saiz-Jimenez C. 2011. Salt damage and microclimate in the Postumius Tomb, Roman Necropolis of Carmona, Spain: Environmental Earth Sciences, 63: 1529-1543.
Bonython CW. 1956. The salt of Lake Eyre - its occurrence in Madigan Gulf and its possible origin: Royal Society South Australia Transactions, 79: 66-92.
Briere PR. 2000. Playa, playa lake, sabkha: Proposed definitions for old terms: Journal of Arid Environments, 45: 1-7.
Bryant RG, Bigg GR, Mahowald NM, Eckardt FD, Ross SG. 2007. Dust emission response to climate in southern Africa: Journal of Geophysical Research-Atmospheres, 112: D09207.
Bryant RG, Rainey MP. 2002. Investigation of flood inundation on playas within the Zone of Chotts, using a time-series of AVHRR: Remote Sensing of Environment, 82: 360-375.
Bryant RG, Sellwood BW, Millington AC, Drake NA. 1994. Marine-Like Potash Evaporite Formation on A Continental Playa - Case-Study from Chott-El-Djerid, Southern Tunisia: Sedimentary Geology, 90: 269-291.
Bryant RG. 1999. Application of AVHRR to monitoring a climatically sensitive playa. case study: Chott El Djerid, Southern Tunisia: Earth Surface Processes and Landforms,
24: 283-302.
Progress in Physical Geography, 37: 397-421.
Buck BJ, King J, Etyemezian V. 2011. Effects of Salt Mineralogy on Dust Emissions, Salton Sea, California: Soil Science Society of America Journal, 75: 1971-1985.
Buckley SJ, Howell JA, Enge HD, Kurz TH. 2008. Terrestrial laser scanning in geology: data acquisition, processing and accuracy considerations: Journal of the Geological
Society, 165: 625-638.
Bullard JE, Harrison SP, Baddock MC, Drake N, Gill TE, McTainsh G, Sun Y. 2011. Preferential dust sources: A geomorphological classification designed for use in global dust-cycle models: Journal of Geophysical Research: Planets, 116: F04034.
Burrough SL, Thomas DSG, Singarayer JS. 2009. Late Quaternary hydrological dynamics in the Middle Kalahari: Forcing and feedbacks: Earth-Science Reviews, 96: 313-326.
Burton D, Dunlap DB, Wood LJ, Flaig PP. 2011. Lidar Intensity as a Remote Sensor of Rock Properties: Journal of Sedimentary Research, 81: 339-347.
Cahill TA, Gill TE, Reid JS, Gearhart EA, Gillette DA. 1996. Saltating particles, playa crusts and dust aerosols at Owens (dry) Lake, California: Earth Surface Processes and Landforms, 21: 621-639.
Clark RN, Swayze GA, Wise R, Livo E, Hoefen T, Kokaly R, Sutley SJ. 2007. USGR digital spectral library splib06a, U.S. Geological Survey.
Darke I, Davidson-Arnott R, Ollerhead J. 2009. Measurement of Beach Surface Moisture Using Surface Brightness: Journal of Coastal Research, 25: 248-256.
Darke I, Neuman CM. 2008. Field Study of Beach Water Content as a Guide to Wind Erosion Potential: Journal of Coastal Research, 24: 1200-1208.
Darmenova K, Sokolik IN, Shao Y, Marticorena B, Bergametti G. 2009. Development of a physically based dust emission module within the Weather Research and Forecasting (WRF) model: Assessment of dust emission parameterizations and input parameters for source regions in Central and East Asia: Journal of Geophysical Research: Atmospheres, 114: D14201.
Drake NA. 1995. Reflectance Spectra of Evaporite Minerals (400-2500-Nm) - Applications for Remote-Sensing: International Journal of Remote Sensing, 16: 2555-2571.
Eckardt FD, Bryant RG, McCulloch G, Spiro B, Wood WW. 2008. The hydrochemistry of a semi-arid pan basin case study: Sua Pan, Makgadikgadi, Botswana: Applied
Geochemistry, 23: 1563-1580.
Edwards BL, Namikas SL, D'Sa EJ. 2013. Simple infrared techniques for measuring beach surface moisture: Earth Surface Processes and Landforms, 38: 192-197.
Eugster HP, Jones BF. 1979. Behavior of major solutes during closed-basin brine evolution: American Journal of Science, 279: 609-631.
Eugster HP, Smith GI. 1965. Mineral equilibria in the Searles Lake evaporites, California: Journal of Petrology, 6: 473-522.
Genkinger S, Putnis A. 2007. Crystallisation of sodium sulfate: supersaturation and metastable phases: Environmental Geology, 52: 295-303.
Gillette DA, Niemeyer TC, Helm PJ. 2001. Supply-limited horizontal sand drift at an ephemerally crusted, unvegetated saline playa: Journal of Geophysical Research-Atmospheres, 106: 18085-18098.
Goda Y. 2000. Random seas and design of maritime structures: World Scientific.
Gran M, Carrera Js, Massana J, Saaltink MW, Olivella S, Ayora C, Lloret A. 2011. Dynamics of water vapor flux and water separation processes during evaporation from a salty dry soil: Journal of Hydrology, 396: 215-220.
Groeneveld DP, Huntington JL, Barz DD. 2010. Floating brine crusts, reduction of
evaporation and possible replacement of fresh water to control dust from Owens Lake bed, California: Journal of Hydrology, 392: 211-218.
Grossi CM, Brimblecombe P, Menendez B, Benavente D, Harris I, Deque M. 2011.
Climatology of salt transitions and implications for stone weathering: Science of the Total Environment, 409: 2577-2585.
Haustein K, Washington R, King J, Wiggs G, Thomas DSG, Eckardt FD, Bryant RG, Menut L. 2015. Testing the performance of state-of-the-art dust emission schemes using DO4Models field data: Geosci.Model Dev., 8: 341-362.
Hodge R, Brasington J, Richards K. 2009. In situ characterization of grain-scale fluvial morphology using Terrestrial Laser Scanning: Earth Surface Processes and Landforms, 34: 954-968.
Hofle B, Pfeifer N. 2007. Correction of laser scanning intensity data: Data and model-driven approaches: ISPRS Journal of Photogrammetry and Remote Sensing, 62: 415-433.
Jentzsch PV, Ciobota V, Rosch P, Popp J. 2013. Reactions of Alkaline Minerals in the Atmosphere: Angewandte Chemie International Edition, 52: 1410-1413.
Kaasalainen S, Kukko A, Lindroos T, Litkey P, Kaartinen H, Hyyppa J, Ahokas E. 2008. Brightness Measurements and Calibration With Airborne and Terrestrial Laser Scanners: Geoscience and Remote Sensing, IEEE Transactions on, 46: 528-534.
Kampf SK, Tyler SW, Ortiz CA, Mu+¦oz JF, Adkins PL. 2005. Evaporation and land surface energy budget at the Salar de Atacama, Northern Chile: Journal of Hydrology, 310: 236-252.
King J, Etyemezian V, Sweeney M, Buck BJ, Nikolich G. 2011. Dust emission variability at the Salton Sea, California, USA: Aeolian Research, 3: 67-79.
Kinsman DJJ. 1976. Evaporites; relative humidity control of primary mineral facies: Journal of Sedimentary Research, 46: 273-279.
Kracek FC. 1928. International Critical Tables 3.
Krinsley DB. 1970. A Geomorphological and Paleoclimatological Study of the Playas of Iran. Part 1., Washington D.C., Geological Survey Reston VA, 356.
Lancaster N. 2004. Relations between aerodynamic and surface roughness in a hyper-arid cold desert: Mcmurdo dry valleys, Antarctica: Earth Surface Processes and Landforms, 29: 853-867.
Legates DR, Mahmood R, Levia DF, DeLiberty TL, Quiring SM, Houser C, Nelson FE. 2011. Soil moisture: A central and unifying theme in physical geography: Progress in Physical Geography, 35: 65-86.
Lichti D. 2005. Spectral Filtering and Classification of Terrestrial Laser Scanner Point Clouds: The Photogrammetric Record, 20: 218-240.
Lorenz RD. 2011. Observations of wind ripple migration on an Egyptian seif dune using an inexpensive digital timelapse camera: Aeolian Research, 3: 229-234.
Lorenz RD, Valdez A. 2011. Variable wind ripple migration at Great Sand Dunes National Park and Preserve, observed by timelapse imaging: Geomorphology, 133: 1-10.
Lowenstein TK, Hardie LA. 1985. Criteria for the recognition of salt-pan evaporites: Sedimentology, 32: 627-644.
MacKinnon DJ, Clow GD, Tigges RK, Reynolds RL, Chavez PS. 2004. Comparison of aerodynamically and model-derived roughness lengths (z(o)) over diverse surfaces, central Mojave Desert, California, USA: Geomorphology, 63: 103-113.
Mahowald NM, Bryant RG, del Corral J, Steinberger L. 2003. Ephemeral lakes and desert dust sources: Geophysical Research Letters, 30.
Marticorena B, Bergametti G. 1995. Modeling the atmospheric dust cycle: 1. Design of a soil-derived dust emission scheme: Journal of Geophysical Research: Planets, 100: 16415-16430.
McKenna Neuman C, Langston G. 2006. Measurement of water content as a control of particle entrainment by wind: Earth Surface Processes and Landforms, 31: 303-317.
Mees F, Castaneda C, Herrero J, Van Ranst E. 2011. Bloedite sedimentation in a seasonally dry saline lake (Salada Mediana, Spain): Sedimentary Geology, 238: 106-115.
Nickling WG, Ecclestone M. 1981. The effects of soluble salts on the threshold shear velocity of fine sand: Sedimentology, 28: 505-510.
wind: Sedimentology, 31: 111-117.
Nield JM, Bryant RG, Wiggs GFS, King J, Thomas DSG, Eckardt FD, Washington R. 2015. The dynamism of salt crust patterns on playas: Geology, 43: 31-34.
Nield JM, Wiggs GFS. 2011. The application of terrestrial laser scanning to aeolian saltation cloud measurement and its response to changing surface moisture: Earth Surface Processes and Landforms, 36: 273-278.
Nield JM, Wiggs GFS, Squirrell RS. 2011. Aeolian sand strip mobility and protodune development on a drying beach: examining surface moisture and surface roughness patterns measured by terrestrial laser scanning: Earth Surface Processes and Landforms, 36: 513-522.
Nield JM, Chiverrell RC, Darby SE, Leyland J, Vircavs LH, Jacobs B. 2013a. Complex spatial feedbacks of tephra redistribution, ice melt and surface roughness modulate ablation on tephra covered glaciers: Earth Surface Processes and Landforms, 38: 94-102.
Nield JM, King J, Jacobs B. 2014. Detecting surface moisture in aeolian environments using terrestrial laser scanning: Aeolian Research, 12: 9-17.
Nield JM, King J, Wiggs GFS, Leyland J, Bryant RG, Chiverrell RC, Darby SE, Eckardt FD, Thomas DSG, Vircavs LH, Washington R. 2013b. Estimating aerodynamic roughness over complex surface terrain: Journal of Geophysical Research: Atmospheres, 118: 2013JD020632.
Pakzad HR, Kulke H. 2007. Geomorphological features in the Gavkhoni playa lake, SE Esfahan, Iran: Carbonates and Evaporites, 22: 1-5.
Parkhurst DL, Appelo CAJ. 1999. User's guide to PHREEQC (Version 2): A computer program for speciation, batch-reaction, one-dimensional transport, and inverse geochemical calculations: U.S.Geological Survey Water Resources Investigations Report, 99: 310.
Peck AJ. 1960. The water table as affected by atmospheric pressure: Journal of Geophysical Research, 65: 2383-2388.
Pelletier JD. 2006. Sensitivity of playa windblown-dust emissions to climatic and anthropogenic change: Journal of Arid Environments, 66: 62-75.
Prospero JM, Ginoux P, Torres O, Nicholson SE, Gill TE. 2002. Environmental
characterization of global sources of atmospheric soil dust identified with the Nimbus 7 Total Ozone Mapping Spectrometer (TOMS) absorbing aerosol product: Reviews of Geophysics, 40: 2-1-2-31.
Rad MN, Shokri N. 2014. Effects of grain angularity on NaCl precipitation in porous media during evaporation: Water Resources Research, 50: 9020-9030.
Rasuk MC, Kurth D, Flores MR, Contreras M, Novoa F, Poire D, Farias ME. 2014.
Reeves CC. 1969. Lacustrine Structures: Depositional and Erosional, Introduction to Paleolimnology: Netherlands, Elsevier Science and Technology, -288.
Reynolds RL, Yount JC, Reheis M, Goldstein H, Chavez P, Fulton R, Whitney J, Fuller C, Forester RM. 2007. Dust emission from wet and dry playas in the Mojave desert, USA: Earth Surface Processes and Landforms, 32: 1811-1827.
Rodriguez-Navarro C, Doehne E, Sebastian E. 2000. How does sodium sulfate crystallize? Implications for the decay and testing of building materials: Cement and Concrete Research, 30: 1527-1534.
Rosen MR. 1994. The importance of groundwater in playas: a review of playa classifications and the sedimentology and hydrology of playas, in Rosen, M.R., ed., Paleoclimate and Basin Evolution of Playa Systems, Geological Society of America Special Paper 289: Boulder, CO, Geological Society of America, 1-18.
Saint-Amand P, Gaines C, Saint-Amand D. 1987. Owens Lake: an ionic soap opera staged on a natric playa, Geological Society of America Centennial Field Guide - Cordilleran Section: Boulder, CO, Geological Society of America, 145-150.
Saint-Amand P, Mathews LA, Gaines C, Reinking R. 1986. Dust storms from Owens and Mono Valleys, California, China Lake, CA, Naval Weapons Center Technical Publication Series 6731.
Sanchez-Moral S, Ordonez S, Benavente D, Garcia del Cura MA. 2002. The water balance equations in saline playa lakes: comparison between experimental and recent data from Quero Playa Lake (central Spain): Sedimentary Geology, 148: 221-234.
Singer A, Zobeck T, Poberezsky L, Argaman E. 2003. The PM10 and PM2.5 dust generation potential of soils/sediments in the Southern Aral Sea Basin, Uzbekistan: Journal of Arid Environments, 54: 705-728.
Steiger M, Asmussen S. 2008. Crystallization of sodium sulfate phases in porous materials: The phase diagram Na2SO4-H2O and the generation of stress: Geochimica et Cosmochimica Acta, 72: 4291-4306.
Stoertz GE, Ericksen GE. 1974. Geology of Salars in Northern Chile: U.S.Geological Survey Professional Paper, 811.
Sturman AP, McGowan HA. 2009. Observations of dry season surface energy exchanges over a desert clay pan, Queensland, Australia: Journal of Arid Environments, 73: 74-81.
Thorburn PJ, Walker GR, Woods PH. 1992. Comparison of Diffuse Discharge from Shallow-Water Tables in Soils and Salt Flats: Journal of Hydrology, 136: 253-274.
Tollerud HJ, Fantle MS. 2014. The temporal variability of centimeter-scale surface roughness in a playa dust source: Synthetic aperture radar investigation of playa surface
dynamics: Remote Sensing of Environment, 154: 285-297.
Turk LJ. 1975. Diurnal fluctuations of water tables induced by atmospheric pressure changes: Journal of Hydrology, 26: 1-16.
Tyler SW, Kranz S, Parlange MB, Albertson J, Katul GG, Cochran GF, Lyles BA, Holder G. 1997. Estimation of groundwater evaporation and salt flux from Owens lake,
California, USA: Journal of Hydrology, 200: 110-135.
Tyler SW, Munoz JF, Wood WW. 2006. The response of playa and sabkha hydraulics and mineralogy to climate forcing: Ground Water, 44: 329-338.
Vickery, K.J., 2014, A case study on dust supply from the Makgadikgadi Pans, Botswana [Doctor of Philosophy : University of Cape Town.
Vickery KJ, Eckardt FD, Bryant RG. 2013. A sub-basin scale dust plume source frequency inventory for southern Africa, 20052008: Geophysical Research Letters, 40: 5274-5279.
Viles HA. 2008. Understanding Dryland Landscape Dynamics: Do Biological Crusts Hold the Key?: Geography Compass, 2: 899-919.
Wadge G, Archer DJ. 2002. Remote measurement of the evaporation of groundwater from arid playas: Proceedings of the Third International Symposium on Retrieval of Bio- and Geophysical Parameters from Sar Data for Land Applications, 475: 165-169.
Wadge G, Archer DJ. 2003. Evaporation of groundwater from arid playas measured by C-band SAR: Geoscience and Remote Sensing, IEEE Transactions on, 41: 1641-1650.
Washington R, Todd M, Middleton NJ, Goudie AS. 2003. Dust-storm source areas determined by the total ozone monitoring spectrometer and surface observations: Annals of the Association of American Geographers, 93: 297-313.
Washington R, Todd MC, Lizcano G, Tegen I, Flamant C, Koren I, Ginoux P, Engelstaedter S, Bristow CS, Zender CS, Goudie AS, Warren A, Prospero JM. 2006. Links between topography, wind, deflation, lakes and dust: The case of the Bodele Depression, Chad: Geophysical Research Letters, 33.
Webb NP, Strong CL. 2011. Soil erodibility dynamics and its representation for wind erosion and dust emission models: Aeolian Research, 3: 165-179.
Zehnder K, Schoch O. 2009. Efflorescence of mirabilite, epsomite and gypsum traced by automated monitoring on-site: Journal of Cultural Heritage, 10: 319-330.
Table 1 Site locations, descriptions and sample times. Crust Type Site Nam e Location Samp le archi ve name Sample Start Date TLS Sample Times Sunset on start date Sunrise on followi ng day
Bulk salt content (%) Ridge Dimensions (m) Temperature at 1 m
above surface (o)
Relative Humidity at 1 m above surface
(%)
Wind Speed at 1.68 m above surface (m/s)
Latitu de (oS)
Longitu de (oE)
Elevati on (m) Crust surfac e Sediment immediat ely below crust Subsur face sedim ent Mean Height Maxi mum Height Height Standard Deviation Mean Width Mean Wave length
Mean Mini
mum Maxi
mum Mean
Mini mum
Maxi
mum Mean
Mini mum
Maxi mum
Ridged
R1 20.60
32 25.9301 910.79 D10
8/18/201 1 15:30, 19:50, 00:05, 4:20, 9:00
18:03 6:35 - - - 0.018 0.067 0.011 0.200 0.316 15.07 5.57 26.96 46.81 17.19 70.87 2.40 0.29 8.27
R2 20.60
32 25.9301 910.79 D10
9/19/201 2 16:00, 18:10, 22:00, 2:00, 9:50
18:11 6:07 - - - 0.012 0.089 0.010 0.131 0.214 23.01 9.34 36.81 34.29 14.46 58.32 2.13 0.16 7.53
R3 20.60
32 25.9301 910.79 D10 8/5/2012 - 17:59 6:43 60.1 45.5 32.3 0.012 0.080 0.010 0.135 0.218 17.39 7.76 29.65 36.53 17.93 58.90 2.88 0.03 8.25
R4 20.55
85 26.0071 909.76 L5
9/17/201 2
5:40, 6:40, 7:40
18:11 6:09 - - - 0.018 0.070 0.010 0.161 0.292 19.30 9.72 29.30 49.82 19.23 84.80 2.93 0.03 9.65
R5 20.55
85 26.0071 909.76 L5
9/18/201 2
5:30, 6:40, 7:50
18:11 6:08 - - - 0.018 0.070 0.010 0.161 0.292 20.73 9.34 34.95 40.95 16.19 78.97 2.23 0.28 6.49
Continuous
C1 20.61
26 25.9876 909.95 J11
8/22/201 1 13:15, 19:00, 23:15, 3:30, 7:45
18:04 6:32 - - - 0.004 0.021 0.003 0.080 0.128 19.16 10.77 32.75 30.10 11.23 53.23 3.85 0.78 10.2
6
C2 20.55
85 26.0071 909.76 L5 8/3/2012 16:00, 19:40, 3:30,
7:30
17:59 6:44 76.9 56.4 25.4 0.008 0.043 0.005 0.176 0.270 16.46 6.81 27.68 48.27 24.12 74.49 2.03 0.13 5.06
Mixed
M1 20.57
60 25.9111 911.09 B7 8/2/2012 - 17:58 6:45 57.7 33.8 38.8 0.006 0.085 0.007 0.127 0.172 16.95 6.81 30.12 42.50 17.40 74.49 2.10 0.11 5.06
M2 20.54
93 25.9785 910.05 I4
04/08/20
12 - 17:59 6:44 69.6 40.1 17.5 0.018 0.072 0.010 0.167 0.283 16.97 8.01 29.04 42.28 21.96 60.71 1.85 0.03 4.18
Table 2 (a) Typical geochemistry of groundwater samples taken from the study site. Sample Code Location Water Table Depth
Cl Br SO4 K Na Mg Ca Alkalinity pH Temperature
Conductivity (20C)
Latitude (oS)
Longitude
(oE) cm mg/l mg/l mg/l mg/l mg/l mg/l mg/l mg/l C microS/cm
FR11-L5 20.5585 26.0071 52 94822.8 142.6 8659.2 3184.8 86512.3 3.4 16.4 39010.0 9.3 20.5 274738.0
FR11-I8 20.5936 25.978 74 120726.5 203.3 12812.5 3987.9 113005.0 2.8 13.5 51110.0 9.5 22.0 408267.0
FR11-G6 20.5754 25.959 121 116820.0 186.1 12575.5 4180.5 108220.7 3.5 10.8 48670.0 9.8 23.0 393631.0
Table 2 (b) Mineral saturation data for sample FR11-G6 with changes in temperature derived using PHREEQ.
Phase Equation 0 5 10 15 20 25 30 35 40 45 50 Temperature C
Calcite CaCO3 2.56 2.62 2.67 2.72 2.78 2.83 2.88 2.93 2.98 3.02 3.07
Dolomite CaMg(CO3)2 4.22 4.33 4.43 4.53 4.62 4.71 4.8 4.88 4.96 5.03 5.1
Gaylussite CaNa2(CO3)2:5H2O 2.6 2.64 2.68 2.72 2.76 2.8 2.83 2.86 2.89 2.92 2.94
Halite NaCl -0.17 -0.16 -0.16 -0.16 -0.16 -0.16 -0.16 -0.17 -0.17 -0.18 -0.18
Huntite CaMg3(CO3)4 3.95 4.23 4.51 4.79 5.07 5.36 5.64 5.93 6.22 6.52 6.81
Magnesite MgCO3 1.17 1.17 1.16 1.16 1.15 1.14 1.13 1.12 1.11 1.09 1.08
Mirabilite Na2SO4:10H2O 0.16 -0.08 -0.31 -0.53 -0.74 -0.93 -1.12 -1.3 -1.46 -1.62 -1.76
Nahcolite NaHCO3 -0.15 -0.07 -0.01 0.05 0.09 0.14 0.17 0.2 0.22 0.24 0.25
Natron Na2CO3:10H2O -0.89 -0.85 -0.81 -0.77 -0.74 -0.7 -0.67 -0.64 -0.61 -0.59 -0.56
[image:35.595.52.770.82.527.2] [image:35.595.65.776.314.521.2]