CATALYTIC CONVERSION OF NITROGEN TO AMMONIA BY AN IRON MODEL COMPLEX
Thesis by John S. Anderson
In Partial Fulfillment of the Requirements for the Degree of Doctor of Philosophy
California Institute of Technology Pasadena, CA
2014
Acknowledgements
Throughout the course of my doctoral studies, I have been blessed to be
surrounded by some of the most intelligent, helpful, and enjoyable people in the world. Any success that I may have had during my Ph.D. reflects more on the capabilities of the people around me than on any trait of my own. A large number of people have
contributed to this work either directly in the form of co-workers and collaborators, or indirectly in the form of people who did not work on the science herein, but without whom this work would not have been possible. I will do my best to thank all of them.
Firstly, I have to thank Professor Jonas Peters. As many will tell you, Jonas is a fantastic advisor and I could not have asked for a better mentor for the past five years. Jonas is far more intelligent than he gives himself credit for and has a unique gift in the design and implementation of research projects. His approach to scientific problems and his thought process in designing experiments is something I hope I will take with me as I leave my doctoral studies. I also have to thank him for the patience he has shown in developing me as a scientist. I am far from a finished product, but any progress that I have made is largely a result of his efforts. Aside from his scientific prowess, Jonas has been a thoroughly helpful and thoughtful person to work with and, in general, an
exceptional human being. Any professor can attest that time comes as a premium, but Jonas has consistently managed this research lab in a remarkable manner and has been a pleasure to work with. Although it is difficult to be friends with your advisor during the course of one’s Ph.D., I have enjoyed my time working for him immensely and look
During the move from M.I.T. to CalTech, I spent a brief “sabbatical” in the laboratories of Professor Greg Fu. Although the joint project I was working on during that time was an unmitigated disaster, I enjoyed the members of the Fu lab that I met during that time, some of whom I still talk to today. I also have to thank Greg for letting me work in his lab, and for our interactions during that time and since. The Fu lab has since moved to CalTech as well and having them across the hall has been great.
Four graduate students started in the same year as I did, and then there was one. I find it unlikely that I was the only person during my year that graduated with a Ph.D. from the Peters lab, considering the exceptionally talented group of students that I came in with. I would like to thank Laura Gerber, Kenny Lotito, and Alicia Chang for the social and scientific interactions that we had during our time together. I hope our paths will cross again in the future.
Outside of my classmates, the Peters lab has been filled with a an outstanding group of people. I shared a glovebox with Caroline Saouma during my early time in the lab and I have to thank her for getting me started in the laboratory. Although the time that we spent together was relatively short, Professor Neal Mankad is an impressive scientist and continues to host our yearly fantasy football league. Professor Yunho Lee brought an incredibly cheerful demeanor to the lab every day and I thank him for it. I would also like to thank Professor Nate Szymczak for getting me started on
lab to talk to. Charlene Tsay was also a glovebox partner for some time and I have to thank her for putting up with my mess frequently.
Daniel Suess has been a brilliant, eccentric, and hysterical co-worker throughout my Ph.D. I have learned a great deal about chemistry through my discussions with Dan and I have to thank him for all of the help he has given me over the past five years. Similarly, Professor Hill Harman has brought a unique, and sometimes belligerent, outlook on chemical problems. In many ways his insights have made me re-evaluate the way I think about molecules. Dr. Ayumi Takaoka was a good friend before he fled this country for Japan. Early on in my Ph.D. Ayumi frequently referred to me as being “too much of a cowboy.” Although I didn’t realize it at the time, I had a lot to learn from
Ayumi about scientific rigor. Fortunately, he had a lot to learn from me about fantasy football, and the lessons are ongoing. I frequently enjoyed talking to Professor Chris Uyeda, and his knowledge of synthesis has been a great resource during my doctoral studies.
and life in general. Dr. David Lacy has been a great person to talk to and I specifically have to thank him for our discussions on oxo species.
Henry Fong is likely the nicest person in the lab, and we have spent time together both in outreach (which was often laborious) as well as on the basketball court. I always look forward to seeing Henry, and I suspect that I may see more of him in the future in Chicago. Sid Creutz has had to sit in the same cubicle with me for a number of years. While Sid has never complained, he rarely speaks at all, so I can only assume that he doesn’t mind. Sid has, however, been a great and very intelligent co-worker who
continues to do excellent work in the lab.
During the last portion of my Ph.D., I had the privilege of monopolizing a glovebox with Jon Rittle, hereafter referred to as JR. JR is an incredibly gifted chemist and has a nearly unmatched intensity with which he attacks scientific problems. While this intensity can often lead to bad moods and arguments, JR is usually right and possesses a keen mind for chemistry. Additionally, JR has been my, potentially
A number of collaborators have helped me on projects and publications during my Ph.D. I would like to specifically thank Limei Zhang, Jens Kaiser, George Cutsail, and Ruchira Chatterjee for their help in answering my sometimes incessant questions and fortheir assistance in collecting and interpreting data. MIT and CalTech have excellent staff members and I would like to thank David VanderVelde, Larry Henling, Mike Takase, Peter Muller, Bruce Brunschwig, Jay Winkler, Jeff Simpson, and Angelo DiBilio for their help in discussing and fixing scientific or chemical problems.
Outside of the Peters lab members, I have been fortunate to be surrounded by an exceptional group of people at both MIT and CalTech. Although too numerous to name individually, I have had the pleasure of interacting with a number of students from the Schrock, Fu, Cummins, Nocera, Grubbs, Agapie, Drennan, Lippard, Rees, Gray and Bercaw labs and I anticipate crossing paths with many of them in the future. I also participated in various recreational sports including volleyball, softball, and basketball during the past few years. My participation in IM basketball leagues at CalTech in particular may mark the most pitiful streak of futility in an athletic endeavor, as the collective wins for teams that I have been a part of likely number less than seven over the course of three years. Nevertheless, the people that I have been able to play with have enriched my time both on the court and off it.
work and offering criticism. I believe that I am a better scientist because of my interactions with them.
I would also like to thank my undergraduate advisor Professor Greg Hillhouse for taking me under his wing as a naïve undergraduate and starting me along this path. I would certainly never have made it this far without his efforts and the time that he devoted towards my education. I learned a great deal from my time working in his lab that I continue to use to this day.
I have been funded by a NSF graduate research fellowship, a Presidential Scholarship from MIT, and through the NIH. These funding agencies have made this research possible and I would like to thank them for funding the fundamental science that has gone into this dissertation.
Outside of the world of chemistry I have had an exceptional group of friends and family that have supported me for the past five years. I must certainly thank my parents Rick and Karin Anderson for raising me and giving me the opportunity to pursue this career path. My parents, along with my brother Keith, have also been a fountain of unconditional love and support throughout my life and there is no possible way to thank them enough. My Ph.D. studies have kept me from seeing the rest of my family and friends as much as I would like and I hope that living in Chicago for the next few years will allow me to spend more time with them. I also would like to thank Don and Laura Holm for visiting frequently and supporting both Emily and myself; I could not ask for better in-laws.
Abstract
Threefold symmetric Fe phosphine complexes have been used to model the structural and functional aspects of biological N2 fixation by nitrogenases. Low-valent
bridging Fe-S-Fe complexes in the formal oxidation states Fe(II)Fe(II), Fe(II)/Fe(I), and Fe(I)/Fe(I) have been synthesized which display rich spectroscopic and magnetic
behavior. A series of cationic tris-phosphine borane (TPB) ligated Fe complexes have been synthesized and been shown to bind a variety of nitrogenous ligands including N2H4, NH3, and NH2-. These complexes are all high spin S = 3/2 and display EPR and
magnetic characteristics typical of this spin state. Furthermore, a sequential protonation and reduction sequence of a terminal amide results in loss of NH3 and uptake of N2.
These stoichiometric transformations represent the final steps in potential N2 fixation
schemes.
Treatment of an anionic FeN2 complex with excess acid also results in the
formation of some NH3, suggesting the possibility of a catalytic cycle for the conversion
of N2 to NH3 mediated by Fe. Indeed, use of excess acid and reductant results in the
formation of seven equivalents of NH3 per Fe center, demonstrating Fe mediated catalytic
N2 fixation with acids and protons for the first time. Numerous control experiments
indicate that this catalysis is likely being mediated by a molecular species.
A number of other phosphine ligated Fe complexes have also been tested for catalysis and suggest that a hemi-labile Fe-B interaction may be critical for catalysis. Additionally, various conditions for the catalysis have been investigated. These studies further support the assignment of a molecular species and delineate some of the
Finally, combined spectroscopic studies have been performed on a putative intermediate for catalysis. These studies converge on an assignment of this new species as a hydrazido(2-) complex. Such species have been known on group 6 metals for some time, but this represents the first characterization of this ligand on Fe. Further
spectroscopic studies suggest that this species is present in catalytic mixtures, which suggests that the first steps of a distal mechanism for N2 fixation are feasible in this
Table of Contents
Acknowledgements ... iii
Abstract ...x
Table of Contents ... xii
List of Figures ... xvi
List of Tables ...xx
List of Abbreviations ...xxv
Chapter 1: Introduction ...1
1.1 Opening Remarks... 2
1.2 Nitrogen Fixation ... 2
1.3 Unusually Low Valent Fe-S-Fe Complexes ... 8
1.4 Conversion of FeNH2 to FeN2 with Release of NH3 ... 9
1.5 Catalytic Conversion of N2 to NH3 by an Fe Model Complex ... 11
1.6 The Effect of Ligand and Reaction Conditions on Fe Mediated N2 Fixation ... 13
1.7 Spectroscopic Characterization of the Putative Catalytic Intermediate [(TPB)Fe≡N-NH2][BArF4]. ... 14
References Cited ... 16
Chapter 2: Unusually Low Valent Fe-S-Fe Complexes ...19
2.1 Introduction ... 20
2.2 Results and Discussion ... 21
2.2.1 Low-Valent Fe-S-Fe Complexes ... 21
2.2.2 Reactivity with Small Molecules ... 32
2.3 Conclusion ... 35
2.4 Experimental Section ... 36
2.4.1 General Considerations ... 36
2.4.2 Electrochemical Measurements ... 37
2.4.3 EPR Measurements ... 37
2.4.4 Magnetic Measurements ... 38
2.4.5 X-Ray Crystallography ... 39
2.4.6 Synthesis ... 40
References Cited ... 44
Chapter 3: Conversion of FeNH2 to FeN2 with Release of NH3 ...47
3.1 Introduction ... 48
3.2 Results and Discussion ... 49
3.2.1 Formation of a Cationic Fe(I) Synthon. ... 49
3.2.2 [(TPB)Fe]+ Adducts of N 2H4 and NH3 ... 53
3.2.3 Conversion of FeNH2 to FeN2 with release of NH3 ... 57
3.3 Conclusion ... 61
3.4 Experimental Section ... 62
3.4.1 General Considerations ... 62
3.4.2 EPR Spectroscopy ... 63
3.4.3 X-Ray Crystallography ... 63
3.4.4 Magnetic Measurements ... 64
3.4.5 Computational Methods ... 65
3.4.6 Synthesis ... 65
References Cited ... 70
Chapter 4: Catalytic Conversion of N2 to NH3 by an Fe Model Complex ...74
4.1 Introduction ... 75
4.2 Results and Discussion ... 76
4.2.1 Initial Protonation Studies ... 76
4.2.2 Catalytic N2 Reduction to NH3 ... 80
4.2.3 Catalyst Speciation... 85
4.3 Conclusion ... 87
4.4 Experimental Section ... 88
4.4.1 General Considerations ... 88
4.4.3 Standard Catalytic Protocol ... 89
4.4.4 Ammonia Quantification ... 90
4.4.5 Synthesis of (TPB)FeCl ... 90
4.4.7 Other Reaction Protocols ... 94
References Cited ... 101
Chapter 5: The Effect of Ligand and Reaction Conditions on Fe Mediated N2 Fixation ...104
5.2 Results and Discussion ... 106
5.2.1 Ligand and Complex Synthesis ... 106
5.2.2 Structural Characterization ... 109
5.2.3 Comparison of Pre-Catalysts ... 112
5.2.4 Comparison of Catalytic Conditions ... 115
5.3 Conclusions ... 119
5.4 Experimental Section ... 120
5.4.1 General Considerations ... 120
5.4.3 Synthesis ... 122
5.4.3 Catalytic Protocols ... 127
References Cited ... 133
Chapter 6: Spectroscopic Characterization of the Putative Catalytic Intermediate [(TPB)Fe≡N-NH2][BArF4] ...136
6.1 Introduction ... 137
6.2 Results and Discussion ... 138
6.2.1 EPR Studies ... 138
6.2.2 ENDOR Studies ... 142
6.2.3 Fe K-Edge X-ray Absorption Spectroscopy Measurements ... 145
6.2.4 Computational Studies ... 147
6.2.5 Decomposition Studies ... 150
6.3 Conclusions ... 151
6.4 Experimental Section ... 153
6.4.1 General Considerations ... 153
6.4.2 EPR Spectroscopy ... 154
6.4.3 ENDOR Spectroscopy ... 154
6.4.4 XAS Measurements ... 155
6.4.6 Synthesis ... 156
References Cited ... 161
Appendix 1: Supplementary Data for Chapter 2 ...166
Appendix 2: Supplementary Data for Chapter 3 ...175
Appendix 3: Supplementary Data for Chapter 4 ...194
Appendix 4: Supplementary Data for Chapter 5 ...206
List of Figures
Chapter 1: Introduction ...1 Figure 1.1. X-Ray Diffraction (XRD) structure and chemical line drawing representation of FeMoco. ... 3 Figure 1.2. Mo complexes that mediate the catalytic reduction of N2 to NH3 ... 4
Figure 1.3. Qualitative d-orbital splitting diagrams and examples of complexes that feature pseudo-tetrahedral and trigonal bipyramidal geometries stabilizing bases and π-acids respectively. Note that Fe-Si or Fe-B bonding orbitals may be near or within the d-manifold, but are not shown for reasons of clarity. ... 9 Figure 1.4. Generation of a di-protonated intermediate which partially decomposes to an NH3 complex. ... 14
Chapter 2: Unusually Low Valent Fe-S-Fe Complexes ...19 Figure 2.1. CV of 2.1. ... 21 Figure 2.2. XRD structures of complexes 2.1 (A), 2.2 (B), and 2.3 (C) with ellipsoids at 50% and hydrogens omitted for clarity ... 23 Figure 2.3. Variable temperature magnetic susceptibility measurements on complexes 2.1-2.3. ... 25 Figure 2.4. (A) Near-IR spectrum of complex 2.2. (B) 4 K X-band EPR spectrum of 2.2. ... 27 Figure 2.5. 80 K Mössbauer spectra of solid samples of complexes 2.1-2.3... 29 Figure 2.6. Qualitative d-orbital splitting diagrams illustrating the coupling in 2.1-2.3. . 30 Figure 2.7. XRD structures of the cores of complexes 2.4 and 2.5 with ellipsoids at 50%. ... 33 Figure 2.8. (A) CV of 2.5 at 10 mV/s. (B) CV’s of 2.5 at differing scan rates. (C) CV of 2.5 at 10 mV/s with the listed concentrations of p-toluenesulfonic acid. ... 34
Figure 3.1. XRD structures of complexes 3.1 and 3.2 with ellipsoids at 50%. Most
hydrogens and counterions have been omitted for clarity ... 50
Figure 3.2. DFT optimized geometries at the B3LYP/6-31G(d) level of theory for (A) 3.2 and (B) [(Me2PhP)3Fe]+ ... 51
Figure 3.3. XRD structures of complexes 3.3 and 3.4 with C-H hydrogens and counterions omitted for clarity. ... 54
Figure 3.4. Reaction kinetics of the thermolysis of 3.3 to 3.4 at 60 °C in a 6:1 mixture of C6D6:THF-d8. ... 55
Figure 3.5. XRD structures of complexes 3.5 and 3.6 with C-H hydrogens omitted for clarity. ... 58
Figure 3.6. Low-temperature X-Band EPR spectra for complexes 3.1-3.6. ... 59
Chapter 4: Catalytic Conversion of N2 to NH3 by an Fe Model Complex ...74
Figure 4.1. UV-Visible spectrum of the indophenol dye generated from NH3 ... 81
Figure 4.2. 1H NMR spectra of [14NH4][Cl] and [15NH4][Cl] in DMSO-d6 obtained from correspondingly labeled N2 gas via catalytic reduction with complex 4.1 using the standard catalytic protocol described in the text. ... 83
Chapter 5: The Effect of Ligand and Reaction Conditions on Fe Mediated N2 Fixation ...104
Figure 5.1. Complexes synthesized and studied towards N2 reduction. ... 106
Figure 5.2. XRD structures of complexes 5.1, 5.3, 5.9, 5.10, and 5.11 with ellipsoids at 50% and hydrogens and counterions omitted for clarity. ... 110
Chapter 6: Spectroscopic Characterization of the Putative Catalytic Intermediate [(TPB)Fe≡N-NH2][BArF4] ...136
Figure 6.1. X-Band EPR spectra of: (A) Complex 4.1 and (B) (TPB)FeN2SiMe3 ... 139
Figure 6.3. X-Band EPR spectra of (A) 6.1, (B) [(TPB)Fe≡N(C6H4OMe)]+, and (C)
[(TPB)Fe≡NAd][BArF
4] ... 141
Figure 6.4. (A) Proton CW-ENDOR at 12.4 kG and 35.24 GHz of 4.1 (black) and 6.1 (red). (B) 35.01 GHz CW-ENDOR of 6.1 at the variable fields shown. ... 143
Figure 6.5. 35.0 GHz Davies 14N and 15N ENDOR spectra from 4.1 and 6.1 acquired at g = 2.005 ... 144
Figure 6.6. (A) EXAFS data. (B) Fourier transform of the EXAFS data. ... 146
Figure 6.7. (A) Computed geometry for [(TPB)Fe≡N-NH2]+ and (B) spin density plot for [(TPB)Fe≡N-NH2]+. ... 148
Figure 6.8. 77 K X-Band EPR spectrum comparing the addition of acid to 4.1 at different temperatures and the effect of thawing this sample to different temperatures.. ... 151
Appendix 1: Supplementary Data for Chapter 2 ...166
Figure A1.1. XRD Structure of ((PhBP3)Fe)(μ-η1:η1-N2H4)(μ-η2:η2-N2H2)((PhBP2PS)Fe) (2.4) with ellipsoids at 50% and C-H hydrogens and solvents removed for clarity. ... 171
Figure A1.2. XRD Structure of ((PhBP3)Fe(CO))2(μ-S) (2.5) with ellipsoids at 50% and hydrogens and solvents removed for clarity. ... 173
Appendix 2: Supplementary Data for Chapter 3 ...175
Figure A2.1. Crystal Structure for (TPB)FeOH (3.6) with ellipsoids at 50% and C-H hydrogens omitted for clarity. ... 182
Figure A2.2. NMR traces of the monitored decomposition of 3.3 to 3.4. ... 183
Figure A2.3. Titration of THF into a 4 mL ethereal solution of 3.2. ... 184
Figure A2.4. MO and spin density diagram of [(TPB)Fe]+ (3.2) optimized at the B3LYP/6-31G(d) level... 185
Figure A2.5. MO diagram addressing the T-shaped distortion in 3.2. ... 186
Figure A2.6. Variable Temperature Magnetic data for 3.2-3.5. ... 187
Appendix 3: Supplementary Data for Chapter 4 ...194
Figure A3.2. 1H NMR spectrum of the reaction mixture following protonation of [(TPB)Fe(N2)][Na(12-crown-4)2] compared with an authentic sample of
[(TPB)Fe(NH3)][BArF4]. ... 197
Figure A3.3. Calibration Curves for NH3 and N2H4 UV-Vis quantification. ... 198
Figure A3.4. IR spectra of addition of 10 equiv HBArF
4 · 2 Et2O to
[(TPB)Fe(N2)][Na(12-crown-4)2], followed by 12 equiv KC8. ... 199
Figure A3.5. 31P{1H} NMR spectra of addition of 10 equiv HBArF
4 · 2 Et2O to
[(TPB)Fe(N2)][Na(12-crown-4)2], followed by 12 equiv KC8. ... 200
Appendix 5: Supplementary Data for Chapter 6 ...219 Figure A5.1. 77 K EPR spectrum of the addition of 1 equivalent of HBArF4 · 2 Et2O to
complex 4.1. ... 220 Figure A5.2. 10 K EPR spectrum of the addition of 10 equivalents of HBArF4 · 2 Et2O to
complex 4.1 followed by the addition of 20 equivalents of KC8. ... 221
Figure A5.3. M06L/TZVP(Fe)/SVP(P,N,B)/6-31G(C, H) optimized structure of
[(TPB)Fe(HNNH)]+. ... 222 Figure A5.4. M06L/TZVP(Fe)/SVP(P,N,B)/6-31G(C, H) optimized structure of
List of Tables
Chapter 2: Unusually Low Valent Fe-S-Fe Complexes ...19
Table 2.1. Selected metrics for complexes 2.1, 2.2, and 2.3. ... 24
Table 2.2. Simulation parameters for complexes 2.1, 2.2, and 2.3 for the fits shown in Figure 2.3. ... 26
Chapter 3: Conversion of FeNH2 to FeN2 with Release of NH3 ...47
Table 3.1. Selected metrics for complexes 3.1-3.6. ... 52
Chapter 4: Catalytic Conversion of N2 to NH3 by an Fe Model Complex ...74
Table 4.1. Catalytic runs using the standard conditions described in the text with any changes noted in the experimental section... 82
Chapter 5: The Effect of Ligand and Reaction Conditions on Fe Mediated N2 Fixation ...104
Table 5.1. Selected bond lengths (Å) and τ4 values for complexes 5.1, 5.3, 5.9, 5.10, and 5.11... 111
Table 5.2. N2 reduction with phosphine Fe complexes. ... 114
Table 5.3. Effect of different solvents on the catalytic reduction of N2 to NH3 by complex 4.1... 116
Table 5.4. Effect of different reductants on the catalytic reduction of N2 to NH3 by complex 4.1. ... 117
Table 5.5. Effect of different acids on the catalytic reduction of N2 to NH3 by complex 4.1... 118
Chapter 6: Spectroscopic Characterization of the Putative Catalytic Intermediate [(TPB)Fe≡N-NH2][BArF4] ...136
Appendix 1: Supplementary Data for Chapter 2 ...166 Table A1.1. Crystal data and structure refinement for ((PhBP3)Fe)2(μ-S) (2.1). ... 167
Table A1.2. Crystal data and structure refinement for [((PhBP3)Fe)2
(μ-S)][Na(12-crown-4)2](2.2). ... 168
Table A1.3. Crystal data and structure refinement for [((PhBP3)Fe)2
(μ-S)][Na(12-crown-4)2]2(2.3)... 169
Table A1.4. Crystal data and structure refinement for ((PhBP3)Fe)(μ-η1:η1-N2H4)(μ-η2:η2
-N2H2)((PhBP2PS)Fe) (2.4). ... 170
Table A1.5. Crystal data and structure refinement for ((PhBP3)Fe(CO))2(μ-S) (2.5). ... 172
Appendix 2: Supplementary Data for Chapter 3 ...175 Table A2.1. Crystal data and structure refinement for (TPB)FeMe (3.1). ... 176 Table A2.2. Crystal data and structure refinement for [(TPB)Fe][BArF4] (3.2). ... 177
Table A2.3. Crystal data and structure refinement for [(TPB)Fe(N2H4)][BArF4] (3.3). . 178
Table A2.4. Crystal data and structure refinement for [(TPB)Fe(NH3)][BArF4] (3.4). .. 179
Table A2.5. Crystal data and structure refinement for (TPB)FeNH2 (3.5). ... 180
Table A2.6. Crystal data and structure refinement for (TPB)FeOH (3.6). ... 181 Table A2.7. Product quantification for the decomposition of 3.3 to 3.4. ... 183 Table A2.8. Simulation parameters for the variable temperature data for complexes 3.2-3.5... 188 Table A2.9. B3LYP/6-31G(d) DFT Optimized coordinates [Å] for [(TPB)Fe]+ (3.2). . 189 Table A2.10. B3LYP/6-31G(d) DFT Optimized coordinates [Å] for [(Me2PhP)3Fe]+. 192
Appendix 3: Supplementary Data for Chapter 4 ...194 Table A3.1. Crystal data and structure refinement for (TPB)FeCl. ... 195 Table A3.2. N2 reduction catalysis absorption data using [(TPB)Fe(N2
)][Na(12-crown-4)2]... 201
Table A3.4. Attempted N2 reduction catalysis absorption data using
(TPB)(μ-H)Fe(H)(N2). ... 202
Table A3.5. Attempted N2 reduction catalysis absorption data using FeCl2·1.5 THF. .. 202
Table A3.6. Attempted N2 reduction catalysis absorption data using FeCl3. ... 202
Table A3.7. Attempted N2 reduction catalysis absorption data using Fe(CO)5. ... 202
Table A3.8. Attempted N2 reduction catalysis absorption data using FeCp2. ... 203
Table A3.9. Attempted N2 reduction catalysis absorption data in the absence of an Fe
precursor. ... 203 Table A3.10. Attempted N2 reduction catalysis absorption data using (TPB)FeCl... 203
Table A3.11. Attempted N2 reduction catalysis absorption data using (TPB)FeN2. ... 203
Table A3.12. Attempted N2 reduction catalysis absorption data using
[(TPB)Fe(NH3)][BArF4]. ... 204
Table A3.13. Attempted N2 reduction catalysis absorption data using
[(TPB)Fe(N2H4)][BArF4]. ... 204
Table A3.14. Absorption data for a standard catalytic run in which N2H4 was added prior
to [(TPB)Fe(N2)][Na(12-crown-4)2] acid and reductant. ... 204
Table A3.15. Absorption and gas chromatograph integration data for standard catalytic runs. ... 204 Table A3.16. Gas chromatograph H2 yields for runs in the absence of an Fe precursor. 205
Appendix 4: Supplementary Data for Chapter 5 ...206 Table A4.1. Crystal data and structure refinement for [(TPBCy)Fe(N2)][Na(12-crown-4)2]
(5.1). ... 207 Table A4.2. Crystal data and structure refinement for [(DPB)Fe(N2)][K(Bz15-crown-5)2]
(5.3). ... 208 Table A4.3. Crystal data and structure refinement for (TPBCy)FeCl (5.9). ... 209 Table A4.4. Crystal data and structure refinement for(TPBPh)FeCl . ... 210 Table A4.5. Crystal data and structure refinement for (TPBPh’). ... 211 Table A4.6. N2 reduction catalysis absorption data using [(TPBCy)Fe(N2
Table A4.7. N2 reduction catalysis absorption data using [(TPBPh)Fe(N2
)][Na(12-crown-4)2] (5.2). ... 212
Table A4.8. Attempted N2 reduction catalysis absorption data using
[(DPB)Fe(N2)][K(Bz15-crown-5)2] (5.3). ... 212
Table A4.9. Attempted N2 reduction catalysis absorption data using
[(SiPiPr3)Fe(N2)][Na(12-crown-4)2]. ... 213
Table A4.10. Attempted N2 reduction catalysis absorption data using
[PhBPiPr
3]FeN2MgCl · 2 THF. ... 213
Table A4.11. Attempted N2 reduction catalysis absorption data using
(C2H4PCy2)3PFe(N2). ... 213
Table A4.12. Attempted N2 reduction catalysis absorption data using Fe(depe)2N2... 214
Table A4.13. N2 reduction catalysis absorption data using iPr2O. ... 214
Table A4.14. N2 reduction catalysis absorption data using DME. ... 214
Table A4.15. N2 reduction catalysis absorption data using Bu2O. ... 214
Table A4.16. Attempted N2 reduction catalysis absorption data using toluene. ... 215
Table A4.17. N2 reduction catalysis absorption data using 6:1 toluene:Et2O. ... 215
Table A4.18. Attempted N2 reduction catalysis absorption data using CoCp*2. ... 215
Table A4.19. Attempted N2 reduction catalysis absorption data using CrCp*2. ... 215
Table A4.20. Attempted N2 reduction catalysis absorption data using NaC10H8. ... 216
Table A4.21. Attempted N2 reduction catalysis absorption data using K as the reductant.
... 216 Table A4.22. Attempted N2 reduction catalysis absorption data using MgC14H10 · 3 THF.
... 216 Table A4.23. N2 reduction catalysis absorption data using Na/Hg... 216
Table A4.24. Attempted N2 reduction catalysis absorption data using
trifluoromethanesulfonic acid. ... 217 Table A4.25. Attempted N2 reduction catalysis absorption data using anhydrous HCl. 217
Table A4.26. Attempted N2 reduction catalysis absorption data using
[Lutidinium][BArF4] as the acid. ... 217
Table A4.27. N2 reduction catalysis absorption data using [2,6-dimethylanilinium][OTf].
Table A4.28. N2 reduction catalysis absorption data using
[2,6-dimethylanilinium][BArF4]. ... 218
Table A4.29. Attempted N2 reduction catalysis at RT absorption data. ... 218
Table A4.30. N2 reduction catalysis absorption data using
[2,6-dimethylanilinium][BArF
4]. ... 218
Appendix 5: Supplementary Data for Chapter 6 ...219 Table A5.1. M06L/TZVP(Fe)/SVP(P,N,B)/6-31G(C, H) DFT Optimized coordinates [Å] for [(TPB)Fe≡N-NH2][BArF4], 6.1. ... 224
Table A5.2. M06L/TZVP(Fe)/SVP(P,N,B)/6-31G(C,H) DFT Optimized coordinates [Å] for [(TPB)Fe(HNNH)]+. ... 227 Table A5.3. DFT Optimized coordinates energies [kcal/mol] for [(TPB)Fe(N2H2)]+
List of Abbreviations AX Hyperfine coupling constant due to nucleus X
Ad 1-Adamantyl
Anal Analysis
atm Atmosphere
Avg Average
BArF
4- B(3,5-C6H3(CF3)2)4
-br broad
Bu n-Butyl
ca Circa
calcd Calculated
CCD Charge-coupled device
cm Centimeter
cm-1 Wave number Cp Cyclopentadienyl
Cp* Pentamethylcyclopentadienyl CSD Cambridge Structural Database CV Cyclic voltammogram
Cy Cyclohexyl
d Doublet or deuterium dd Doublet of doublets
DFT Density Functional Theory DME 1,2-dimethoxyethane
dmpe 1,2-Bis(dimethylphosphino)ethane DMSO Dimethylsulfoxide
e Electron
ENDOR Electron nuclear double resonance EPR Electron paramagnetic resonance
Et Ethyl
eq Equivalents
equiv Equivalents
EXAFS Extended X-ray absorption fine structure eV Electron volt
F Structure factor
Fc Ferrocene
FeMoco Iron-Molybdenum cofactor
G Gauss
g Gram
g Electron g-factor GC Gas chromatography GHz Gigahertz
Hab Electronic coupling parameter for mixed valent complexes
Hz Hertz
iPr Isopropyl
IR Infrared
IVCT Inter valence charge transfer xJ
AB NMR coupling constant between atoms A and B along X number of bonds J NMR coupling constant or magnetic coupling constant
K Kelvin
L Generic neutral dative ligand kcal Kilocalorie
keV Kiloelectron volt
m Multiplet
M Concentration in molarity
max Maximum
Me Methyl
MeTHF Methyltetrahydrofuran
mg Milligram
MHz Megahertz mL Milliliter mM Millimolar mm Millimeter
mV Millivolt
mmol Millimole
MO Molecular orbital
n Generic number NIR Near infrared
nm nanometer
NMR Nuclear magnetic resonance
NxHy Generic nitrogenous ligand with x N atoms and y H atoms
o Ortho
Ph Phenyl
PhBP3 PhB(CH2PPh2)3- or generically PhB(CH2PR2)3
-PhBPiPr3 PhB(CH2PiPr2)3-
pKa Acid dissociation constant
PNP Pincer ligand with two phosphine and one nitrogen donors
q Quartet
R Generic organic group or R-factor RT Room temperature
S Spin quantum number
s Singlet or second SiP3 (o-PR2C6H4)3Si-
SQUID Superconducting quantum interference device t Triplet or time
TBA Tetra-n-butyl ammonium tBu Tert-Butyl
Tf SO2CF3
TMS Trimethylsilyl
TPB o-iPr2P(C6H4))3B or generically o-R2P(C6H4))3B
TPP Tetraphenylporphyrin UV Ultraviolot
V Volt
vbr Very broad Vis Visible
wR Weighted R-factor
X Generic anionic atom or molecule XAS X-ray absorption spectroscopy XRD X-ray diffraction
δ Chemical shift or Mössbauer isomer shift
° Degree
°C Degrees Celsius
ε Extinction coefficient in units of M-1cm-1 ηx Hapticity of order x
λ Wavelength
λmax Wavelength of local maximum intensity
μA Microamps
μ-X Bridging X ligand
μB Bohr magneton
μeff Effective magnetic moment
νxy Vibrational frequency between atoms x and y
Σ Summation
σ Sigma symmetry orbital or interaction π Pi symmetry orbital or interaction
τ4 Index of geometry between tetrahedral and trigonal pyramidal
Θ Weiss temperature
Å Angstrom
12-C-4 12-crown-4
1H Hydrogen-1
11B Boron-11 13C Carbon-13 15N Nitrogen-15 31P Phosphorus-31
1.1 Opening Remarks
All of the work discussed in this thesis involves the study of complexes either indirectly or directly relevant to the Fe mediated reduction of N2 to NH3. Additionally,
while this thesis work has been performed exclusively with synthetic complexes, a strong motivation for this work has been found in the enzymes that perform N2 fixation that are
known as nitrogenases. Whether this work has any relevance to the natural systems invoked is yet to be seen, but the conclusions drawn here at least motivate and validate new lines of thought and inquiry in the study of the natural systems. This introductory chapter will introduce the topic of N2 fixation in a general sense, and then give a brief
motivation and synopsis of the major results for each of the subsequent chapters as they relate to this over-arching theme.
1.2 Nitrogen Fixation
(A) N2 + 3 H2 2 NH3
(B) N2 + 8 H+ + 8 e- 2 NH3 + H2
Equation 1.1. Reactions for (A) the Haber-Bosch process and (B) N2 fixation mediated
by nitrogenase.
Biogeochemical cycles play a critical role in the availability and conversion of massive amounts of elements and molecules throughout the planet. Of the myriad cycles that regulate important elements or molecules, one of the most fascinating is the nitrogen cycle, wherein elemental nitrogen is transformed between its stable gaseous N2 form and
triple bond found in N2 (220 kcal/mol) and its non-polarity make the activation of this
molecule exceptionally challenging and have motivated interest in understanding the conversion of N2 into reduced species such as NH3. Due to the importance of fixed
nitrogen molecules such as NH3 in fertilizing crops, mankind has developed an acute
need of a catalytic process for the production of NH3. The Haber-Bosch process, wherein
N2 and H2 are converted to NH3 over an Fe-based catalyst at high temperatures and
pressures (Equation 1.1A), has been applied on a globally massive scale as a means to effectively feed burgeoning human populations.1
Figure 1.1.X-Ray Diffraction (XRD) structure and chemical line drawing representation of FeMoco. The XRD figure was made with coordinates from Reference 4b.
In nature, N2 is fixed to NH3 by bacteria known as diazotrophs, which are
frequently found on root nodules, via the reaction shown in Equation 1.1B.2 The precise
enzymatic machinery with which these organisms bind N2 and the mechanism they
employ to reduce it have been topics of great interest. Multiple studies have implicated a series of cofactors as the site of NH3 formation (Figure 1.1).3 These cofactors always
cofactor,4 consensus on the atom(s) at which N2 reduction occurs has not been reached.
Because Mo was once thought to be an essential component of all nitrogenases, the site of N2 binding was initially thought to be the single Mo atom in the FeMoco.2 This
assumption found support in studies on synthetic inorganic Mo complexes that bind and reduce N2.5
Figure 1.2. Mo complexes that mediate the catalytic reduction of N2 to NH3. Left:
Schrock’s tri-amidoamine system (Reference 9). Right: Nishibayashi’s PNP system
(Reference 11).
Although some ill-defined mixtures with transition metals have been shown to generate NH3 from N2, these systems do not allow for insight into the mechanism of
reduction.6 One avenue of research that has helped to guide discussion about possible N2
reduction mechanisms has been the synthesis of molecular transition metal complexes that bind and reduce N2. Since the discovery of the first N2 complex by Allen and Senoff
in 1965, there has been great interest in developing molecular species that will mimic or provide insight into biological N2 fixation.7 In the context of Mo, discoveries by Chatt,
Hidai, and others have demonstrated that reduced metal centers can bind N2 and
electrochemical reduction of N2 to NH3 was reported by Pickett and co-workers.8 These
studies, as well as the synthesis of a variety of other nitrogenous species, led to the proposal of a mechanism now known as the “Chatt” or “distal” mechanism (Scheme 1.1,
bottom) for N2 reduction.5 Despite this understanding, realization of a well-defined
molecular system for the catalytic reduction of N2 to NH3 at atmospheric pressure
remained elusive until Schrock and Yandulov’s landmark discovery in 2003 that a Mo
tri-amidoamine (Figure 1.2) system can produce up to 8 equivalents of NH3 per Mo from
N2.9 This report, and the accompanying characterization of multiple proposed
intermediates that implicated a “distal” mechanism for N2 reduction in this system,10
represented the first well-defined molecular system for catalyzing N2 reduction to NH3.
Scheme 1.1. Proposed limiting mechanisms for transition metal mediated N2 reduction.
An “alternating” mechanism is shown on top in blue while a “distal” mechanism is
shown are possible crossover pathways between mechanisms. Note that while M could feasibly be any transition metal, Mo and Fe are the most salient elements for this discussion.
More recently, Nishibayashi and co-workers have reported a phosphine ligated Mo center that improves slightly on Schrock’s system (Figure 1.2).11 This PNP ligated
Mo complex is competent for up to 12 equivalents of NH3 per Mo center. The combined
synthetic studies of Schrock and Nishibayashi were consistent with the hypothesis that Mo serves as the active metal for nitrogenase under turnover conditions.2 Despite these results, however, the functionality of nitrogenases without Mo incorporated into the cofactor and other data began to suggest that Mo was not the active N2 binding site within
nitrogenases.
A number of spectroscopic studies on nitrogenase have recently indicated that Fe may in fact be the site where N2 is bound and reduced, and have further supported an
“alternating” mechanism wherein protons are alternately added to N2 to form
intermediates such as HN=NH and H2N-NH2 (Scheme 1.1 top).3,12 Such a mechanism
directly contrasts with the “distal” mechanism previously mentioned, wherein protons are
added consecutively to single nitrogen atoms to generate intermediates such as nitrides (Scheme 1.1 bottom). Due to this proposed binding site and differing mechanism, there has been demand for Fe complexes that can (a) serve as structural, spectroscopic, or functional models of the Fe sites in FeMoco, (b) stabilize putative intermediates along a N2 fixation pathway (Scheme 1.1), or (c) serve as models for the highly reduced states of
towards developing synthetic Fe complexes that can structurally or functionally model nitrogenase or proposed catalytic intermediates.13 Indeed, several groups have
demonstrated various Fe complexes that bind NxHy ligands or display corresponding
reactivity directly relevant to N2 reduction schemes.14
The Peters lab has had an ongoing interest in developing Fe systems that can functionally model the chemistry of nitrogenase enzymes. A guiding hypothesis for this research has been the postulation that N2 reduction occurs at a single Fe site at the
FeMoco and that this site samples multiple geometries in order to mediate catalytic turnover (Scheme 1.2). In order to model such a site, soft electron donating
tris-phosphine ligands have been utilized to stabilize low-valent Fe complexes in a number of geometries. Initially, pseudo-tetrahedral complexes of Fe with the tris-phosphine borate zwitterion PhB(CH2PR2)3- (PhBP3) were targeted.15 These ligands stabilize low-valent
and multiply bonded metal species on Fe. There was, however, a dearth of research into sulfur based chemistry on these scaffolds, which motivated further study into these types of complexes.
Scheme 1.2. Scheme depicting a potential mechanism for N2 binding to FeMoco utilizing
a flexible Fe-C interaction. Possible sites of protonation prior to or concurrent with N2
1.3 Unusually Low Valent Fe-S-Fe Complexes
The active site FeMoco consists of a cluster composed primarily of Fe-S-Fe linkages.3 As such, research into the synthesis and characterization of model complexes of these linkages has been an area of significant study.16 Unusually low formal oxidation states of iron have been implicated as important to the function of nitrogenase, and it is of increasing interest to understand whether the S2- structural unit is compatible with such low-valent iron.3 In this context, Holland and co-workers have recently reported {[HC(CMeN[2,6-diisopropylphenyl])2]Fe}2{μ-S} and its interactions with nitrogenous
substrates, as well as recently reporting the reduction of this complex to form the first example of a stable Fe(I) sulfide.17 It was of further interest to determine whether other geometries at low-valent Fe could be stable in the presence of sulfide and furthermore, whether a mixed-valent Fe(II)/Fe(I) species could be isolated and what its electronic structure might be.
Chapter 2 outlines the synthesis and characterization of a series of unusually low-valent [(PhBP3)Fe]2(μ-S) complexes in the formal oxidation states Fe(II)/Fe(II),
Fe(II)/Fe(I), and Fe(I)/Fe(I). As mentioned, these complexes represent rare examples of Fe(I) ligated to S2-, and possess fascinating structural and electronic features
distinguished by exceptionally short Fe-S bonds and a high degree of magnetic coupling between the two metal centers. Furthermore, the Fe centers in these complexes undergo a transition to low-spin states upon reduction, resulting in unusual examples of tetrahedral low-spin Fe(I). Finally, these dimers display interesting reactivity towards small
1.4 Conversion of FeNH2 to FeN2 with Release of NH3
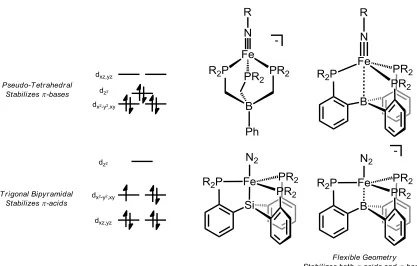
Figure 1.3. Qualitative d-orbital splitting diagrams and examples of complexes that feature pseudo-tetrahedral and trigonal bipyramidal geometries stabilizing bases and π-acids respectively. Note that Fe-Si or Fe-B bonding orbitals may be near or within the d-manifold, but are not shown.
As was mentioned, a key feature of (PhBP3)Fe complexes was the stabilization of
strong π-donors in species such as Fe nitrides or imides that would be found along a distal
mechanism. Such stabilization was engendered from the pseudo-tetrahedral geometry enforced by the PhBP3 ligand scaffold (Figure 1.3).15d A drawback to this design,
however, was the limited activity of these systems towards functionalization of N2,
[image:39.612.111.528.93.359.2]access complexes better capable of functionalizing N2 molecules, a shift to a trigonal
bipyramidal geometry was sought with a new tris-phosphino silyl ligand (o-PR2C6H4)3Si
-(SiP3). This shift resulted in a system poised for N2 uptake and functionalization most
clearly illustrated by the stabilization of terminal (SiP3)FeN2 complexes in three formal
oxidation states and the subsequent silylation of N2 on this scaffold.18 A drawback to this
system, however, is that the shift to trigonal bipyramidal geometry results in the lowering of the dxz and dyz orbitals such that stabilization of π-basic ligands is no longer favorable
(Figure 1.3). This is most clearly evidenced by the low temperature observation of an Fe nitrene species which decays upon warming to RT, in contrast to the PhBP3 systems
which readily stabilize imide species.19
In order to combine the N2 binding capabilities and functionalization capabilities
of the trigonal bipyramidal system with the stability of the pseudo-tetrahedral systems towards π-basic ligands, a new tris-phosphine borane (TPB) ligand set was utilized.20 A
key feature to this ligand set is a flexible Fe-B interaction that allows the metal center to sample both trigonal bipyramidal and pseudo-tetrahedral geometries (Figure 1.3). Indeed, this ligand has shown the ability to both readily bind N2 as well as stabilize
π-basic nitrogenous ligands, which allows for di-functionalization of N2 with silyl
electrophiles.21 Despite these results, little research into the installation of ligands with N-H bonds had been investigated.
Chapter 3 focuses on the installation of NxHy ligands onto the (TPB)Fe platform.
While complexes featuring substituted NR, N2R, and N-NR2 functionalities had been
synthesized with this ligand set,21 no substrates, aside from (TPB)Fe(N
2), that would
4-coordinate pseudo-trigonal pyramidal cationic precursor [(TPB)Fe]+ as a synthon, N2H4,
NH3, and NH2- functionalities were installed. All of these species are high-spin S = 3/2
and display characteristic quartet EPR signals. Finally, sequential protonation and
reduction of (TPB)Fe(NH2) results in loss of NH3 and uptake of N2 to yield (TPB)Fe(N2).
Significantly, this reaction sequence represents the first time that a single Fe system has been shown to mediate the final two common reductive protonation steps of a N2
reduction scheme (Scheme 1.1). This result motivated studies into whether NH3 could be
produced from N2 with this scaffold.
1.5 Catalytic Conversion of N2 to NH3 by an Fe Model Complex
While progress has been made towards stabilizing nitrogenous species relevant to N2 reduction on Fe platforms, an Fe system in which N2 can be directly transformed into
NH3 in a catalytic fashion was unknown. Prior to the studies described herein, even
stoichiometric conversion of FeN2 into NH3 was limited to yields of ~ 0.1 equivalents of
NH3 per Fe center.13,22 Recent advances in a related context include a system reported by
Holland and co-workers capable of splitting N2 into two nitrides which can then release
nearly stoichiometric NH3 upon protonolysis or hydrogenolysis and a report from
Nishibayashi and co-workers describing the catalytic silylation of N2 with simple Fe salts
and complexes.23,24 Despite these interesting and important examples, distinct issues are associated with the direct conversion of N2 into NH3 with protons and electrons, most
notably the need to circumvent formation of H2 which prevented the realization of a
Scheme 1.3. Catalytic reduction of N2 to NH3 by a molecular Fe pre-catalyst.
Chapter 4 outlines the initial studies and development of a molecular Fe based catalyst for the reduction of N2 to NH3. While preliminary protonation studies with
(TPB)Fe(N2) complexes resulted in oxidation, use of excess acid and low temperatures
enabled the observation of an [(TPB)Fe(NH3)]+ being formed from bound N2. In Chapter
3, the reduction of [(TPB)Fe(NH3)]+ to release NH3 and uptake N2 had already been
shown, and canvassing several reaction conditions resulted in the discovery that anionic [(TPB)Fe(N2)]- can produce an average of 7 equivalents of NH3 per Fe, resulting in a
yield of > 40% of protons being reliably delivered to N2 (Scheme 1.3). Control studies
with simple Fe salts that shown negligible NH3 formation combined with the initial
reactions that show the formation of a molecular NH3 adduct upon acidification, offer
responsible for catalyst degradation. Overall, the exciting discovery of N2 reduction by
[(TPB)Fe(N2)]- motivated further studies of the catalytic system.
1.6 The Effect of Ligand and Reaction Conditions on Fe Mediated N2 Fixation
With the discovery that (TPB)Fe systems can catalyze N2 reduction to NH3, there
was an added impetus to determine the scope of the catalysis and the effect of varying the catalytic conditions. Additionally, investigations of the competency of different pre-catalysts were pursued as probes of what structural features of the (TPB)Fe system were essential for catalysis. Towards this end, Chapter 5 outlines comparative studies where both the catalytic conditions and pre-catalysts have been varied.
Variations on the standard catalytic conditions by changing factors such as solvent, temperature, acid, and reductant on catalysis have been examined, revealing that while no improvement in NH3 yield was observed, general trends in reactivity indicate
that the reaction must be performed in an ethereal solvent. Despite the limited solvent scope, some flexibility in the choice of acid and reductant is available with anilinium acids and Na/Hg amalgam as a reductant proving competent for catalysis. Canvassing a variety of either novel or previously reported Fe phosphine complexes for efficacy as pre-catalysts for N2 reduction leads to the empirical conclusion that only TPB complexes are
competent for producing > 2 equivalents of NH3 per Fe center. The cause for this
molecular. Were a heterogeneous decomposition product were responsible for the catalysis, a strong dependence on the ligand set would likely not be observed.
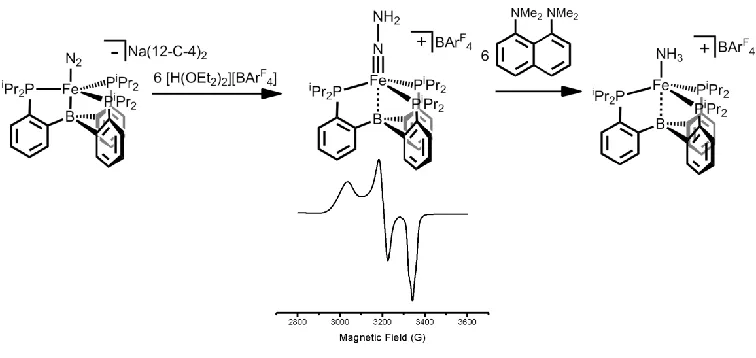
[image:44.612.136.514.221.400.2]1.7 Spectroscopic Characterization of the Putative Catalytic Intermediate [(TPB)Fe≡N-NH2][BArF4].
Figure 1.4. Generation of a di-protonated intermediate which partially decomposes to an NH3 complex.
Despite the realization of catalysis in the (TPB)Fe system, there remains little to no mechanistic information on how N2 reduction is mediated. Specifically, questions
about whether this system is going through a “distal,” “alternating,” or other hybrid type mechanism are of great interest. While direct probing of the molecular species under turnover is challenging due to the heterogeneous nature of the favored reductant (KC8)
ligand on Fe could be generated from the pre-catalyst. With this goal in mind, low-temperature protonation studies were undertaken.
Chapter 6 details the synthesis and spectroscopic characterization of a thermally unstable cationic [(TPB)Fe(N2H2)]+ species. Combined EPR, ENDOR, and EXAFS
analysis indicates that this complex is S = 1/2 and doubly protonated. Furthermore, this species possesses a short Fe-N interaction, consistent with an Fe-N triple bond.
Computational studies on this complex also support the presence of an Fe-N triple bond, providing reasonable agreement with spectroscopic measurements. Such an assignment is consistent with double protonation at the βN of N2, as would be found in a “distal”
References Cited
1 Smil, V. Enriching the Earth; MIT Press: Cambridge, MA, 2001.
2 (a) Burgess, B. K.; Lowe, D. J. Chem. Rev. 1996, 96, 2983-3011; (b) Eady, R. R. Chem. Rev.1996, 96, 3013-3030.
3 (a) Dos Santos, P. C.; Igarashi, R. Y.; Lee, H. I.; Hoffman, B. M.; Seefeldt, L. C.; Dean, D. R. Acc. Chem. Res. 2005, 38, 208-214; (b) Howard, J. B.; Rees, D. C. Proc. Natl. Acad. Sci. 2006, 103, 17088-17093; (b) Peters, J. C.; Mehn, M. P. In Activation of Small Molecules; Wiley: 2006, p 81-119; (c) Schwarz, G.; Mendel, R. R.; Ribbe, M. W. Nature 2009, 460, 839-847; (d) Seefeldt, L. C.; Hoffman, B. M.; Dean, D. R.
Annu. Rev. Biochem. 2009, 78, 701-722.
4 (a) Lancaster, K. M.; Roemelt, M.; Ettenhuber, P.; Hu, Y. L.; Ribbe, M. W.; Neese, F.; Bergmann, U.; DeBeer, S. Science 2011, 334, 974-977; (b)Spatzal, T.; Aksoyoglu, M.; Zhang, L.; Andrade, S. L. A.; Schleicher, E.; Weber, S.; Rees, D. C.; Einsle, O. Science
2011, 334, 940.
5 (a) Chatt, J.; Dilworth, J. R.; Richards, R. L. Chem. Rev. 1978, 78, 589-625; (b) Hidai, M.; Mizobe, Y. Chem. Rev. 1995, 95, 1115-1133.
6 (a) Shilov, A.; Denisov, N.; Efimov, O.; Shuvalov, N.; Shuvalova, N.; Shilova, A. Nature 1971, 231, 460-461; (b) Bazhenova, T. A.; Shilov, A. E. Coord. Chem. Rev. 1995, 144, 69-145.
11 Arashiba, K.; Miyake, Y.; Nishibayashi, Y. Nature Chem. 2011, 3, 120-125. 12 Hoffman, B. M.; Dean, D. R.; Seefeldt, L. C. Acc. Chem. Res. 2009, 42, 609-619. 13 (a) Crossland, J. L.; Tyler, D. R. Coord. Chem. Rev. 2010, 254, 1883-1894; (b) MacLeod, K. C.; Holland, P. L. Nat. Chem. 2013, 5, 559-565.
14 For a few examples see: (a) Smith, J. M.; Lachicotte, R. J.; Pittard, K. A.; Cundari, T. R.; Lukat-Rodgers, G.; Rodgers, K. R.; Holland, P. L. J. Am. Chem. Soc. 2001, 123, 9222-9223; (b) Gilbertson, J. D.; Szymczak, N. K.; Tyler, D. R. J. Am. Chem. Soc.
2005, 127, 10184-10185. (c) Field, L. D.; Li, H. L.; Magill, A. M. Inorg. Chem. 2008, 48, 5-7.
15 (a) Brown, S. D.; Betley, T. A.; Peters, J. C. J. Am. Chem. Soc. 2002, 125, 322-323; (b) Betley, T. A.; Peters, J. C. J. Am. Chem. Soc. 2003, 125, 10782-10783; (c) Betley, T. A.; Peters, J. C. J. Am. Chem. Soc. 2004, 126, 6252-6254. (d) Saouma, C. T.; Peters, J. C. Coord. Chem. Rev. 2011, 255, 920-937.
16 Holm, R. H. Acc. Chem. Res. 1977, 10, 427-434.
17 Vela, J.; Stoian, S.; Flaschenriem, C. J.; Münck, E.; Holland, P. L. J. Am. Chem. Soc. 2004, 126, 4522-4523; (b) Rodriguez, M. M.; Stubbert, B. D.; Scarborough, C. C.; Brennessel, W. W.; Bill, E.; Holland, P. L. Angew. Chem. 2012, 124, 8372-8375. 18 Lee, Y.; Mankad, N. P.; Peters, J. C. Nat. Chem. 2010, 2, 558-565.
21 (a) Moret, M.-E.; Peters, J. C. Angew. Chem. Int. Ed. 2011, 50, 2063-2067; (b) Moret, M.-E.; Peters, J. C. J. Am. Chem. Soc. 2011, 133, 18118-18121.
22 Hills, A.; Hughes, D. L.; Jimenez-Tenorio, M.; Leigh, G. J.; Rowley, A. T. J. Chem. Soc. Dalton 1993, 3041-3049.
23 Rodriguez, M. M.; Bill, E.; Brennessel, W. W.; Holland, P. L. Science 2011, 334, 783.
2.1 Introduction
The Fe-S-Fe unit is common to a host of metalloenzymes that mediate metabolic transformations central to life. These include proteins or cofactors that act as electron transfer conduits1, as well as metalloenzymes that transform small molecules such as the hydrogenases2 and nitrogenases.3 As such, research into the synthesis and
characterization of model complexes of these cofactors has been an area of significant study.4 Holm pioneered the synthesis of lower valent iron-sulfur clusters exemplified by
the synthesis of the all iron(II) cluster [Fe4S4(iPr2NHCMe2)4].5 Unusually low formal
oxidation states of iron (e.g., Fe(I) and Fe(0)) have been implicated as important to the function of hydrogenase and nitrogenase enzymes and it is of increasing interest to understand whether the S2- structural unit is compatible with such low-valent iron. In this context, Holland and co-workers have recently reported
{[HC(CMeN[2,6-diisopropylphenyl])2]Fe}2{μ-S} and the first all Fe(I) sulfide
{[HC(CMeN[2,6-diisopropylphenyl])2]Fe}2{μ-S}2- and interactions of the former with nitrogenous
substrates.6 The Peters lab has also had an interest in the study of unusually low-valent Fe-X-Fe linkages that relate to N2 reduction, with examples being where the bridging X
unit is either imide (NH2-) or nitride (N3-).7 Herein this narrative is extended by reporting
a series of Fe-S-Fe complexes in the formal oxidation states Fe(II)/Fe(II), Fe(II)/Fe(I), and Fe(I)/Fe(I). This series of complexes possess rich magnetic and spectroscopic characteristics indicative of a spin-state change to unusual low-spin Fe(I) centers upon reduction. In addition to the thorough characterization of these species, the CO uptake and subsequent H+ reduction chemistry of the Fe(II)/Fe(II) system, as well as its
2.2 Results and Discussion
2.2.1 Low-Valent Fe-S-Fe Complexes
In order to install a μ-S unit to bridge two (PhBP3)Fe (PhBP3 = PhB(CH2PPh2)3-)
units, a soluble source of S2- was sought as a salt metathesis partner with (PhBP3)FeCl.
While S8 and simple alkali metal SH- salts did not provide clean products, use of
[TBA][SH] (TBA = NBu4+) reacted with (PhBP3)FeCl to generate the ferrous complex
((PhBP3)Fe)2(μ-S) (2.1) as a dark brown material in moderate yield (Scheme 2.1). The
cyclic voltammogram (CV) of 2.1 in THF displays two reversible reduction events at -1.52 V and -2.30 V vs. Fc/Fc+ which are assigned as the Fe(II)Fe(II)/Fe(II)/Fe(I) and Fe(II)Fe(I)/Fe(I)Fe(I) couples respectively (Figure 2.1). The reversibility of the CV suggested that the reduced species could be stable and thus chemical reductions were investigated.
-1.2 -1.5 -1.8 -2.1 -2.4 -2.7 -2
-1 0 1 2 3
Curre
nt
(
A)
E (V vs. Fc/Fc+)
Figure 2.1. CV of 2.1. Conditions: 100 mV/s THF, 0.01 M [NBu4][PF6], THF, glassy
[image:51.612.201.441.419.630.2]Reduction of 2.1 with an excess of Na/Hg in THF for fifteen minutes results in a color change from dark brown to deep green. Addition of 12-crown-4 and crystallization results in the isolation of [((PhBP3)Fe)2(μ-S)][Na(12-crown-4)2] (2.2) as nearly black
crystals (Scheme 2.1). If a stronger reductant is used and 2.1 is instead reduced with two equivalents of NaC10H8 a black solution results, which upon addition of 12-crown-4 and
crystallization results in the formation of [((PhBP3)Fe)2(μ-S)][Na(12-crown-4)2]2 (2.3) as
an extremely air sensitive black solid (Scheme 2.1).
Scheme 2.1. Synthesis of complexes 2.2 and 2.3.
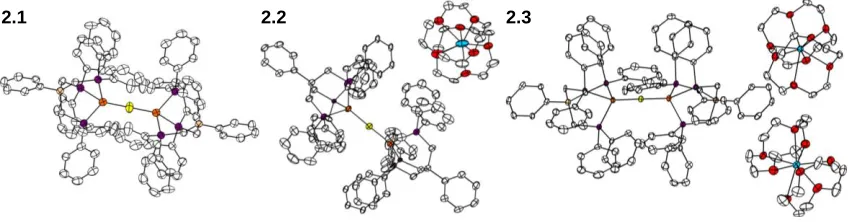
Complexes 2.1, 2.2, and 2.3 have been structurally characterized and display several structural features of note (Figure 2.2). The most striking features present in these complexes are the uniformly short Fe-S distances that are substantially shorter than the average reported Fe-S bond length in bridging sulfides (2.2 Å).8 The Fe-S distance of 2.071(1) (Table 2.1) Å in complex 2.3 is, within error, the shortest Fe-S distance reported in the CSD, with a close example of 2.078(8) Å reported by Coucouvanis and
Additionally, the marginal differences in Fe-S bond lengths in 2.1-2.3 (0.032 Å) suggest little to no perturbation of the bonding upon reduction.
All three complexes display nearly, or perfectly in the case of 1, linear Fe-S-Fe angles. Sulfides of Fe are typically bent as illustrated in the example from Coucouvanis.9 The steric profile of the (PhBP3) framework allows for substantially bent Fe-X-Fe
geometries7c and so the linearity in complexes 2.1-2.3 is also likely indicative of an electronic preference for this geometry such as multiple bonding across the Fe-S-Fe unit. Outside of the Fe-S-Fe core, two structural features deserve mention.
Figure 2.2. XRD structures of complexes 2.1, 2.2, and 2.3 with ellipsoids at 50% and hydrogens omitted for clarity. Fe atoms are shown in orange, S in yellow, P in purple, Na in blue, O in red, and C in white.
Firstly, the P-Fe-Fe-P torsion angles in 1 are 60° as demanded by the
crystallographic inversion center in this complex. Upon reduction, the complex adopts a more “eclipsed” geometry, with P-Fe-Fe-P angles of 18° in 2.2 and 13° in 2.3. The origin of this structural change is not clear, as the π-bonding across the Fe-S-Fe unit
should not change upon going from D3d to D3h symmetry. Secondly, and more curiously,
a drastic contraction in Fe-P bond distances is apparent upon reduction of the series of complexes. While complex 2.1 possesses Fe-P bond distances consistent with other
[image:53.612.114.539.294.405.2]examples of high-spin Fe(II) from our laboratory,7a a contraction of 0.22 Å in the average Fe-P bond lengths is apparent upon reduction from 2.1 to 2.3, resulting in an exceptionally short average Fe-P bond distance of 2.17 Å in 2.3 (The average Fe-P distance in the CSD is 2.24 Å).8 Some contraction in these lengths might be expected from increased back-bonding from the reduced Fe centers, but the short distance of 2.17 Å is indicative of a low-spin state at Fe, suggesting that a spin-state change has occurred.
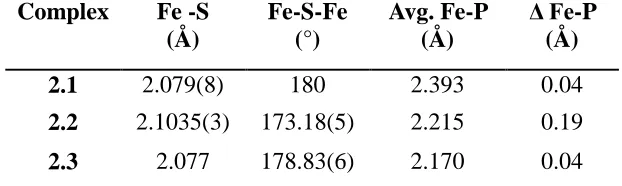
Complex Fe -S (Å) Fe-S-Fe (°) Avg. Fe-P (Å) Δ Fe-P (Å)
2.1 2.079(8) 180 2.393 0.04
[image:54.612.168.479.240.333.2]2.2 2.1035(3) 173.18(5) 2.215 0.19 2.3 2.077 178.83(6) 2.170 0.04 Table 2.1. Selected metrics for complexes 2.1, 2.2, and 2.3.
Complexes 2.1, 2.2, and 2.3 all display paramagnetically shifted 1H NMR shifts at RT and so variable temperature magnetic susceptibility measurements were acquired by SQUID magnetometry (Figure 2.3). Complex 2.1 displays a magnetic moment of 2.0 μB
at 300 K which decreases relatively linearly upon cooling to 75 K. The room RT magnetic moment, which is substantially smaller than the value of 6.9 μB that would be
between intermediate spin Fe centers by this method is challenging. The long Fe-P bond distances and the Mössbauer data (vide infra) for 2.1 seem to support the high spin S1 = S2 = 2 case as more likely.
Figure 2.3. Variable temperature magnetic susceptibility measurements on complexes 2.1-2.3.
Unlike complex 2.1, complex 2.2 shows a high magnetic moment of 5.8 μB at 300
K which does not substantially decrease until ~50 K, after which it drops, likely due to intermolecular antiferromagnetic interactions. The lack of a downward slope suggests little to no antiferromagnetic coupling. The possible spin states for a Fe(II)/Fe(I) dimer are S1= 2 S2= 3/2, S1= 2 S2= 1/2, S1= 1 S2= 3/2, S1= 1 S2= 1/2, or S1= 0 S2= 1/2. If
both Fe centers were high spin, as in complex 2.1, a spin-only moment of 6.2 μB for two
weakly interacting Fe centers might be expected. The fact that the moment of 2.2 is lower than this predicted value and that the moment shows a relatively flat temperature profile down to 50 K suggests that a high-spin state assignment is likely not reasonable
0 50 100 150 200 250 300 0.5 1.0 1.5 2.0 2.5 3.0 3.5 4.0 4.5 5.0 5.5 6.0
eff
[image:55.612.181.474.155.394.2]for this complex. Accordingly, simulations with S1= 2 and S2 = 3/2 provide poor fits to the data.
Complex S1 S2 g J (cm-1) Θ (K)
2.1 2 2 2.00 -154 0
2.2 2 1/2 2.01 110 -5.7
[image:56.612.194.457.126.262.2]2.3 1/2 1/2 2.06 197 -1
Table 2.2. Simulation parameters for complexes 2.1, 2.2, and 2.3 for the fits shown in Figure 2.3.
The moment for 2.2 of 5.8 μB at 300 K is close to the spin-only value for a single
S = 5/2 center (5.9 μB), suggesting that an S1= 2, S2 = 1/2 or S1= 1, S2 = 3/2 spin state assignment with strong ferromagnetic coupling seems appropriate. While simulation with either of these parameters provides a reasonable fit, a strongly ferromagnetically coupled S1= 2, S2 = 1/2 state is the preferred assignment for reasons that will be discussed shortly. As an additional note, ferromagnetic coupling between two metal centers typically results in a magnetic moment that increases with decreasing
The large J value in 2.2 suggests that there should be some degree of electronic coupling between the two metal centers. Classically, in the case of mixed-valence complexes like 2.2, one way to probe this coupling has been to examine the line shape of the inter-valence charge transfer (IVCT) band via near-IR spectroscopy.13 Complex 2.2 does indeed show a relatively strong IVCT band at 6750 cm-1 (Figure 2.4A) in its near-IR spectrum. Analysis of the lineshape of this band indicates that Hab for this complex is
562 cm-1, suggesting a moderate degree of electronic coupling and classifying 2.2 as class
II using the Robin-Day classification system.14 In addition to the near-IR data
mentioned, low temperature X-band EPR data on 2.2 have been acquired (Figure 2.4B). The 4 K spectrum of 2.2 in 2-MeTHF displays a broad signal with a large feature at g = 5.64 and a smaller feature at g = 2.12. Although the magnetic moment at 4 K is
substantially decreased, likely due to inter-molecular effect, the EPR data suggests that S > 1/2 states are populated even at very low temperatures, consistent with the
[image:57.612.128.520.472.650.2]ferromagnetic coupling observed.
solvent background subtraction. Conditions for (B): microwave power, 20.313 mW; microwave frequency, 9.380 GHz; modulation amplitude, 4.00 G; gain, 5020.
The dianionic complex 2.3 was analyzed similarly to monoanionic 2.2. Complex 2.3 displays a similar temperature dependence to that observed in complex 2.2 with little to no change from the μeff = 2.8 μB value observed at 300 K until the temperature drops
below ~ 100 K. It is even more apparent for this sample that a high-spin assignment for the two Fe centers is inappropriate, as two S = 3/2 centers without antiferromagnetic coupling, which can again be excluded by the dependence of the moment on temperature, should have a minimum μeff of 5.5 μB. A similar analysis to that performed for 2.2 leads
to the conclusion that an S1 = S2 = 1/2 spin state assignment with a large degree of ferromagnetic coupling between the two magnetic centers adequately describes the magnetic behavior and these parameters provide a reasonable fit to the data (Figure 2.3, table 2.2). As was found in the case of 2.2, the absence of a well-defined slope for 2.3 precludes the accurate determination of J, but a large positive value seems required. These combined crystallographic and magnetic data suggest that the reduced Fe centers in 2.2 and 2.3 are undergoing a spin transition to S = 1/2 upon reduction. Low-spin Fe(I) centers are uncommon in general, and are even more rare in tetrahedral geometries. In order to obtain more confirmation of this assignment, Mössbauer data were collected on the redox series of complexes.
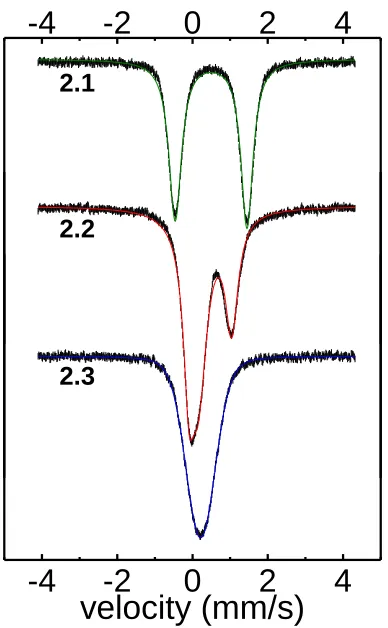
Complex 2.1 displays a quadrupole doublet with an isomer shift of δ = 0.49 mm/s and a quadrupole splitting of ΔEq = 1.91 mm/s in its 80 K Mössbauer spectrum (Figure
that are quite similar to these values.15 Upon reduction, a new spectrum is obtained that can be fit as two independent sites in a 1:1 ratio. The parameters for the two signals indicate one site having δ = 0.47 mm/s and ΔEq = 1.14 mm/s and the other site having
drastically different parameters of δ = 0.16 mm/s and a small poorly resolved quadrupole splitting of ΔEq = 0.01 mm/s. The reasonable assignment for this spectrum is that the two
Fe sites are resolved on the Mössbauer timescale. While the first site is still relatively consistent with high-spin Fe(II) centers, the second site, and its negligible quadrupole splitting, suggest a different electronic structure.
Figure 2.5. 80 K Mössbauer spectra of solid samples of complexes 2.1-2.3 and corresponding fits.
-4
-2
0
2
4
-4
-2
0
2
4
velocity (mm/s)
2.1
2.2
[image:59.612.228.422.296.610.2]Upon further reduction to 2.3, the quadrupole doublet signal disappears and the remaining signal has δ = 0.22 mm/s with no resolvable quadrupole splitting. Previously
reported Fe(I) complexes on PhBP3 are high-spin, and their Mössbauer parameters do not
show good agreement with the parameters found in 2.3, suggesting that this site is not well modeled as a high-spin Fe(I) site, leaving a low-spin Fe(I) site as the most plausible alternative, especially when considering the magnetic and structural data already
presented. The values for the isomer shifts of the reduced Fe centers in 2.2 and 2.3 deserve some mention, as one typically observes an increase in δ upon reduction.16 The observed negative change in δ is likely a result of the high covalency and greater
[image:60.612.128.533.382.584.2]back-bonding into the phosphine ligands in this series of complexes as well as the proposed spin-state change.
Figure 2.6. Qualitative d-orbital splitting diagrams illustrating the coupling in 2.1-2.3.
A satisfying explanation for the observed structural, magnetic, and spectroscopic data for this series of redox complexes warrants consideration. The structural data,
![Figure 2.1. CV of 2.1. Conditions: 100 mV/s THF, 0.01 M [NBu4][PF6], THF, glassy](https://thumb-us.123doks.com/thumbv2/123dok_us/8106991.235371/51.612.201.441.419.630/figure-cv-conditions-thf-nbu-pf-thf-glassy.webp)