PEM Fuel Cell Drying and Flooding Diagnosis
with Signals Injected by a Power Converter
Giovanni Dotelli, Roberto Ferrero,
Member
,
IEEE
, Paola Gallo Stampino, Saverio Latorrata and Sergio Toscani,
Member
,
IEEE
Abstract—In this paper, a low-cost approach for PEM fuel cell drying and flooding diagnosis based on power converter ripple is presented, suitable to be implemented in commercial applications. If proper signal processing algorithms are employed, the high-frequency ripple inherently produced by switch-mode converters allows to monitor the fuel cell ohmic resistance, which
is a good indicator for membrane drying, while an ad hoc
switching control of the converter allows to monitor also the low-frequency impedance, which is an indicator for cell flooding. This technique is tested with a DC/DC boost converter directly connected to a single cell, discussing how different fuel cell operation modes (such as constant current or constant voltage) may affect the sensitivity required to the diagnostic algorithm to correctly recognize drying and flooding occurrences.
Index Terms—Fuel cell, diagnostics, water management, power converter, impedance spectroscopy
I. INTRODUCTION
Cost and reliability are two key aspects that still hinder a massive-scale market diffusion of fuel cell (FC) technology. For this reason, the development of low-cost diagnostic tools and control systems able to guarantee a reliable long-term FC operation appears as a primary objective to be pursued in the next years.
In particular, for polymer electrolyte membrane (PEM) FCs, a continuous monitoring of the cell water content would be extremely important, as it deeply affects the FC efficiency, voltage stability and lifetime. Indeed, an excessively low water content in the FC membrane causes an increase of ohmic losses and possible membrane damage, while too much water can lead to flooding of the gas channels and of the porous catalyst and gas diffusion layers, which in turn causes again a reduction in power output [1], [2]. Electrochemical impedance spectroscopy (EIS) is well known to be a powerful technique to identify performance degradation induced by different phenomena, among which membrane drying and cell flooding [3]–[7], but its typical use in laboratory tests envis-ages dedicated instrumentation, whose cost and complexity make it not suitable for low-cost commercial applications.
G. Dotelli, P. Gallo Stampino and S. Latorrata are with the Department of Chemistry, Materials, and Chemical Engineering “G. Natta”, Politec-nico di Milano, 20133 Milano, Italy (e-mail: giovanni.dotelli@polimi.it; paola.gallo@polimi.it; saverio.latorrata@polimi.it).
R. Ferrero is with the Department of Electrical Engineering and Electronics, University of Liverpool, Liverpool L69 3GJ, UK (e-mail: Roberto.Ferrero@liverpool.ac.uk).
S. Toscani is with the Dipartimento di Elettronica, Informazione e Bioingegneria, Politecnico di Milano, 20133 Milano, Italy (e-mail: ser-gio.toscani@polimi.it).
As a partial solution for this problem, for what concerns the dehydration diagnosis, a few works in literature suggested the use of the current ripple produced by switch-mode power converters to measure the FC equivalent ohmic resistance, which is a good indicator for the membrane water content [8]–[10]. Indeed, the converter switching acts as a perturbation allowing to acquire the FC frequency response at the ripple frequencies, which are typically in the kilohertz range where the cell impedance practically reduces to the ohmic resistance. In [11], the authors tested this diagnostic approach with a DC/DC boost converter connected to a single PEM FC, show-ing that quite accurate measurements of the ohmic resistance can be obtained if suitable model-based elaboration algorithms are employed, taking into account the non-sinusoidal nature of the ripple and the not completely resistive behavior of the FC. Starting from this result, this paper aims at showing how an ad hocswitching control of the converter allows to introduce low-frequency components in the ripple waveform that can be used to estimate the FC low-frequency impedance, suitable for flooding diagnosis, so that both opposite failure modes associated with water management can be detected from the converter ripple alone. Similar techniques have been already successfully employed in different applications, such as elec-trical machines [12]–[14], but to the authors’ best knowledge its application to FCs for flooding diagnosis has not been investigated yet.
Low-frequency measurements on PEM FCs present par-ticular challenges that need to be addressed for a reliable diagnosis, also discussed in this paper. Firstly, the complex electrochemical processes occurring within the cell give rise to continuous oscillations in the output voltage, preventing from obtaining accurate low-frequency impedance measurements, particularly in flooded conditions. Secondly, different FC operation modes (e.g., constant current, constant voltage or constant power) produce different responses to performance degradations due to drying or flooding, which may affect the sensitivity required to the diagnostic algorithm to correctly recognize these two failure modes. To deal with these issues, suitable measurement techniques and diagnostic algorithms need to be developed.
II. FC DRYING ANDFLOODING
+
−
Rohm Ract Rtrans
Ctrans
Cact(jω)
E v
[image:2.612.61.286.56.154.2]i Ls
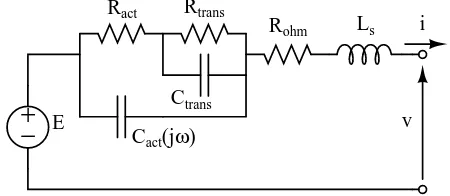
Fig. 1. Typical linearized equivalent circuit of a PEM FC.
linear equivalent circuit shown in Fig. 1 often results to be adequate to describe the FC behavior around a stable operating point. The three equivalent resistances are associated with the three causes of voltage drop mentioned above, while the two equivalent capacitances describe the dynamic response of activation and transport phenomena. A frequency-dependent capacitance Cact(jω) [15] or a constant-phase element CPE
instead of it [6] are usually required for a better fit of the actual FC response. Finally, a series inductance has been added to take into account inductive phenomena that are likely to appear at high frequencies, mainly due to the FC electrical connections. It is worth noting that all the equivalent electrical parameters associated with activation and transport processes are strongly dependent on the FC working point, as better explained in the next sections.
As far as water management is concerned, membrane dehy-dration produces a decrease of the membrane ionic conductiv-ity and therefore an increase of the equivalent ohmic resistance Rohm, while cell flooding due to water accumulation in the
gas channels and/or in the gas diffusion layer hinders the gas transport and therefore it produces an increase of the equiv-alent transport resistance Rtrans, as well as of the equivalent
capacitance Ctrans. For this reason, a combined monitoring
of the ohmic resistance and the low-frequency impedance (sensitive to the transport resistance), by acquiring either the whole spectrum [4]–[6] or single-frequency impedances [7], is generally considered as an effective approach to detect both drying and flooding occurrences and to distinguish between them.
While it is known that ohmic resistance measurements can be inexpensively obtained by exploiting the high-frequency ripple of switch-mode converters, as mentioned in the previous section, lower-frequency measurements are usually performed by dedicated and more sophisticated instrumentation, such as frequency response analyzers, that cannot be afforded in commercial applications. The high complexity and cost of such instrumentation arise not only from the need to generate perturbation signals over a wide range of frequencies, but also from the requirement of accurate measurements with low-amplitude signals because of the non-linear FC response appearing at low frequencies.
Alternative solutions for flooding diagnosis involving non-electrical quantities have been studied to overcome this prob-lem, among which the simplest one from the implementation point of view is based on gas pressure drop measurements between inlet and outlet gas channels [16], [17]. However,
although pressure measurements are very useful to detect flooding in its first stage, the relationship between pressure drop and FC electrical performance is not straightforward [18]. Thus, the impedance should be always measured in addition to pressure for a more reliable diagnosis.
The following sections will explain how both low-frequency and high-frequency impedance measurements with satisfying accuracy can be performed by exploiting the ripple produced by a switch-mode power converter connected to the FC, without need of additional expensive instrumentation.
III. INJECTION OFLOW ANDHIGHFREQUENCY
COMPONENTS
Switch-mode converters are usually employed to connect FCs to their loads, or to integrate them with other energy sources in hybrid power systems. Since the applications are extremely heterogeneous, a great variety of power electronics architectures can be found in both industrial products and literature [19].
The power electronics converters have to be controlled in order to ensure proper FC operation, and of course deliver the required power to the load. In stand-alone applications [20], [21], neglecting the losses, FC power output should match the load power. Since FC time constants are fairly slow, in presence of fast perturbations the power converter should adjust the operating point on the V-I curve in order to ensure power balance. This architecture cannot be employed when the load profile contains large and fast power variations. In this case, an hybrid FC system is generally employed: other power sources or energy storage systems are introduced, so that the dynamic characteristics are greatly improved, the peak power output is also enhanced while the FC operates in almost stationary conditions. Generally, the switch-mode power con-verter connected to the FC controls its current [22]. However, in some architectures, known as direct parallel structures, the auxiliary power sources and the load are interfaced to a DC bus by means of proper power converters, while the FC is directly connected to the DC bus [23]. Since the DC bus voltage is controlled, in this case the FC operates at constant voltage.
The voltage or current controller can be employed to introduce low-frequency perturbations in the FC current or voltage waveforms, respectively, superimposed to the DC ref-erence values. If properly chosen, such perturbations permit to monitor the low-frequency impedance of the FC, which can be used to detect flooding occurrence. Of course, these additional perturbations increase power losses, thus it is necessary to keep their amplitudes as low as possible, also because the FC low-frequency response is not linear and therefore impedance measurements require low-amplitude signals.
FC
io i
i
vo i
v T Co
D i
L
[image:3.612.53.301.64.136.2]load
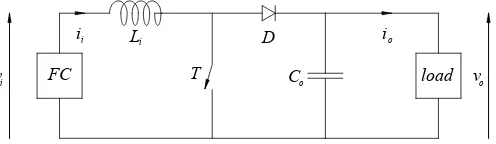
Fig. 2. Schematic representation of a DC/DC boost converter connected to the FC on one side and to an electrical load on the other side.
their DC values. Therefore, it can be exploited to measure the high-frequency part of the cell impedance spectrum. Consider-ing the equivalent circuit of Fig. 1, the transport dynamics as well as the frequency dependence of the activation capacitance Cact(jω) can be neglected, so that either a first-order RC
or RL circuit adequately describes the FC response at the main ripple frequencies, depending on the converter switching frequency and on the cut-off frequencies of the equivalent circuit. In both cases, fitting the available impedance data with the proper first-order model provides accurate estimates of the ohmic resistanceRohm that can be used for membrane drying
diagnosis [11], as shown in Sec. VII.
IV. DESIGN OF THEFC CONVERTER
In order to test the proposed diagnostic method based on the injection of low- and high-frequency components, a case study has been chosen. In particular, the FC is connected to the load by means of a PWM-controlled boost DC/DC converter. Beside its simplicity, it is frequently employed in FC applications, and its architecture is depicted in Fig. 2.
Let us introduce the duty cycle δ as the fraction of the switching period when the switch T is turned on. Assuming that the duty cycle changes slowly, the power converter in-troduces spectral components in the cell current and voltage whose frequencies are multiple of the switching frequency fsw. When considering the continuous conduction mode and neglecting the losses, the relationship between the input and output voltages (Vi andVo respectively) is given by:
Vo= Vi
1−δ (1)
The choice of the reactive components (input inductor and output capacitor) depends on the FC working point (input current and voltage), the desired ripple amplitudes of the input current (∆Ii) and output voltage (∆Vo), respectively, and the converter switching frequency fsw and duty cycleδ. In particular, the peak-to-peak amplitude of the input current ripple is given by the well-known formula for the boost converter:
∆Ii= Vi fswLi
δ (2)
while the peak-to-peak amplitude of the output voltage can be computed as:
∆Vo=
(1−δ)δ Cofsw
Ii (3)
assuming that the entire ripple in the output current flows through the capacitor.
Limiting the amplitude of the current ripple is vital for FC applications. Several papers in literature have investigated the negative effects that current ripple might produce on a FC, such as loss increase, possible damages and durability decrease [15], [24]–[27], but a complete understanding of all these phenomena has not been achieved yet, and therefore a generally-accepted indication of the maximum allowed ripple is presently not available. Nevertheless, a reasonable ripple amplitude which can be considered to have a negligible effect on both the FC operation and lifetime is 5% peak-to-peak of the rated current.
With these assumptions, considering the 20 A rated current of the cell employed for the experimental tests (corresponding to a cell voltage of about 0.5 V in nominal conditions) and a switching frequency of 10 kHz, the input inductance results Li = 50µH, in the most conservative condition which occurs forδ = 1. On the other hand, accepting a peak-to-peak ripple not greater than 0.1 V in the output voltage, the required output capacitance Co results to be 5 mF calculated in the most conservative condition, nowδ= 0.5.
V. SWITCHINGCONTROLSTRATEGY
As previously explained in Sec. III, switch-mode converters can be controlled so as to inject a low-frequency perturbation in the FC current or voltage. This perturbation signal can be properly designed in order to allow an effective flooding detec-tion. It is known that flooding affects the transport dynamics and therefore it causes an increase of the equivalent transport resistanceRtrans. The highest sensitivity of the FC impedance
with respect to this parameter is achieved at the limit low frequency of the impedance spectrum, where the impedance equals the sum of all resistances (Rohm +Ract+Rtrans).
Unfortunately, this limit frequency is quite low, typically below 1 Hz and in flooded conditions it becomes even lower because of the increase of both Rtrans andCtrans. Thus, a frequency
lower than 100 mHz would be required for this measurement, while it is known that it is practically impossible to perform accurate measurements at such frequencies, particularly in flooded conditions, because of instabilities in the FC internal state.
optimized in order to minimize the peak-to-rms ratio, often known as crest factor. In this way, the power of the signal (and therefore the accuracy of the measurements) is enhanced for a given peak-to-peak amplitude of the perturbation. A 0.2 A peak-to-peak amplitude of the current oscillation was chosen, so that it is about 40% of the high-frequency ripple amplitude. The corresponding amplitude of the voltage oscillation in controlled voltage operation was then calculated based on the expected low-frequency impedance in nominal conditions.
The boost converter can impose either the FC voltage or current. A simple integral controller is employed, and it has been tuned so that the cut-off frequency of the loop is 400 Hz when operating with a duty cycle of 0.7. Therefore, the waveforms of both the current and voltage perturbations can be accurately applied to the FC.
VI. EXPERIMENTALSETUP
The FC employed for the experimental tests is a single PEM cell composed of commercial materials, in particular a Nafion®
212 membrane as electrolyte (23-cm2 active area and 50-µm thickness) and a gas diffusion electrode reference sample (E-TEK LT140). The cell is fed with pure hydrogen and air at the anode and cathode, respectively, whose flow rates are measured and controlled by calibrated flow meters. Both inlet gases are humidified through saturators, whose temperatures are controlled to achieve the desired relative humidity. Finally, the cell temperature is kept constant at 60 °C.
A photograph and a block diagram of the whole experi-mental setup are shown in Figs. 3 and 4, respectively. The cell is directly connected to the DC/DC converter, whose output is in turn connected to a resistive load. The inductor visible in Fig. 3 is a 50 µH input inductance designed for 10 kHz switching frequency, while if the converter is operated with a lower switching frequency, a larger inductance value is required to maintain the input current ripple within the design specifications. The control of the electronic switch, according to the strategy described in the previous section, is provided by a reconfigurable input/output system (NI Compact-RIO 9014), where the control algorithm is implemented in the internal Xilinx Virtex-II 3-million-gate FPGA to guarantee real-time operation. The cell current measurement is provided by a Hall effect current probe with 100 kHz bandwidth (Fluke i30s), whose voltage output is acquired by the Compact-RIO 16-bit analog input module (NI 9215) together with the cell voltage, with 105 samples-per-second sampling frequency (a four-terminal measurement is performed to avoid the effects of contact resistances). These two signals are also acquired by a 16-bit data acquisition (DAQ) system (NI 6251) synchronized with the Compact-RIO, with a higher sampling frequency (2.5·105 samples per second), more suitable for the signal
processing required for diagnostics.
It is worth noting that for the implementation in a com-mercial application, most of the above-mentioned hardware would be replaced by the devices already present in the original application design, including the DC/DC converter, its controller and in some cases also a suitable current transducer and a data acquisition system, thus dramatically reducing the
fuel cell
resistors DAQ board and
Compact-RIO flow and temperature controllers
DC/DC converter inductor
[image:4.612.323.550.53.197.2]current probe
Fig. 3. Photograph of the experimental setup.
DAQ PC
imeas
+ i
v Fuel
Cell C-RIO
vcontr
Fig. 4. Block diagram of the experimental setup.
implementation costs of the proposed technique. Even when a current transducer, a data acquisition system and a proper processing unit have to be specifically added, the cost of this system is likely to be at least one order of magnitude lower than laboratory impedance measurement systems based on frequency response analyzers.
VII. IMPEDANCEMEASUREMENTS
First tests in stationary conditions were carried out to illustrate the proposed procedure to estimate the FC ohmic resistance and low-frequency limit resistance from the high-and low-frequency ripple components, respectively, by means of proper fitting of the available impedance data at different frequencies. For these tests, the cell was operated at a medium-level DC current of 13 A, with fully humidified inlet gases and nominal flow rates (0.2 Nl/min for hydrogen and 1.0 Nl/min for air). The load was adjusted to make the converter operate with a duty cycle around 0.7.
A. Ohmic Resistance
[image:4.612.324.539.230.331.2]0.644 0.645 0.646
Voltage waveform
v [V]
0 1 2 3 4
12.8 13 13.2
Current waveform
t [ms]
i [A]
−100 −80 −60
Voltage spectrum
h. ampl. /
VDC
[dB]
0 2 4 6 8 10 −80
−60 −40
Current spectrum
f [kHz]
h. ampl. /
I DC
[image:5.612.61.285.56.225.2][dB]
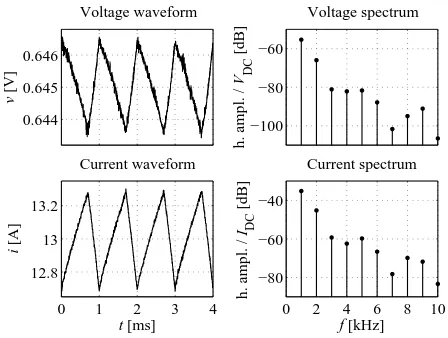
Fig. 5. Measured high-frequency FC voltage and current ripple and their Fourier spectra, obtained with 1 kHz switching frequency and 0.7 duty cycle.
0.644 0.645 0.646
Voltage waveform
v [V]
0 0.1 0.2 0.3 0.4 12.8
13 13.2
Current waveform
t [ms]
i [A]
−100 −80 −60
Voltage spectrum
h. ampl. /
V DC
[dB]
0 20 40 60 80 100 −80
−60 −40
Current spectrum
f [kHz]
h. ampl. /
I DC
[image:5.612.322.546.63.195.2][dB]
Fig. 6. Measured high-frequency FC voltage and current ripple and their Fourier spectra, obtained with 10 kHz switching frequency and 0.7 duty cycle.
The measured cell voltage and current waveforms with the two switching frequencies are reported in Figs. 5 and 6, respec-tively, together with their Fourier spectra. For the impedance evaluation in both tests, the voltage and current spectra were calculated on a time window corresponding to 50 switching periods and averaged over a time window of 1 s, where the cell impedance is not expected to significantly change. The impedance spectrum was then calculated as complex ratio between these voltage and current spectra. While the mean value of the measurements provides the best estimate of the cell impedance, their standard deviation provides an estimate of the associated uncertainty mainly due to uncontrollable variations of the FC internal conditions, that can be used for a weighted least-squares fitting. This so-called type-A uncertainty is typically greater than the type-B uncertainty contribution arising from the instrumentation accuracy, there-fore it should be regarded as the best uncertainty estimate, particularly when it has to be employed to correctly recognize impedance variations due to faults, as in this application.
As far as the operation with 1 kHz switching frequency is concerned, the impedances associated with the first five
3.6 3.8 4 4.2 4.4 4.6 4.8 5 5.2 5.4 0
0.2 0.4 0.6 0.8 1
Real(Z) [mΩ]
−Imag(
Z
) [m
Ω
] 1 kHz
2 kHz
4 kHz 5 kHz
3 kHz
Fig. 7. High-frequency impedance measurements (crosses) and their standard deviations (circles) in a 1-s time interval, obtained with 1 kHz switching frequency, compared with the best fit according to model (4) (dashed line and dots).
3.6 3.8 4 4.2 4.4 4.6 4.8 5 5.2 5.4 Real(Z) [mΩ]
40 kHz
10 kHz 50 kHz
[image:5.612.338.546.265.400.2]20 kHz
Fig. 8. Real parts of the high-frequency impedance measurements (crosses) and their standard deviations (bars) in a 1-s time interval, obtained with 10 kHz switching frequency, compared with the best estimate ofRohm(dashed line).
harmonic components (which are the most significant ones, see Fig. 5), measured in a 1 s time interval, are shown in Fig. 7 (mean values and standard deviation circles) together with the best fit with a first-order RC model:
Z(jω) =Rohm+
Ract 1 +jωRactCact
(4)
The compatibility between model and experimental data at all considered frequencies confirms the model validity for the purposes of this work, meaning that no significant definitional uncertainty is added to the uncertainty estimate of the equiv-alent ohmic resistance.
On the other hand, with 10 kHz switching frequency, the cell response is better described by a first-order RL model:
Z(jω) =Rohm+jωLs (5)
In this case, the ohmic resistance can be estimated considering only the real parts of the impedances, shown in Fig. 8 for the most significant frequencies (that for this test are only the 1st, 2nd,4th and5th harmonic components, see Fig. 6). Again, the estimated ohmic resistance is compatible with the measurement results at all considered frequencies.
The slightly different values ofRohmestimated in Fig. 7 and
[image:5.612.62.284.274.440.2]variations of the cell internal conditions [28] and they are in agreement with the type-A uncertainty estimated from repeated measurements, which is less than 0.2 mΩ in both cases. This uncertainty level defines the sensitivity of the proposed measurement method for drying diagnosis, as only ohmic resistance variations greater than this threshold can be considered as significant and thus associated with non-proper FC operation. This level is low enough to allow an effective detection of membrane dehydration in the cell under test, which is likely to produce Rohm variations of 1 mΩor more
[10].
Finally, it should be noted that the cell temperature here is kept constant, while in some commercial applications the FC stack is self-heated, without any temperature controller. When this occurs, the ohmic resistance may also vary as a consequence of temperature variations and this must be taken into account to correctly distinguish the resistance variations associated with the membrane humidification. Usually, if the cell temperature is measured, the effects of temperature can be compensated by assuming a linear relationship between temperature and membrane conductivity in the operating tem-perature range. As an example, for the cell under test, the increase of the ohmic conductance (i.e. the inverse of the ohmic resistance) with temperature is about 1.5 S/°C, with a nominal conductance value of about 200 S at 60 °C.
B. Low-frequency Resistance
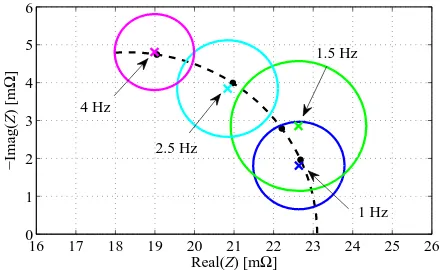
Similarly to what done for the ohmic resistance, also the low-frequency limit resistance is estimated by fitting the four impedance measurements obtained by introducing low-frequency perturbations in the ripple waveform as described in Sec. V. Again, a first-order RC model is employed for data fitting:
Z(jω) =Rohm+Ract+
Rtrans 1 +jωRtransCtrans
(6)
The measured voltage and current waveforms in a one-period window, obtained with the converter operating in current-control mode, are reported in Fig. 9 together with their Fourier spectra, having filtered the high-frequency ripple. For the resistance identification, the spectra were averaged over a time window of 20 s, in order to calculate their mean value and standard deviation. These values are reported in Fig. 10 together with the weighted least-squares fit, showing also in this case compatibility between model and experimental data. The same considerations for the uncertainty evaluation reported above apply also to the low-frequency resistance, whose uncertainty is estimated to be about 1 mΩin these ex-perimental conditions, while the expected resistance variations in case of flooding are one order of magnitude higher.
VIII. FAULTDETECTION
As already explained, the high- and low-frequency resis-tance measurements described above are intended to be used to detect FC performance degradation due to membrane drying or cell flooding. The use of the ohmic resistance measurement for drying diagnosis has been already widely discussed in
0.62 0.622 0.624 0.626
Voltage waveform
v [V]
0 0.5 1 1.5 2 12.9
13 13.1
Current waveform
t [s]
i [A]
−120 −100 −80 −60 −40
Voltage spectrum
h. ampl. /
V DC
[dB]
0 1 2 3 4 5
−120 −100 −80 −60 −40
Current spectrum
f [Hz]
h. ampl. /
I DC
[image:6.612.319.545.56.225.2][dB]
Fig. 9. Measured low-frequency FC voltage and current ripple introduced by the converter in current-control mode, and their Fourier spectra.
16 17 18 19 20 21 22 23 24 25 26 0
1 2 3 4 5 6
Real(Z) [mΩ]
−Imag(
Z
) [m
Ω
]
1 Hz 4 Hz
2.5 Hz
1.5 Hz
Fig. 10. Impedance measurements (crosses) and their standard deviations (circles) in a 20-s time interval, obtained from the low-frequency ripple, compared with the best fit according to model (6) (dashed line and dots).
literature, and results obtained on the cell under test were already presented by the authors in [10]. On the other hand, low-frequency measurements for flooding diagnosis require a deeper discussion, because the low-frequency impedance not only depends on the cell water content, but also on the working point (i.e., the cell DC current). This means that the converter control strategy defining the FC operation mode (e.g. constant current, constant voltage or constant power) affects the impedance variations seen as a consequence of flooding events, and this should be taken into account in the flooding diagnosis.
To better illustrate this phenomenon in reproducible experi-mental conditions, mass transport was hindered by decreasing the inlet gas flow rates instead of by increasing the gas relative humidity. This procedure is commonly employed in literature to emulate flooding transients [4], [5], [7], being the effect on the mass transport dynamics very similar, as in both cases fuel and oxygen starvation arises. The advantage of this choice is that the experimental conditions are better controllable and results show a much higher reproducibility.
[image:6.612.327.547.277.412.2]0 2 4 6 8 10 12 14 16 18 0.3
0.4 0.5 0.6 0.7 0.8 0.9 1
i [A]
v [V]
Fig. 11. FC polarization curves measured with nominal gas flow rates (upper black curve) and decreased flow rates (lower red curve), with 85% gas relative humidity; the selected working point (IDC= 16.1 A) is shown with a black dot and the effects of constant-current and constant-voltage controls are illustrated.
with 85% gas relative humidity, are reported in Fig. 11. As expected, the lower flow rates limit the cell performances at high currents, where the fuel and oxygen consumption is higher. For the tests, a DC current of 16.1 A was chosen, corresponding to 0.7 A/cm2. The effects of constant-current and constant-voltage controls when moving from the nominal curve to the lower curve are also illustrated in Fig. 11. Clearly, the former enhances the effects of gas starvation, while the latter has a stabilizing effect, making the cell work at lower current, where the difference between the two polarization curves is much smaller. If a constant-power control were implemented, its effect would be to make the cell operate at higher current, thus enhancing the effect of gas starvation even more. This is not illustrated in Fig. 11 because the maximum power of the lower curve is smaller than the power of the selected working point on the nominal curve.
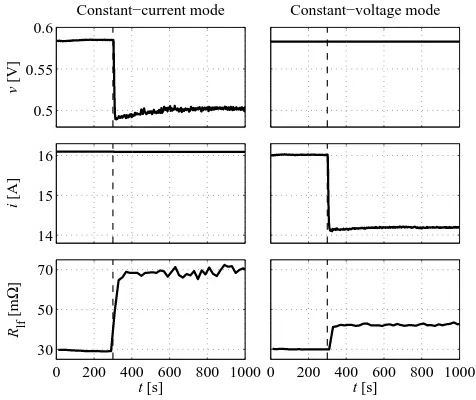
The cell response to a step variation of the gas flow rates from the nominal ones (corresponding to stoichiometric ratios λ= 1.8 andλ= 3.7 at anode and cathode, respectively) to the decreased values (corresponding to λ = 1.2 and λ = 2.0) is reported in Fig. 12, for the two cases of constant-current and constant-voltage operation modes. The flow rate variation is produced at t= 300 s, immediately followed by a voltage or current variation according to Fig. 11. The ohmic resistance does not show significant variations, therefore it is not reported in Fig. 12. On the contrary, the low-frequency resistance significantly increases as expected. It is worth noting that the resistance increase in constant-current mode is more than 3 times greater than in constant-voltage mode. This has two important implications from the flooding diagnosis point of view. Firstly, the detection of impedance variations in constant-voltage mode requires a higher sensitivity. Secondly, the eval-uation of the extent of flooding from impedance measurements needs to take into account the operation mode chosen for the cell.
IX. CONCLUSIONS
A DC/DC boost converter for a single PEM FC was designed and built, in order to test the possibility to use the
0.5 0.55 0.6
Constant−current mode
v [V]
Constant−voltage mode
14 15 16
i [A]
0 200 400 600 800 1000 30
50 70
t [s]
R lf
[m
Ω
]
0 200 400 600 800 1000
[image:7.612.317.555.56.256.2]t [s]
Fig. 12. Effects of a gas flow rate step variation from 0.20 Nl/min and 1.00 Nl/min for hydrogen and air, respectively, to 0.14 Nl/min and 0.53 Nl/min, in constant-current and constant-voltage operation modes; the cell voltage (upper plots), current (central plots) and low-frequency limit resistance (lower plots) are reported in the two cases.
current ripple produced by the converter for low-cost state-of-health diagnosis, suitable for commercial applications. In particular, the high-frequency ripple inherently produced by the converter allows to measure the equivalent ohmic resis-tance, useful as an indicator for membrane dehydration, while the introduction of ad hoc low-frequency perturbations by properly acting on the switching control allows to measure also the low-frequency impedance, suitable to detect cell flooding as well as other phenomena affecting the mass transport dynamics.
Accurate estimates of both the ohmic resistance and the low-frequency limit resistance were obtained by using elaboration algorithms based on simple equivalent circuits that take into account the non-sinusoidal nature of the ripple and the reactive behavior of the FC. The sensitivity required for low-frequency resistance measurements is discussed considering the effects of different control strategies of the converter defining different operation modes of the cell, such as constant-current and constant-voltage operations.
Experimental tests performed on a single cell confirmed the validity of the proposed approach and encourage further developments towards its application to commercial devices, involving stacks of several cells connected in series. In this case, depending on the stack size and on the available data acquisition system, the voltages of single cells or small groups of cells can be acquired by using a multiplexed architecture (thus without significantly increasing the acquisition system complexity and cost), thanks to the slow cell dynamics with respect to the injected perturbations.
REFERENCES
[image:7.612.62.286.61.197.2][2] N. Yousfi-Steiner, P. Moc¸ot´eguy, D. Candusso, D. Hissel, A. Hernandez and A. Aslanides, “A review on PEM voltage degradation associated with water management: Impacts, influent factors and characterization”,
Journal of Power Sources, vol. 183, pp. 260-274, 2008.
[3] X. Yuan, H. Wang, J. C. Sun and J. Zhang, “AC impedance technique in PEM fuel cell diagnosis - A review”,Int. Journal of Hydrogen Energy, vol. 32, pp. 4365-4380, 2007.
[4] J. M. Le Canut, R. M. Abouatallah and D. A. Harrington, “Detection of membrane drying, fuel cell flooding, and anode catalyst poisoning on PEMFC stacks by electrochemical impedance spectroscopy”,Journal of
the Electrochemical Society, vol. 153, no. 5, pp. A857-A864, 2006.
[5] W. M´erida, D. A. Harrington, J. M. Le Canut and G. McLean, “Charac-terisation of proton exchange membrane fuel cell (PEMFC) failures via electrochemical impedance spectroscopy”,Journal of Power Sources, vol. 161, pp. 264-274, 2006.
[6] N. Fouquet, C. Doulet, C. Nouillant, G. Dauphin-Tanguy and B. Ould-Bouamama, “Model based PEM fuel cell state-of-health monitoring via ac impedance measurements”,Journal of Power Sources, vol. 159, pp. 905-913, 2006.
[7] T. Kurz, A. Hakenjos, J. Kr¨amer, M. Zedda and C. Agert, “An impedance-based predictive control strategy for the state-of-health of PEM fuel cell stacks”,Journal of Power Sources, vol. 180, pp. 742-747, 2008. [8] M. F. Mathias and S. A. Grot, “System and method for controlling the
humidity level of a fuel cell”,US Patent6,376,111, 2002.
[9] M. Hinaje, I. Sadli, J. P. Martin, P. Thounthong, S. Ra¨el and B. Davat, “Online humidification diagnosis of a PEMFC using a static DC-DC converter”, Int. Journal of Hydrogen Energy, vol. 34, pp. 2718-2723, 2009.
[10] G. Dotelli, R. Ferrero, P. Gallo Stampino, S. Latorrata and S. Toscani, “Diagnosis of PEM fuel cell drying and flooding based on power converter ripple”,IEEE Trans. on Instrumentation and Measurement, vol. 63, no. 10, pp. 2341-2348, 2014.
[11] G. Dotelli, R. Ferrero, P. Gallo Stampino, S. Latorrata and S. Toscani, “Testing of a diagnostic technique for a single PEM fuel cell based on a DC/DC converter”,Proc. of IEEE AMPS 2014, Aachen, Germany, Sep. 24-26, 2014, pp. 138-142.
[12] S. L. Ho and K. W. E. Cheng, “Condition monitoring of rotor faults in induction motors by injection of low frequency signals into the supply”,
Proc. of Power Electronics and Variable Speed Drives, Sorrento, Italy,
Sep. 21-23, 1998, pp. 200-205.
[13] C. Demian, A. Mpanda-Mabwe, H. Henao and G. A. Capolino, “De-tection of induction machines rotor faults at standstill using signals injection”,IEEE Trans. on Industry Applications, vol. 40, no. 6, pp. 1550-1559, 2004.
[14] F. Briz, M. W. Degner, A. B. Diez and J. M. Guerrero, “Online di-agnostics in inverter-fed induction machines using high-frequency signal injection”,IEEE Trans. on Industry Applications, vol. 40, no. 4, pp. 1153-1161, 2004.
[15] R. Ferrero, M. Marracci, M. Prioli and B. Tellini, “Simplified model for evaluating ripple effects on commercial PEM fuel cell”,Int. Journal of
Hydrogen Energy, vol. 37, pp. 13462-13469, 2012.
[16] W. He, G. Lin and T. V. Nguyen, “Diagnostic tool to detect electrode flooding in proton-exchange-membrane fuel cells”,AIChE Journal, vol. 49, no. 12, pp. 3221-3228, 2003.
[17] F. Barbir, H. Gorgun and X. Wang, “Relationship between pressure drop and cell resistance as a diagnostic tool for PEM fuel cells”,Journal of
Power Sources, vol. 141, pp. 96-101, 2005.
[18] G. Dotelli, R. Ferrero, P. Gallo Stampino, S. Latorrata and S. Toscani, “Comparison between electrical and pressure measurements to detect PEM fuel cell flooding”, to be published inProc. of IEEE I2MTC 2015,
Pisa, Italy, May 11-14, 2015.
[19] X. Yu, M. R. Starke, L. M. Tolbert and B. Ozpineci, “Fuel cell power conditioning for electric power applications: a summary”,IET Electric
Power Applications, vol. 1, no. 5, pp. 643-656, 2007.
[20] M. Y. El-Sharkh, A. Rahman, M. S. Alam, P. C. Byrne, A. A. Sakla and T. Thomas, “A dynamic model for a stand-alone PEM fuel cell power plant for residential applications”,Journal of Power Sources, vol. 138, pp. 199-204, 2004.
[21] A. Benaissa, B. Rabhi, A. Moussi and D. Aissa, “A linear quadratic regulator control of a stand-alone PEM fuel cell power plant”,Frontiers
in Energy, vol. 8, no. 1, pp. 62-72, 2014.
[22] P. Thounthong, S. Ra¨el and B. Davat, “Energy management of fuel cell/battery/supercapacitor hybrid power source for vehicle applications”,
Journal of Power Sources, vol. 193, pp. 376-385, 2009.
[23] T. Azib, O. Bethoux, G. Remy, C. Marchand and E. Berthelot, “An innovative control strategy of a single converter for hybrid fuel
cell/supercapacitor power source”,IEEE Trans. on Industrial Electronics, vol. 57, no. 12, pp. 4024-4031, 2010.
[24] R. S. Gemmen, “Analysis for the effect of inverter ripple current on fuel cell operating condition”,Journal of Fluids Engineering, vol. 125, pp. 576-585, 2003.
[25] W. Choi, J. W. Howze and P. Enjeti, “Development of an equivalent circuit model of a fuel cell to evaluate the effects of inverter ripple current”,Journal of Power Sources, vol. 158, pp. 1324-1332, 2006. [26] B. Wahdame, L. Girardot, D. Hissel, F. Harel, X. Franc¸ois, D. Candusso,
M. C. P´era and L. Dumercy, “Impact of power converter current ripple on the durability of a fuel cell stack”,Proc. of IEEE ISIE 2008, Cambridge, UK, Jun. 30 - Jul. 2, 2008, pp. 1495-1500.
[27] R. Ferrero, M. Marracci and B. Tellini, “Single PEM fuel cell analysis for the evaluation of current ripple effects”,IEEE Trans. on
Instrumen-tation and Measurement, vol. 62, no. 5, pp. 1058-1064, 2013.