Timpson review of
school exclusion:
technical note
May 2019
2
Contents
List of figures 4
List of tables 6
Accompanying Tables 7
1. Background 10
Existing data and analysis on exclusions 10
New data and analysis 10
2. Exploratory analysis 12
Number of exclusions 12
Duration of exclusion 13
When exclusions occur 13
Exclusion rates by pupil characteristics 17
Gender 17
Ethnicity 18
Special Educational Needs (SEN) 19
Children in need status 21
Free school meal eligibility 23
Type of school attended 24
Key Stage 4 outcomes for excluded pupils 25
3. Factors associated with exclusion 27
Pupil characteristics 29
Disadvantage 29
Special Educational Needs 30
Ethnicity 32
Other pupil factors 35
School characteristics 36
School type 36
Region 37
Other school factors 38
3
Overview 40
Information about the pupil 41
School Census data 41
Special educational needs 42
Exclusions data 44
Absence data 45
Information about the school the pupil was attending 45 Annex B: Logistic regression detailed methodology and full results 47
Methodology 47
SEN status 48
Control variables 48
Variables 52
Full results 53
Pupil characteristics models for odds of permanent exclusion 54 Pupil characteristics models for odds of fixed exclusion 57 School characteristics models for odds of permanent exclusion 60 School characteristics models for odds of fixed exclusion 63
4
List of figures
Figure 1: Termly permanent exclusion rate throughout secondary phase, for 3 cohorts of pupils: those entering Year 11 in 2016/17, 2015/16 and 2014/15 14 Figure 2: Termly fixed period exclusion rate throughout secondary phase, for 3 cohorts of pupils: those entering Year 11 in 2016/17, 2015/16 and 2014/15 15 Figure 3: Termly permanent exclusion rate throughout secondary phase, for 3 cohorts of pupils (those entering Year 11 in 2016/17, 2015/16 and 2014/15) by gender 17 Figure 4: Termly permanent exclusion rate throughout secondary phase, for 3 cohorts of pupils (those entering Year 11 in 2016/17, 2015/16 and 2014/15) by minor ethnic group
18 Figure 5: Termly permanent exclusion rate throughout secondary phase, for 3 cohorts of pupils (those entering Year 11 in 2016/17, 2015/16 and 2014/15) by SEN status 19 Figure 6: Termly permanent exclusion rate throughout secondary phase, for 3 cohorts of pupils with SEN without EHC plan/ statement (those entering Year 11 in 2016/17,
2015/16 and 2014/15) by primary type of SEN 20
Figure 7: Termly permanent exclusion rate throughout secondary phase, for 3 cohorts of pupils with statement/ EHC plan (those entering Year 11 in 2016/17, 2015/16 and
2014/15), by primary type of SEN 20
Figure 8: Termly permanent exclusion rate throughout secondary phase, for 3 cohorts of pupils (those entering Year 11 in 2016/17, 2015/16 and 2014/15) by children in need
status 22
Figure 9: Termly permanent exclusion rate throughout secondary phase, for 3 cohorts of pupils (those entering Year 11 in 2016/17, 2015/16 and 2014/15) by free school meal
eligibility 23
Figure 10: Termly permanent exclusion rate throughout secondary phase, for 3 cohorts of pupils (those entering Year 11 in 2016/17, 2015/16 and 2014/15) by type of school
attended 24
Figure 11: Attainment at the end of Key Stage 4 by exclusion group, for pupils reaching
end of Key Stage 4 in 2015/16 26
5
Figure 13: Odds ratios for permanent exclusions by SEN status (comparison group: no
SEN) 30
Figure 14: Odds ratios for fixed period exclusions by SEN status (comparison group: no
SEN) 31
Figure 15: Odds ratios for permanent exclusions comparing BAME and non-BAME
(comparison group: White British) 32
Figure 16: Odds ratios for permanent exclusions by ethnicity (comparison group: White
British) 33
Figure 17: Odds ratios for fixed period exclusions by ethnicity (comparison group: White
British) 33
Figure 18: Odds ratios for permanent and fixed period exclusions by other pupil factors (comparison groups: one standard deviation lower average KS2 results, not EAL, one standard deviation lower number of schools attended in the last nine months, one
standard deviation lower percentage of sessions missed due to absence). 35 Figure 19: Odds ratios for permanent and fixed period exclusions by school type
(comparison group: LA maintained schools) 36
Figure 20: Odds ratios for permanent and fixed period exclusions by region (comparison
groups: London, rural) 37
6
List of tables
Table A: Number of fixed period exclusions received 12
Table B: Number of half-day sessions missed 13
Table C: Characteristics of excluded pupils 16
Table D: Categorisation of SEN primary need 43
Table E: Categorisation of school types 45
Table F: Reported risky behaviours split by reported truancy 49 Table G: Reported misbehaviour in class split by reported truancy 49 Table H: Additional support due to young person’s behaviour split by reported truancy 50 Table I: Pre-regression odds ratios for permanent exclusion, by ethnicity (comparison
group: White British) 67
Table J: Pre-regression odds ratios for permanent exclusion, by CiN status and gender
(comparison group: never CiN) 67
Table K: Pre-regression odds ratios for permanent exclusion, by primary SEN type
(comparison group: no SEN) 67
Table L: Pre-regression odds ratios for fixed period exclusion, by primary SEN type
(comparison group: no SEN) 68
Table M: Pre-regression odds ratios for permanent exclusion, by school type and gender
(comparison group: LA maintained) 69
Table N: Pre-regression odds ratios for fixed period exclusion, by school type and gender
7
Accompanying Tables
The following national tables are available in Excel format alongside this document.
Tables
1. Number of pupils receiving fixed period and permanent exclusions during secondary phase, and number of half-day sessions missed due to exclusion
2. Fixed period and permanent exclusions issued during secondary phase, by pupil characteristics
3. Termly number and rates of permanent and fixed period exclusions for three cohorts of pupils in secondary phase
4. Termly number and rates of permanent and fixed period exclusions across three cohorts of pupils in secondary phase, by gender
5. Termly number and rates of permanent and fixed period exclusions across three cohorts of pupils in secondary phase, by minor ethnic group
6. Termly number and rates of permanent and fixed period exclusions across three cohorts of pupils in secondary phase, by SEN status and type
7. Termly number and rates of permanent and fixed period exclusions across three cohorts of pupils in secondary phase, by free school meal eligibility
8. Termly number and rates of permanent and fixed period exclusions across three cohorts of pupils in secondary phase, by school type
9. Termly number and rates of permanent and fixed period exclusions across three cohorts of pupils in secondary phase, by Children in Need status
10. Attainment at the end of Key Stage 4 by exclusion group, pupils in year 11 in 2015/16
When reviewing these tables, please note that the Code of Practice for Statistics requires us to take reasonable steps to ensure that our published or disseminated statistics
8
Key findings
The Timpson Review of School Exclusion was commissioned to examine how schools use exclusion and why some groups of children are more likely to be excluded from school. This report presents the findings of new analysis to assess the association between probability of being excluded and various pupil and school characteristics.
0.8% of pupils who entered Year 11 in 2014/15, 2015/16 or 2016/17 were permanently excluded during secondary school
0.8% of pupils across our three cohorts of pupils entering Year 11 in 2016/17, 2015/16 or 2014/15 had been permanently excluded during their secondary schooling and 13.2% had received one or more fixed period exclusion. 24% of pupils who had received a permanent exclusion during this time had received 10 or more fixed period exclusions (some of which may have occurred after the permanent exclusion). 45% of those who had received one or more fixed period exclusion during the secondary phase received only one fixed period exclusion.
Pupils who have been excluded have lower attainment
Key Stage 4 attainment of pupils receiving a permanent exclusion during secondary school is lower than that for pupils who have never received either a permanent or fixed period exclusion. Among those receiving some form of exclusion, attainment is highest for those receiving only one fixed period exclusion during their school career and lowest for those receiving a permanent exclusion. However, these results do not imply that exclusion is the cause of low attainment (or vice versa) as differences in pupil
characteristics, which may impact attainment have not been taken into consideration.
Some groups of pupils have higher exclusion rates
78% of permanent exclusions issued during secondary school were to pupils who either had special educational needs, were classified as in need1 or were eligible for free school
meals. 11% of permanent exclusions were to pupils who had all three characteristics.
9
New analysis allows us to understand the impact of different factors on the
likelihood of exclusion after controlling for other characteristics
The logistic regression analysis presented in this report allows us to draw conclusions about which factors are most strongly associated with exclusion in secondary schools after controlling for available information. In many cases, controlling for other factors reduces the differences between the odds of exclusion between different groups of pupils but, in many cases, some groups have higher or lower odds of exclusion even after applying these controls.
The results show that some pupil characteristics are very strongly associated with exclusions, holding other factors constant
After controlling for other factors, pupils from Black, Asian and minority ethnic groups were not, on average, excluded at a substantially different rate than White British pupils. Black Caribbean and Mixed White and Black Caribbean students had higher odds of permanent and fixed term exclusion than White British students. However, children from some ethnic groups were less likely to be excluded, such as Indian and Bangladeshi children. Some ethnic groups were not statistically significantly more or less likely to be excluded than White British pupils, such as Black African children. After controlling for other factors, children with behavioural, emotional and social
difficulties (BESD) (a category of SEN no longer in use) and social, emotional or mental health (SEMH) difficulties were also at much greater risk of exclusion. Typically, pupils with Special Educational Needs (SEN) with a statement of SEN/EHC plan had lower odds of permanent exclusion than non-SEN children, while SEN pupils without a statement of SEN/EHC plan were more likely to be excluded.
Children in Need and those with Child Protection Plans were substantially more likely to be excluded; in-need status is a stronger predictor of exclusion than economic deprivation measures. The impact is particularly pronounced for girls.
Although the association with exclusion is less pronounced than for pupil characteristics, the type of school a child attends is somewhat associated with likelihood of exclusion, holding other factors constant
On average, controlling for all other observable differences, sponsored academies permanently excluded proportionally more boys and issued more fixed-term exclusions to girls and boys than LA maintained schools. Pupils in converter academies did not have significantly different odds of exclusion than those in LA maintained schools.
However, we cannot interpret these results as causal
10
1. Background
The Timpson Review of School Exclusion was commissioned to examine how schools use exclusion and, in particular, why some groups of children are more likely to be excluded from school. The review was commissioned following the publication of the Ethnicity Facts and Figures website which highlighted the variation in the exclusion rates across pupils from different ethnic backgrounds.
This additional exclusion analysis includes descriptive analysis and logistic regression analysis to assess the association between probability of being excluded and various pupil and school characteristics. The analysis is conducted using a newly created panel dataset with three cohorts of pupils, followed across their time in secondary school. This report also includes descriptive analysis on the use of fixed-period exclusion (e.g. the frequency and length) and attainment outcomes of excluded and non-excluded pupils.
Existing data and analysis on exclusions
Schools are required to provide termly exclusion data for their pupils through the school census collection. This includes information on the type and reason for the exclusion and, for fixed period exclusions, information on the length of the exclusion. Since 2013/14, pupil referral units have also been required to submit termly exclusions data.
Types of exclusion
A permanent exclusion refers to a pupil who is excluded and who will not come back to that school (unless the exclusion is overturned).
A fixed period exclusion refers to a pupil who is excluded from a school for a set period of time. A fixed period exclusion can involve a part of the school day and does not have to be for a continuous period. A pupil may be excluded for one or more fixed periods up to a maximum of 45 school days in a single academic year.
The data is published annually in the department’s Permanent and fixed-period exclusions in England publication. The analysis in that publication looks at exclusions within a single academic year.
New data and analysis
11
also included2. There are approximately 570,000 pupils in each cohort, and 1.73 million
pupils in total across all 3 cohorts. Pupil characteristics, as recorded each term, are also included in the dataset.
Chapter 2 of this report presents exploratory analysis from the data examining:
• numbers and types of exclusions received and when they were received
• characteristics of excluded pupils
• exclusion rates by pupil characteristics, and
• GCSE outcomes for excluded pupils compared to their peers.
Chapter 3 presents an estimate of the association between pupil and school
characteristics at term t, and the probability of a pupil’s exclusion in the subsequent term
t + 1.
We use a logistic regression and control for observed differences between pupils and schools but the analysis cannot completely control for all differences. Importantly, we are unable to completely control for pupil behaviour and school tolerance of bad behaviour.
Therefore, the findings should not be interpreted as the causal effect of
characteristics on exclusion. However, our findings are informative in the sense that they tell us how much of the variation in exclusion rates can be explained by observable differences between pupils.
2 For simplicity, throughout the remainder of this report, the cohorts wll be referred to as those entering
12
2. Exploratory analysis
Number of exclusions
0.8% of pupils across our three cohorts of pupils entering Year 11 in 2016/17, 2015/16 or 2014/15 had been permanently excluded during secondary school and 13.2% had
received one or more fixed period exclusion (see Table 1 in the accompanying spreadsheet).
[image:12.595.56.515.472.688.2]The vast majority (97.8%) of the 13,216 pupils who had received a permanent exclusion during their secondary school career had only received one. However, 300 pupils across the three cohorts had received two permanent exclusions and fewer than 5 pupils had received three. Most (95%) of those who had been permanently excluded had also received one or more fixed period exclusions during their secondary phase – 38% had received between one and four fixed period exclusions, 34% had received between five and nine fixed period exclusions and 24% had received 10 or more (see table A). Some of these fixed period exclusions will have occurred after the permanent exclusion. 45% of those pupils who had received one or more fixed period exclusion during secondary phase had received a single fixed period exclusion. 33% had received between two and four fixed period exclusions, 15% had received between five and nine fixed period exclusions and 7% had received 10 or more. A small number of pupils had received 50 or more fixed period exclusions.
Table A: Number of fixed period exclusions received3
Number of fixed period exclusions received during secondary phase
0 1 2 to 4 5 to 9 10 or more
Pupils who had received at least one permanent exclusion
5% 10% 28% 34% 24%
Pupils who had received at least one fixed period exclusion
- 45% 33% 15% 7%
3 Pupils who had received at least one fixed period exclusion also includes those who had received a permanent
13
Duration of exclusion
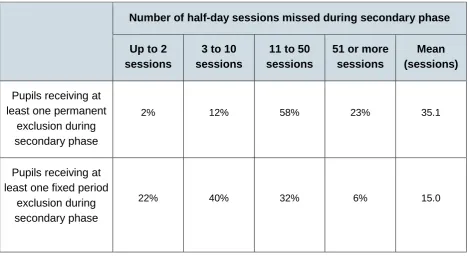
[image:13.595.57.528.197.455.2]14% of permanently excluded pupils had received fixed period exclusions totalling a week (10 half-day sessions) or less (see table B). This includes sessions missed after the permanent exclusion. However, 3,033 permanently excluded pupils (23%) have received fixed period exclusions totalling 5 weeks (50 half-day sessions) or more.
Table B: Number of half-day sessions missed
Number of half-day sessions missed during secondary phase
Up to 2 sessions
3 to 10 sessions
11 to 50 sessions
51 or more sessions
Mean (sessions)
Pupils receiving at least one permanent
exclusion during secondary phase
2% 12% 58% 23% 35.1
Pupils receiving at least one fixed period
exclusion during secondary phase
22% 40% 32% 6% 15.0
On average, pupils who had received at least one permanent exclusion during their secondary school career, had received a total of 17.6 days of fixed period exclusions (some of which may have been after their permanent exclusion). For all those who had received at least one fixed period exclusion during secondary phase (including those who had also had a permanent exclusion), they had received a total of 7.5 days of fixed
period exclusions during their secondary phase.
When exclusions occur
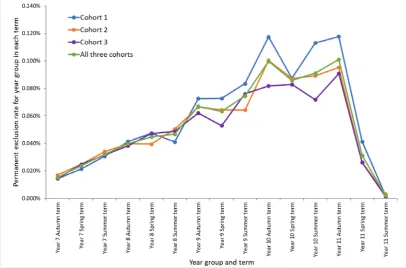
14
[image:14.595.56.463.106.374.2]Figure 1: Termly permanent exclusion rate throughout secondary phase, for 3 cohorts of pupils: those entering Year 11 in 2016/17, 2015/16 and 2014/15
15
16
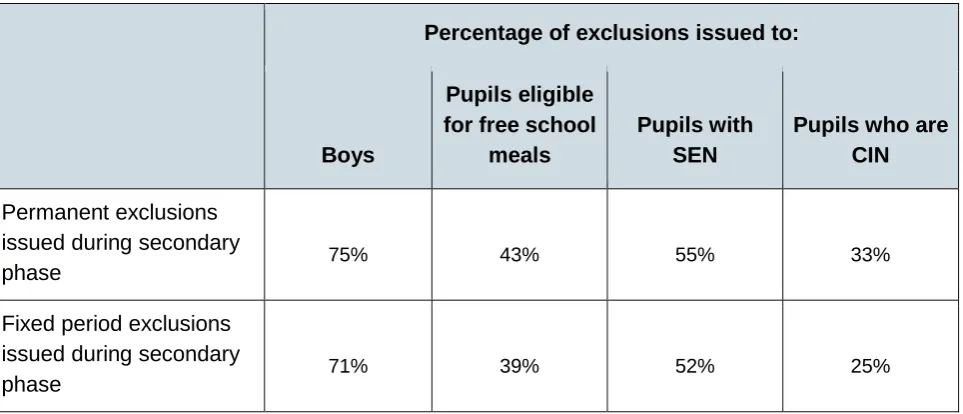
Characteristics of excluded pupils
[image:16.595.59.541.247.454.2]Table C below shows some characteristics of pupils who had received a permanent exclusion or a fixed period exclusion during their secondary phase. This combines all pupils across the three cohorts who entered Year 11 in 2016/17, 2015/16 and 2014/15, and shows the characteristics in the term of exclusion. We see that exclusions are more likely to be issued to boys, those eligible for free school meals, those with a special educational need (SEN) and those children in need (CIN).
Table C: Characteristics of excluded pupils
Percentage of exclusions issued to:
Boys
Pupils eligible for free school
meals
Pupils with SEN
Pupils who are CIN
Permanent exclusions issued during secondary
phase 75% 43% 55% 33%
Fixed period exclusions issued during secondary
phase 71% 39% 52% 25%
78% of permanent exclusions issued were to pupils who either had SEN, were classified as in need or were eligible for free school meals. 11% of permanent exclusions were to pupils who had all three characteristics, and 22% of permanent exclusions were to pupils who had none of these characteristics.
17
Exclusion rates by pupil characteristics
This section provides some descriptive statistics showing permanent exclusion rates throughout secondary school across the 3 cohorts of pupils (those entering Year 11 in 2014/15, 2015/16 and 2016/17) by pupil characteristics in the term of exclusion. Each characteristic is considered in isolation so, for example, we see that boys have higher rates of exclusion than girls, but this doesn’t take account of the other characteristics that boys may have increase their likelihood of exclusion. Chapter 3 of this report presents the findings of a set of logistic regression models which estimate the association between pupil and school characteristics and the probability of a pupil’s exclusion once other factors are controlled for.
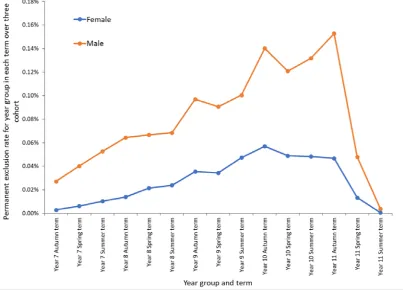
Gender
[image:17.595.57.461.398.691.2]Permanent exclusion rates for boys are consistently higher than for girls throughout years 7 to 11 across the 3 cohorts (Figure 3). The highest rate for boys is in Autumn term of Year 11, at 0.15%, compared to a peak for girls, at 0.06% in Autumn term of Year 10.
18
Ethnicity
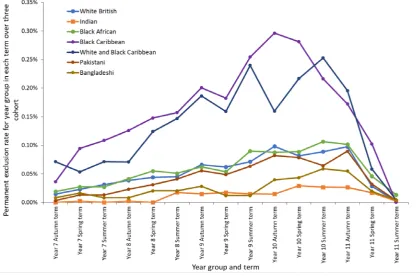
Existing published statistics4 show that both permanent and fixed period exclusion rates
in 2016/17 (across all ages) were highest for pupils from Traveller of Irish Heritage and Gypsy/Roma backgrounds, although numbers of permanent exclusions are relatively small (25 and 90 respectively in 2016/17). Chinese pupils had the lowest number and rate of permanent exclusions in 2016/17 (fewer than 3 exclusions). As the data for this report looks at exclusions for only 3 cohorts of pupils, and on a termly rather than annual basis, numbers of exclusions for some ethnic groups are very small, and rates are
volatile. The chart below shows termly permanent exclusion rates throughout secondary phase, across the 3 cohorts, for pupils with large enough cohort sizes to enable
[image:18.595.57.478.367.647.2]meaningful analysis. Whilst the numbers of permanent exclusions over the 3 cohorts are still quite small for Black Caribbean pupils (ranging from 0 to 67 throughout Autumn Year 7 to Autumn Year 11), Black Caribbean pupils tend to have the highest rates of exclusion of these groups across years 7 to 11, and Indian pupils the lowest.
Figure 4: Termly permanent exclusion rate throughout secondary phase, for 3 cohorts of pupils (those entering Year 11 in 2016/17, 2015/16 and 2014/15) by minor ethnic group
4
19
Special Educational Needs (SEN)
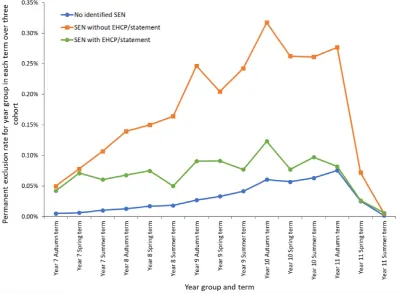
[image:19.595.58.463.212.505.2]Figure 5 shows that permanent exclusion rates are highest for pupils with SEN but who do not have a statement of SEN or Education, Health and Care (EHC) plan), whilst rates for those with no SEN are the lowest. This is consistent throughout secondary phase, and there is a peak of 0.32% for those with SEN but no statement of SEN/EHC plan.
Figure 5: Termly permanent exclusion rate throughout secondary phase, for 3 cohorts of pupils (those entering Year 11 in 2016/17, 2015/16 and 2014/15) by SEN status
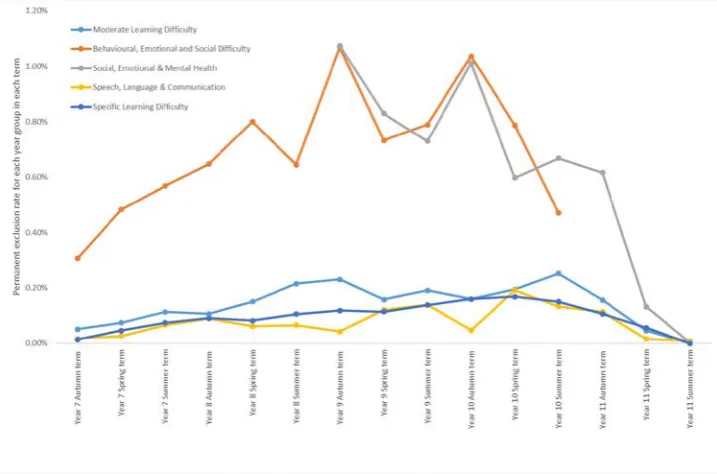
There are wide variations in exclusion rates by SEN primary type of need. Note that in 2014, DfE stopped using the categorisation of ‘Behaviour, emotional and social
difficulties (BESD)’, at which point it then introduced a separate SEMH type SEN,
although this was not intended to be a direct replacement. Of those identified with BESD in Spring 2013/14, 67.1% were recorded with SEMH in Spring 2014/15. Nonetheless, these types of need are distinct.
Figures 6 and 7 show termly permanent exclusion rates for SEN pupils without an EHC plan or statement of SEN, and for those with an EHC plan or statement of SEN
20
Figure 6:Termly permanent exclusion rate throughout secondary phase, for 3 cohorts of
pupils with SEN without EHC plan/ statement (those entering Year 11 in 2016/17, 2015/16
[image:20.595.58.417.121.358.2]and 2014/15) by primary type of SEN5
Figure 7: Termly permanent exclusion rate throughout secondary phase, for 3 cohorts of pupils with statement/ EHC plan (those entering Year 11 in 2016/17, 2015/16 and 2014/15), by primary type of SEN
5 Exclusion rates for pupils with behavioural, emotional and social difficulties in Year 11 have not been
21
Children in need status
All children on a children in need plan (CINP), a child protection plan (CPP) and looked after (CLA), are ‘children in need’. For the purposes of our analysis we have considered whether a child is currently in need, or has been in need previously, and we have created the following hierarchy:
• Never CIN (i.e. pupils never on a CINP, CPP or looked after)
• Prior CIN but no CIN activity in term (i.e. pupils not on a CINP, CPP or looked after during the term but previously one of these)
• In term, CINP but not CPP or CLA
• In term, CPP but not CLA
• In term, CLA
• No information
The methodology section for more details.
22
Figure 8: Termly permanent exclusion rate throughout secondary phase, for 3 cohorts of
pupils (those entering Year 11 in 2016/17, 2015/16 and 2014/15) by children in need status6
6 Year 11 Summer term data are not shown, as statistical disclosure control has been applied due to small
23
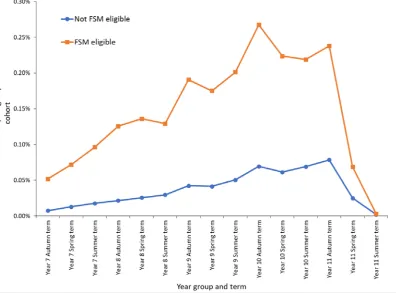
Free school meal eligibility
[image:23.595.66.463.216.509.2]Permanent exclusion rates are consistently higher throughout secondary phase for pupils who are eligible for free school meals in the term they are excluded, with a peak of 0.27% in the rate in Autumn of Year 10 (Figure 9).
24
Type of school attended
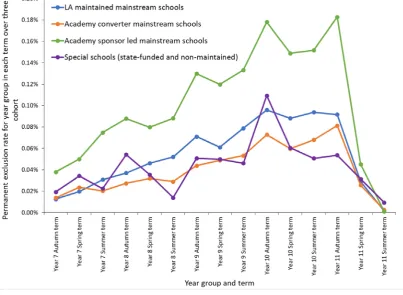
[image:24.595.90.494.237.532.2]Figure 10 shows that termly permanent exclusion rates are highest throughout secondary phase for pupils attending mainstream sponsor-led academies. Rates for mainstream converter academies are slightly lower than for mainstream LA-maintained schools. Exclusion rates for pupils in special schools are volatile due to small numbers of exclusions in some terms.7
Figure 10: Termly permanent exclusion rate throughout secondary phase, for 3 cohorts of pupils (those entering Year 11 in 2016/17, 2015/16 and 2014/15) by type of school attended
7 Information on permanent exclusion rates of pupils attending pupil referral units and alternative provision
25
Key Stage 4 outcomes for excluded pupils
Alongside the other analysis presented in this report, separate analysis has been undertaken to compare the attainment of excluded pupils who reached the end of Key Stage 4 in 2015/16, with the attainment of pupils who had not been excluded. This analysis is based on a dataset of only one cohort of pupils8. It considers those who have
ever had a permanent or fixed period exclusion during primary or secondary school, but it does not include any pupils who were excluded from school and not subsequently
entered into Key Stage 4 exams.
Figure 11 shows that the attainment of pupils receiving a permanent exclusion is considerably lower than that for pupils who have never received either a permanent or fixed period exclusion on all attainment measures. Among those receiving some form of exclusion, attainment is highest for those receiving only one fixed period exclusion during their school career and lowest for those receiving a permanent exclusion. These findings remain true when we consider attainment 8 and progress 8 measures (see table 10 of the accompanying excel tables).
However, it should be noted that these groups do not differ solely on their attainment. These results do not imply that exclusion is the cause of low attainment (or vice versa) as differences in pupil characteristics that may impact attainment have not been taken into consideration.
8 The dataset includes all pupils aged 15 on 31 August 2015 who were at the end of Key Stage 4 in
2015/16 in England, excluding those who were in an independent school at the end of Key Stage 4. Analysis is based on exclusions data covering the period 2005/06 to 2015/16 with the following caveats:
• Exclusions data was not collected in 2004/05 (when the cohort was in reception)
• Information on fixed period exclusions was not collected in 2005/06 (when the cohort was in Year 1)
• In 2005/06 and 2006/07, the number of permanent exclusions received during the year was not collected. However, we do have information on whether the pupil received a permanent exclusion during the year.
26
Figure 11: Attainment at the end of Key Stage 4 by exclusion group, for pupils reaching
end of Key Stage 4 in 2015/169
27
3. Factors associated with exclusion
In this chapter, we present results from logistic regressions looking at pupil- and school- level factors associated with fixed and permanent exclusion.
Logistic regression allows us to look at the association between a characteristic (for example, FSM eligibility) and the likelihood of being excluded (both fixed term and permanent) after controlling for all the other available information.
Fixed term and permanent exclusions have been considered separately and models for each have been estimated separately for both boys and girls, and again separately with and without additional school-level characteristics. This equates to eight models in total and the detailed methodology, alongside the full regression results, is contained in the Annexes to this report. The Annexes to this report also contain the raw, unadjusted odds ratios for different groups without controlling for other characteristics in the regression analysis.
Before looking at the key results it is important to note the following important caveats:
• The results we present are conditional relationships and cannot be viewed as causal. We are unable to directly account for all potential differences that may lead to exclusion and this is important for interpretation. A wide range of pupil and school-level factors have been controlled for, but we cannot fully control for differences in pupil behaviour or other unobserved factors which may influence exclusion.
• Leading on from that, it may be the case that the estimated association between variables reflects an intermediate variable also associated with exclusion.
• Only a very small proportion of pupils are excluded each year. This means we cannot draw conclusions about differential treatment or behaviour of the majority
of pupils in different groups. Higher odds of exclusion for any particular group does not mean that all the pupils in that group are worse behaved or are treated
differently – instead it could represent different behaviour or treatment among only the worst behaved in that group, which may be only a very small number of
children.
Interpreting the results
28
this group is more likely to be excluded, and odds below 1 mean they are less likely to be excluded. If group A has an odds ratio of 2.0 compared to group B, this means group A
has twice the odds of exclusion of group B. Conversely, if group A has an odds ratio of 0.5 compared to group B, this means group B has twice the odds of group A.
The charts in this chapter report the odds ratios, split by gender, for different groups compared with a reference group (of the same gender). The black horizontal bar represents an odds ratio of 1: where the odds of exclusion are identical to those in the reference group. The charts also show the statistical significance of the explanatory variables: lighter shaded bars are used to show that the odds of exclusion are not statistically significantly different from the comparator group. Throughout, the following colour-coding conventions apply:
Boys (statistically significant)
Girls (statistically significant) Boys (not statistically
significant)
Girls (not statistically significant)
29
Pupil characteristics
[image:29.595.66.530.176.493.2]Disadvantage
Figure 12: Odds ratios for permanent and fixed exclusions by disadvantage (comparison
groups: no FSM, no CiN status, one standard deviation lower IDACI rank)
Our measures of disadvantage are almost all positively associated with exclusion after controlling for other available information. Social care status (other than those who have previously been, but are not now, looked after) has a very pronounced association with the likelihood of exclusion, particularly for girls.
Economic disadvantage, as measured by eligibility for free school meals, is also associated with higher odds of exclusion for boys and girls. Similarly, living in a more disadvantaged area increases the odds of exclusion: a one standard deviation increase in the income deprivation affecting children index (IDACI) rank raises the likelihood of both permanent and fixed-period exclusions.
0.00 1.00 2.00 3.00 4.00 5.00 6.00 7.00 8.00 9.00 10.00
30
[image:30.595.57.532.133.671.2]Special Educational Needs
Figure 13: Odds ratios for permanent exclusions by SEN status (comparison group: no SEN)
0.00 1.00 2.00 3.00 4.00 5.00 6.00 7.00 8.00 9.00 S c h ool ac ti on A ut is ti c s pec tr um di s o rder B eh av iour a l em ot iona l an d s oc ial di ff ic u lt ie s M oder a te l ear n ing di ff ic u lt y N ot r e c o rded O th e r d if fic u lt y d is a b ili ty P rof o und and m u lt ip le lear ni ng di ff ic ul ti es S oc ial em ot io nal and m e nt al he al th S pe ec h l an gua ge a nd c om m u ni c at io ns nee ds S p e c if ic le a rn in g d if fic u lt y A ut is ti c s pec tr um di s o rder B eh av iour a l em ot iona l an d s oc ial di ff ic u lt ie s M oder a te l ear n ing di ff ic u lt y N ot r e c o rded N o s pec ial is t as s e s s m en t P rof o und and m u lt ip le lear ni ng di ff ic ul ti es S oc ial em ot io nal and m e nt al he al th S ev er e l ear n ing di ff ic ul ty
31
Figure 14: Odds ratios for fixed period exclusions by SEN status (comparison group: no
SEN)
Behaviour, emotional and social difficulties (BESD) was the SEN category most strongly associated with both permanent and fixed term exclusion. Note that in 2014, DfE stopped using the categorisation of ‘Behaviour, emotional and social difficulties (BESD)’, at which point it then introduced a separate SEMH type SEN, although this was not intended to be a direct replacement. SEMH for those without a statement of SEN or an EHC plan was also strongly associated with permanent exclusion. Disruptive behaviour may in some cases prompt an assessment of underlying conditions, such as BESD or SEMH needs, which may manifest in this way, hence higher exclusion rates may at least partly reflect identification of their needs.
Looking at fixed term exclusions overall, several SEN categories were positively associated with the likelihood of exclusion. Physical disabilities, visual and hearing
impairments and severe learning difficulties for pupils with a statement of SEN or an EHC plan were associated with a lower likelihood of exclusion.
0.00 1.00 2.00 3.00 4.00 5.00 6.00 7.00 S c ho o l A c tio n A ut is ti c s pec tr um di s o rder B eh av iour a l em ot iona l an d s oc ial … H ear ing i m p ai rm ent M oder a te l ear n ing di ff ic u lt y M u lt is e ns or y im p ai rm e n t S E N t y pe n ot r e c or d ed N o s pec ial is t as s e s s m en t O th e r d if fic u lt y d is a b ili ty P h y s ic a l d is a bi lit y S oc ial em ot io nal and m e nt al he al th S pe ec h l an gua ge a nd c om m u ni c at io ns … S ev er e l ear n ing di ff ic ul ty S p e c if ic le a rn in g d if fic u lt y V is ual i m pai rm e nt A ut is ti c s pec tr um di s o rder B eh av iour a l em ot iona l an d s oc ial … H ear ing i m p ai rm ent M oder a te l ear n ing di ff ic u lt y O th e r d if fic u lt y d is a b ili ty P h y s ic a l d is a bi lit y S oc ial em ot io nal and m e nt al he al th S pe ec h l an gua ge a nd c om m u ni c at io ns … S ev er e l ear n ing di ff ic ul ty S p e c if ic le a rn in g d if fic u lt y V is ual i m pai rm e nt
32
Throughout the analysis we see differences between those with a statement of SEN or EHC plan and those without. For a given SEN category, pupils with a statement of SEN t or an EHC plan were generally much less likely to be permanently excluded and the association with fixed term exclusions was also generally smaller for this group.
[image:32.595.61.478.261.516.2]Ethnicity
Figure 15: Odds ratios for permanent exclusions comparing BAME and non-BAME
(comparison group: White British)
0.00 0.20 0.40 0.60 0.80 1.00 1.20
BAME BAME
33
Figure 16: Odds ratios for permanent exclusions by ethnicity (comparison group: White
[image:33.595.65.522.134.390.2]British)
Figure 17: Odds ratios for fixed period exclusions by ethnicity (comparison group: White
British)
0.00 0.50 1.00 1.50 2.00 2.50
34
Looking across the data we see there is a very small but statistically significant difference in exclusion odds of 0.01 between BAME and non-BAME pupils. However, this obscures variation in exclusion rates across different ethnicities.
In general, pupils from many ethnic backgrounds had a permanent exclusion rate that was statistically indistinguishable from that of White British pupils. However, Black Caribbean pupils, Mixed White and Black Caribbean pupils and boys from any other mixed ethnic background were more likely to be permanently excluded even after
accounting for other factors. Black Caribbean boys had 74% greater odds of permanent exclusion while Black Caribbean girls have 33% greater odds. Mixed White and Black Caribbean boys have 60% greater odds of permanent exclusion, while girls have around 50% greater odds of permanent exclusion. We note the exclusion rate for Irish Traveller and Gypsy/Roma pupils' contrasts with their descriptively much higher exclusion rate and reflects the fact we have controlled for a number of other factors including unauthorised absence, the number of school moves and economic disadvantage measures.
Black African girls and pupils of most Asian backgrounds were less likely than White pupils to be permanently excluded after controlling for other observable factors.
35
[image:35.595.60.526.172.477.2]Other pupil factors
Figure 18: Odds ratios for permanent and fixed period exclusions by other pupil factors
(comparison groups: one standard deviation lower average KS2 results, not EAL, one standard deviation lower number of schools attended in the last nine months, one standard deviation lower percentage of sessions missed due to absence).10
Those with higher Key Stage 2 results were less likely to be permanently or fixed term excluded from school, with the odds of permanent exclusion decreasing by 20% for each standard deviation (around 10 points) increase in Key Stage 2 scores.
Those who spoke English as an additional language were less likely to be excluded than pupils with English as a first language. Pupils who missed more school sessions due to unauthorised absence were much more likely to be permanently and fixed excluded, as were those who had attended more schools in the previous nine terms. A pupil who attended one more school in the previous nine terms had 40%-70% higher odds of exclusion, depending on gender and whether looking at fixed or permanent exclusions.
10 A one standard deviation increase in KS2 scores, number of schools attended in the last nine terms and
the percentage of sessions missed due to absence represents, is respectively, 10 KS2 points, 0.5 schools, 6 percentage points of sessions missed.
0.00 1.00 2.00 3.00 4.00 5.00 6.00 Av e ra g e KS2 re s u lt s EAL N um ber o f s c ho ol s at tende d in t he l as t ni ne ter m s % of s e s s ion s m is s ed du e to abs enc e Av e ra g e KS2 re s u lt s EAL N um ber o f s c ho ol s at tende d in t he l as t ni ne ter m s % of s e s s ion s m is s ed du e to abs enc e
36
School characteristics
[image:36.595.66.525.191.436.2]School type
Figure 19: Odds ratios for permanent and fixed period exclusions by school type
(comparison group: LA maintained schools)
Compared to other school and pupil characteristics, school type generally had a smaller impact on the likelihood of exclusion, except in the case of special schools and
alternative provision, where pupils were much less likely to be permanently excluded than those at LA maintained schools. It is worth noting that pupils may be placed in Alternative Provision as a response to poor behaviour and so different exclusion rates in Alternative Provision are likely to reflect different behaviour of the pupil intake in addition to any differences in school practice.
Boys at sponsored academies were statistically significantly more likely to be
permanently excluded than boys at local authority-maintained schools. Our model cannot be interpreted causally, but we note causal work on this topic (Machin and Sandi, 201911)
does show that academy conversion persistently increased the likelihood of exclusion among pupils at converting schools for at least four years. Additionally, the authors note
11 Machin, S and Sandi, M. 2019 (forthcoming). “Autonomous Schools and Strategic School Exclusion”
Economic Journal 0 0.5 1 1.5 2 2.5 3 C onv er te r ac ade m y S po ns o red ac ade m y F ree s c ho ol s Al te rn a ti v e p rov is ion S p ec ial O ther C onv er te r ac ade m y S po ns o red ac ade m y F ree s c ho ol s Al te rn a ti v e p rov is ion S p ec ial O ther
37
the same pupil characteristics were associated with exclusion from academies as from LA maintained schools.
The picture is largely similar for fixed term exclusions, except that Alternative Provision schools are more likely to issue fixed term exclusions than LA maintained mainstream schools, and our analysis is able to detect a significant positive association between sponsored academies and the likelihood of fixed term exclusion for both boys and girls.
[image:37.595.74.532.272.633.2]Region
Figure 20:Odds ratios for permanent and fixed period exclusions by region (comparison
groups: London, rural)
Three areas of the country had a permanent exclusion rate significantly lower than London after accounting for school and pupil characteristics: Yorkshire and the Humber, the East of England and the South East.
0 0.2 0.4 0.6 0.8 1 1.2 1.4 1.6 N o rt h Ea s t N or th W es t Y or k s h ir e a nd t he H um be r E as t M idl ands W es t M idl and s E as t of E ngl and S ou th E as t S o ut h W es t U rban N o rt h Ea s t N or th W es t Y or k s h ir e a nd t he H um be r E as t M idl ands W es t M idl and s E as t of E ngl and S ou th E as t S o ut h W es t U rban
38
Fixed term exclusions for boys were statistically indistinguishable from London across England. However, the odds of fixed term exclusion for girls was lower in the East and West Midlands, the East of England and both the North East and North West.
Other school factors
Figure 21: Odds ratios for permanent and fixed period exclusions by school Ofsted grade
or faith school status (comparison group: Ofsted ‘Good’ schools, non-faith schools)
Ofsted rating appears to be inversely associated with the likelihood of exclusion with higher rated schools tending to exclude fewer children. However, it is not clear in our modelling which way any association runs.
0.00 0.20 0.40 0.60 0.80 1.00 1.20 1.40 1.60 1.80 O fs te d O u ts ta n d in g O fs te d R I O fs te d I n ade quat e F ai th s c h ool O fs te d O u ts ta n d in g O fs te d R I O fs te d I n ade quat e F ai th s c h ool
39
Figure 22: Odds ratios for permanent and fixed period exclusions by teacher turnover rate
and teacher experience (comparison group: one standard deviation lower teacher turnover, one
standard deviation lower average teacher experience)12
Schools with lower teacher turnover and less experienced teachers also tended to exclude more pupils; although this again should not be interpreted causally.
12 A one standard deviation increase in teacher turnover represents an increase in the turnover rate by 15
percentage points. A one standard deviation increase in average teacher experience represents 3 additional years’ experience.
0.00 0.20 0.40 0.60 0.80 1.00 1.20
Teacher turnover Average teacher experience
Teacher turnover Average teacher experience
40
Annex A: Production of the data
Overview
The basis of the dataset used for this analysis is the termly school census, from 2010/11 to 2016/17. Three cohorts of secondary pupils in England were selected - those in state-funded secondary schools and special schools who would enter Year 11 in academic years 2014/15, 2015/16, and 2016/17. Data on pupils in pupil referral units, alternative provision academies and alternative provision free schools is also included from 2013/14 onwards; prior to this, exclusions data for pupils in these settings were not collected on a consistent basis. Pupils who have incomplete records e.g. who have entered or left the English state school system during years 7 to 11 are included13. There are approximately
570,000 pupils in each cohort, and 1.73 million pupils in total across all 3 cohorts. Each pupil may have up to 15 records in the dataset – one for each of the 3 terms in each of years 7 to 11 in secondary school. Additionally, records from Summer term of Year 6 are included to provide characteristics information in the term prior to exclusion for those pupils excluded in Autumn of Year 7. Year 6 Spring term data is also included for items only collected in Spring.
Academic Year Cohort 1 Cohort 2 Cohort 3
2016/17 Year 11
2015/16 Year 10 Year 11
2014/15 Year 9 Year 10 Year 11
2013/14 Year 8 Year 9 Year 10
2012/13 Year 7 Year 8 Year 9
2011/12 Year 6 (Spring, Summer) Year 7 Year 8
2010/11 Year 6 (Spring, Summer) Year 7
2009/10 Year 6 (Spring, Summer)
13 For simplicity, throughout this report, the cohorts are referred to as those entering Year 11 in 2014/15,
41
Information about the pupil
School Census data
The pupil’s main record was used to obtain information about the pupil, so for example, if a pupil was dual-registered at two schools, the dual main record as recorded on the school census was used rather than the dual subsidiary record.
Some pupil characteristics (for example, special educational needs) may change throughout a pupil’s school career so the dataset included information for each term to ensure it related to the term of exclusion. The following school census data for each pupil in each term during secondary school was included in the dataset:
• Pupil gender
• Pupil eligibility for free school meals (FSM)
• Pupil ethnicity: ethnicity is only collected in the Spring census, so where pupils did not have census information in a term, data from the nearest Spring census was used to reduce missing fields. If ethnicity was not available in the latest Spring census data, previous Spring census data was used if available. If it was still not available for excluded pupils, internally-held exclusions data based on other censuses was also checked.
• Pupil speaking English as an additional language
• Number of schools’ pupil attended in the last nine terms: where pupils have moved from a primary to a secondary school, this will count as 2 schools. Where pupils have attended a school which has become an academy, this will not count as a different school. If a pupil attended a school, moved to another school, then returned to the same school, this will only count as 2 schools. This is based on a pupil’s main record as at each termly census (assumes only one main registration to a school in a term).
• Income Deprivation Affecting Children Index (IDACI) rank of the area the pupil lives in: The IDACI measures the proportion of all children aged 0 to 15 in a neighbourhood living in income deprived families (see
https://www.gov.uk/government/statistics/english-indices-of-deprivation-2015). IDACI ranks are updated every 5 years, the latest in 2015. The latest IDACI rank available for each record in the data was used, matched using the pupil’s
postcode. IDACI rank is not available for pupils in Summer 2010/11 or Autumn 2011/12 so information was taken from the nearest Spring census for each.
42
• Pupil special educational needs (SEN), combining both primary SEN type (e.g. autistic spectrum disorder) and SEN provision (e.g. SEN support) – see below for more details.
Special educational needs
Pupils identified with special educational needs (SEN) are classified as those that have a statement of SEN or Education, Health and Care (EHC) plan and those who are in the SEN support category (or, prior to 2015, School Action or School Action Plus).
Special educational needs (SEN) SEN Support
From 2015, the School Action and School Action Plus categories have combined to form one category of SEN support. Extra or different help is given from that provided as part of the school’s usual curriculum. The class teacher and special educational needs co-ordinator (SENCO) may receive advice or support from outside specialists. The pupil does not have a statement or education, health and care plan.
Statement of special educational needs (statement) or Education, Health and Care (EHC) Plan
A pupil has a statement or EHC plan when a formal assessment has been made. A document is in place that sets out the child’s need and the extra help they should receive.
Primary type of need is collected through the school census for those pupils on SEN support or with a statement of SEN or EHC plan. The coverage for 2015 onwards is different to previous years. Pupils who were on School Action were not required to have a primary type of need recorded. From 2015 pupils who were on School Action who have transferred to SEN support will be recorded as having a primary type of need. This has led to an increase in the number of pupils recorded as having a primary type of need. There were changes to the classification of type of need in 2015: the previous code of ‘Behaviour, emotional and social difficulties (BESD)’ was removed. A new code ‘Social, emotional and mental health (SEMH)’ was introduced, although this was not intended to be a direct replacement. Analysis of the 3 cohorts of pupils included in our dataset shows that of those identified with BESD in Spring 2014, 67.1% were recorded with SEMH in Spring 2015. The code ‘SEN support but no specialist assessment of type of need’ was also introduced in 2015. For the purposes of our analysis, this category has been
included within the ‘not specified’ category of primary type of need.
43
Table D: Categorisation of SEN primary need
Code SEN primary need
ASD Autistic spectrum disorder
HI Hearing impairment
MLD Moderate learning difficulty
MSI Multi-sensory impairment
PD Physical disability
PMLD Profound & multiple learning difficulty SEMH Social, emotional & mental health
BESD Behaviour, emotional and social difficulties SLCN Speech, language & communication
SLD Severe learning difficulty
SPLD Specific learning difficulty
VI Visual impairment
OTH Other difficulty/disability
Children looked after, on a child protection plan or in need
Data on pupils on a child protection plan (CPP) and those on a children in need plan (CINP) are taken from the children in need census. Data on pupils who are looked after is taken from the children looked after (CLA) data collection (SSDA903). All three groups are collectively known as children in need (CIN). Child level CIN data between Summer 2010/11 and Spring 2016/17 were matched onto the school census base data.
All children who are looked after will also be in need. Similarly, all children who are on a child protection plan are also in need. To simplify analysis and interpretation, we have created the following hierarchy:
• Never CIN (i.e. pupils never on a CINP, CPP or looked after)
44
• In term, CINP but not CPP or CLA
• In term, CPP but not CLA
• In term, CLA
• No information
The CIN and CLA data collections are annual, covering the year 1 April – 31 March. In order to identify pupils who had been CIN (i.e. on a CINP, CPP or CLA) in each term, we assumed that a pupil who was CIN for some time during 1 April -31 March was CiN in each term, e.g. someone who was CIN at some point during 1 April 2013 – 31 March 2014, was assumed to be CIN during Summer term 2012/13, and Autumn and Spring terms of 2013/14.
Prior attainment data
Pupil level data on the total Key Stage 2 point score for each pupil was matched onto the school census base data. If there were duplicate Key Stage 2 records, the highest score was used. The rate of participation in Key Stage 2 tests in 2009/10 was 74% across state-funded schools, due to industrial action. Therefore, Key Stage 2 data are
incomplete for those pupils who were expected to complete Key Stage 4 in 2014/15.
Exclusions data
Termly permanent and fixed period exclusion data collected through the school census was matched onto the school census demographic information.
Exclusions data are collected two terms in arrears, meaning that, where a school closes, data are not collected for the last two terms that the school was open. Where a pupil had been permanently excluded prior to the census date in term, and had not reappeared on another school roll, the demographic information about that pupil from the previous term school census was used where available. There were a very small number of cases where a pupil had been excluded more than once during the term. In this case, the first permanent exclusion only was included in the data.
In some cases, where a school had converted to an academy, exclusions data (collected 2 terms in arrears) were provided on the new school code rather than the old school code for the last two terms prior to conversion. In such cases, we attempted to link the old and new school codes to improve completeness.
45
Absence data
Absence data collected in the school census was used to calculate the percentage of possible sessions (across all registrations) the pupil missed in each term due to unauthorised absence, as well as over the whole of Year 6.
Information about the school the pupil was attending
We also included some information about the school that the pupil was attending in each term. If a pupil was permanently excluded in a term, the information relates to the school the pupil was excluded from (even if this was not their main registration as recorded on the school census); otherwise it relates to the school attended as recorded in the school census (these may be the same).
The following school level variables were included: From Get information about schools:
• Whether the pupil’s school is urban or rural
• The region the pupil’s school is in
• Whether the pupil’s school is a faith school
[image:45.595.51.541.486.715.2]• Type of school the pupil attends (see table E below for categories used)
Table E: Categorisation of school types
School category Schools included
LA maintained Community, voluntary aided, voluntary controlled, foundation Converter academy Converter academy
Sponsored academy Sponsor led academy Free school Free school
Special school Community special, foundation special, non-maintained special, academy special, special free, converter special academy Alternative provision
(AP)
46
School category Schools included
Other City technology college, further education sector institution, special colleges, overseas schools, service children’s education, secure unit, UTC, studio school, 16-19 free school
From school census and exclusions data:
• The proportion of pupils at the pupil’s school eligible for Free School Meals
• The proportion of pupils at the pupil’s school of each ethnicity
• School fixed period exclusion rate: the average number of sessions missed by other pupils at the pupil’s school due to fixed period exclusion (i.e. school fixed period exclusion rate, excluding sessions missed by the individual pupil
themselves).
From Key Stage 2 and 4 attainment data:
• The percentile rank of average Key Stage 4 results of pupils at the pupil’s school within the year. We use the rank due to changes in measurement of KS4
introduced in 2015-16, so schools are ranked within each year on either Attainment 8 (for 2015/16 and 2016/17) or new style points (for earlier years).
• Average Key Stage 2 total point score of Year 11 pupils at the pupil’s school
• The number of eligible pupils for Key Stage 4 in the pupil’s school in that year. From school workforce census data:
• The proportion of teachers who were new to the pupil’s school in that year
• The proportion of teachers at the pupil’s school who are Newly Qualified Teachers (NQTs)
• The average years of experience of teachers at the pupil’s school. From Ofsted management information:
47
Annex B: Logistic regression detailed methodology
and full results
Met
hod
ology
We run eight separate logistic regressions to estimate the association of exclusion with pupil and school characteristics. These eight models result from all combinations of the following:
o separate models for male and female pupils,
o separate models for fixed and permanent exclusions,
o different models to report the association of school characteristics with exclusions; and the association of pupil characteristics with exclusions. Both models estimate the probability of exclusion of individual pupils using pupil level data but vary in the control variables used.
We acknowledge that the results presented cannot be interpreted causally because we are insufficiently able to control for all relevant confounders in our specifications. Namely, we believe that unobserved pupil behaviour (and any other related unobservables) bias our results and these may therefore overstate the real strength of relationship between our observed characteristics and the likelihood of exclusion. However, we attempt to reduce endogeneity by using time lagged characteristics, as well as including the full set of observed confounders as control variables.
Lagged variables
The analysis utilises a termly panel of data from three cohorts of pupils from Year 7 through to Year 11. This allows us to use time lagged variables, usually in the term prior to exclusion to reduce any simultaneity bias. For example, a SEN diagnosis could alter in the run up to or after the exclusion.
Given that pupils may be excluded before the termly school census (when pupil
characteristics are measured), we regress pupil characteristics in term t on exclusions in term t + 1, as shown by the following equation:
𝐸𝐸𝐸𝐸𝐸𝐸𝐸𝐸𝐸𝐸𝐸𝐸𝐸𝐸𝐸𝐸𝐸𝐸𝑖𝑖,𝑡𝑡+1 =𝛽𝛽1𝑋𝑋𝑖𝑖1,𝑡𝑡+𝛽𝛽2𝑋𝑋𝑖𝑖2,𝑡𝑡+1+𝛽𝛽3𝑊𝑊𝑖𝑖+𝜖𝜖𝑖𝑖,𝑡𝑡
Where 𝑋𝑋𝑖𝑖1,𝑡𝑡 denotes characteristics taken at time 𝑡𝑡 (the lagged characteristics), whereas 𝑋𝑋𝑖𝑖2,𝑡𝑡+1 denotes the non-lagged characteristics, which include characteristics of the school
48
School characteristics are taken at term t and are those of the school excluded from (if the pupil is permanently excluded), or otherwise the pupil’s main record school at census day.
SEN status
If pupils have BESD or SEMH category SEN and are in the Spring term of Year 9 or older, we use their SEN status in the Autumn term of Year 9. For other pupils we use their SEN status observed in the term prior to exclusion. Disruptive behaviour may in some cases prompt an assessment of underlying conditions, such as BESD or SEMH needs, which may manifest in this way hence higher exclusion rates may at least partly reflect identification of their needs. This reduces (although does not eliminate) the extent to which any identified differences in exclusions for these pupils will be purely reflective of differences in behaviour. At the same time, identifying SEN in Year 9 rather than earlier allows us to observe some pupils with SEMH, which is first observed in 2015 and not a SEN status for any pupils in our dataset at ages younger than Year 9.
Control variables
In the school characteristics model, we control for pupil and peer characteristics as well as many school variables, so that we are comparing exclusion rates for pupils with the same observable characteristics, with the same peer characteristics and at schools with the same characteristics as far as possible.
In the pupil characteristics model, in addition to controlling for these pupil level factors, we use two controls to reduce endogeneity. As we have already discussed, we are unable to control for the unobserved pupil behaviour. In an attempt to reduce the influence of this confounding factor, we control for the fraction of possible school
sessions a pupil misses due to unauthorised absence. We know that persistent absence is correlated with self-reported misbehaviour in class and risky behaviours in general so we believe this is the best available proxy for behaviour which is exogenous to
exclusions.
49
The analysis compared the prevalence of a range of risky behaviours in young people who reported playing truant to those who report no truancy. It provides evidence of association only. No attempt was made to look at causal relationships between these variables. The results are reported in the tables below.
[image:49.595.53.535.240.470.2]Around 7 in 10 young people (73.1%) who reported playing truant also reported one or more risky behaviours, compared to around 3 in 10 of those reporting no truancy (28.8%). Young people who reported playing truant were also more likely to report a higher number of risky behaviours than those reporting no truancy (table F).
Table F: Reported risky behaviours split by reported truancy
Row percentages
No risky
behaviours
1 risky behaviour
2 or 3 4 or more (max 7)
Total
No truancy 71.2 17.2 10.5 1.0 100.0
Played truant
26.9 20.8 39.4 12.9 100.0
Total 64.2 17.8 15.1 2.9 100.0
LSYPE2 wave 3 data: young people in Year 11, 2015. Weighted sample size = 9,332.
Corrected Pearson Chi-squared statistic F = 505, p<0.0005.
[image:49.595.57.536.623.744.2]Table G shows around 3 in 10 young people (29.3%) who reported playing truant also reported misbehaving in about half or more of their classes, compared to around 1 in 10 (7.9%) of those reporting no truancy.
Table G: Reported misbehaviour in class split by reported truancy
Row percentages
Misbehaves now
and then or not at all
Misbehaves in about half or more classes
Total
50
Played truant 70.7 29.3 100
Total 89.9 10.1 100
LSYPE2 wave 1 data: young people in Year 9, 2013. Weighted sample size = 11,658.
Corrected Pearson Chi-squared statistic F = 201, p<0.0005.
[image:50.595.61.533.64.119.2]Around 13 in 100 young people who reported playing truant had received additional support because of their behaviour. This compares to around 3 in 100 of those reporting no truancy (table H).
Table H: Additional support due to young person’s behaviour split by reported truancy
Row percentages
Not received
additional support
Received additional support
Total
No truancy 97.0 3.0 100
Played truant 87.4 12.6 100
Total 95.5 4.5 100
LSYPE2 wave 3 data: young people in Year 11, 2015. Weighted sample size = 8,876.
Corrected Pearson Chi-squared statistic F = 212, p<0.0005.
Overall the analysis showed that playing truant is associated with a range of behaviour related measures. However, it is not the case that the majority of young people who report risky behaviours, misbehaving in class, or who received additional support, also report playing truant. This is because the proportion of young people who report playing truant is low (around 16%), relative to the proportions reporting the various risky
behaviours.
51
excluding the pupil’s own exclusions. We believe this controls for general differences in school exclusion thresholds, so that modelled differences in exclusions between pupils with different characteristics do not just reflect the schools they attend. Put another way, we assume that there may be different approaches to bad behaviour, and this increases the likelihood of being excluded for some pupils because they attend a school with lower tolerance. If these pupil characteristics are correlated with school’s behavioural tolerance, the estimated coefficients would be biased. Therefore, we include number of fixed term exclusions at the school as a proxy for this tolerance.
We use fixed term rather than permanent exclusions as the number of permanent exclusions in a school in a term tends to be very low, if there are any so it is not a good differentiator. We note this is a control variable that which is likely to combine both the school’s discipline policy and the behaviour of its intake, so the modelled association with exclusion should not itself be interpreted.
These two controls are only included in a model of the relationship between pupil characteristics and exclusion as they may be endogenous to school characteristics. However, for the school characteristics regression, we are able to control for a pupil’s own absence and own fixed exclusions in Year 6, when they usually attend a different school.
In the school characteristics model, we want to estimate how the tolerance of bad
behaviour differs by school characteristics. If we were to include our proxy of behavioural threshold in this model, we would not identify any differences in exclusion by school type, under the assumption that schools only differ in their exclusion rates due to their
tolerance of bad behaviour and differences in their student population. We also do not control for pupil absence in the previous term because this may be endogenous with school type and use absence in Year 6 instead.
We do not control for other school level factors in the pupil specification as the only reason school characteristics should impact probability of exclusion is through the tolerance to bad behaviour. Once we account for behavioural tolerance, we should not need to account for additional confounders because they will only impact probability of being excluded through the impact on behavioural tolerance. However, in the school analysis, we seek to estimate the differences in tolerance by school type and therefore we include several observable confounders which account for the differences in pupil population of the school.
52
Variables
The following variables are included in all regressions:
• Pupil gender
• Pupil eligibility for Free School Meals (FSM)
• Pupil Special Educational Needs (SEN), combining both primary SEN type (e.g. Autistic Spectrum Disorder) and SEN provision (e.g. SEN Support).
• Pupil ethnicity
• Pupil speaking English as an Additional Language
• Pupil total Key Stage 2 points
• Number of schools pupil attended in the last nine terms
• Income Deprivation Affecting Children Index (IDACI) of the pupil’s home address: a measure of the level of deprivation in the pupil’s neighbourhood
• Whether the pupil’s school is urban or rural
• The region the pupil’s school is in
• The pupil’s term of birth
• The pupil’s school year (e.g. Year 11)
• The school term associated with this information
• The academic year associated with this information
The following variables are included only in the school characteristics regression:
• Fraction of available sessions the pupil missed due to unauthorised absence in Year 6
• Pupil’s number of sessions missed due to fixed period exclusions inYear 6
• Type of establishment of the pupil’s school
• Whether the pupil’s school is a faith school
• The fraction of pupils at the pupil’s school eligible for Free School Meals
• The fraction of pupils at the pupil’s school of each ethnicity
53
introduced in 2015-16: so schools are ranked within each year on either Attainment 8 or new style points
• Average Key Stage 2 results of Year 11 pupils at the pupil’s school
• The number of pupils in Year 11 at the pupil’s school
• The fraction of teachers who change at the pupil’s school in that year
• The fraction of teachers at the pupil’s school who are Newly Qualified Teachers (NQTs)
• The average years of experience of teachers at the pupil’s school
• The Ofsted overall effectiveness rating of the school
The following variables are included only in the pupil characteristics regression: