i
University of Southern Queensland
Faculty of Health, Engineering and Science
Develop Process Bus Architecture for
integrating sampled value IEDs
A dissertation submitted by
Luke W P Napier
In fulfilment of the requirements of
ENG4111/ENG4112 Research Project
Towards the degree of
Bachelor of Engineering (Power)
ii
Abstract
The recent interest within the power industry for the use of the IEC61850 standard has meant that the technology needed to implement this standard is at the forefront of most
manufactures development projects. The most recent development are for devices used to implement the process bus component of the standard, described in part 9 of the standard. The implementation of this new technology into a Distribution Network Service Provider’s substation has additional challenges compared to that of a Transmission Network service Provider.
The implementation of a process bus architecture is a significant change from the existing practice. The critical nature of the system in which this change is occurring means that the impact of the technology will be heavily scrutinised by end users. Two key technical issues were identified that would arise from the introduction of process bus technology into a substation.
The impact on the reliability of the system caused by replacing a simple connection practice between the instrument transformer and the protection relay with a communication network is one of the issues. Appropriately designing the process bus architecture by utilising
redundancy has provided a means so that the reliability of the process bus system exceeds that of the existing conventional system. The analyses of two-process bus architectures has been constructed as part of this project to demonstrate the reliability improvement.
The performance of the new devices introduced into the network needs to be understood so that any effect on the overall system is known. It has been identified that the merging unit that was tested as part of this project has shown a reduction in the performance of the analogue to digital conversion of measured data based on transient response criteria.
To describe the performance of a merging unit such that the end user can predict the output of the device for different inputs, a mathematical model was developed. This model is a second order transfer function approximation obtained from the transient response test results for a merging unit subjected to a DC step input. Minor gain errors were observed when testing the model with typical system signals such as the unsaturated sine waveform and a saturated CT waveform.
iii
University of Southern Queensland Faculty of Health, Engineering and Sciences
ENG4111/ENG4112 Research Project
Limitations of Use
The Council of the University of Southern Queensland, its Faculty of Health, Engineering
& Sciences, and the staff of the University of Southern Queensland, do not accept any
responsibility for the truth, accuracy or completeness of material contained within or
associated with this dissertation.
Persons using all or any part of this material do so at their own risk, and not at the risk of
the Council of the University of Southern Queensland, its Faculty of Health, Engineering
& Sciences or the staff of the University of Southern Queensland.
This dissertation reports an educational exercise and has no purpose or validity beyond
this exercise. The sole purpose of the course pair entitled “Research Project” is to
contribute to the overall education within the student’s chosen degree program. This
document, the associated hardware, software, drawings, and other material set out in the
associated appendices should not be used for any other purpose: if they are so used, it is
entirely at the risk of the user.
Prof Lyn Karstadt
Executive Dean
iv
Certification
I certify that the ideas, designs and experimental work, results, analyses and conclusions set out in this dissertation are entirely my own effort, except where otherwise indicated and acknowledged.
I further certify that the work is original and has not been previously submitted for assessment in any other course or institution, except where specifically stated.
Luke W P Napier 0050065124
______________________ Signature
v
Acknowledgements
This research was carried out under the supervision of Dr Tony Ahfock.
I would like to acknowledge and thank:
Alstom Grid for providing technical support throughout the project.
Robert Coggan (Engineering Manager Substation Standards) for the continual support and supervision in the test facilities.
vi
ABSTRACT ...II
CERTIFICATION ... IV
ACKNOWLEDGEMENTS ... V
LIST OF TABLES ... X
LIST OF FIGURES ... X
CHAPTER 1 ... 1
INTRODUCTION ... 1
1.1 EXISTING ERGON ENERGY ARCHITECTURE ... 1
1.2 DEVELOPMENT OF NEW TECHNOLOGY ... 2
1.2.1 Station Bus ... 3
1.2.2 Process Bus ... 3
1.3 PROJECT RATIONALE ... 4
1.4 PROJECT AIM ... 5
1.5 PROJECT METHODOLOGY ... 6
1.5.1 Process Bus Architecture ... 6
1.5.2 Sampled Values ... 6
CHAPTER 2 ... 9
LITERATURE REVIEW ... 9
2.1 RELEVANT STANDARDS ... 9
2.1.1 IEC61850 ... 9
2.1.1.1 Part 7 ...9
2.1.1.2 Part 9 ...10
2.1.2 IEC 61869 ... 11
2.1.3 Ergon Energy ... 12
2.2 MEASURED VALUES ... 13
2.2.1 Sampled Value ... 13
2.2.2 Current Transformer Models ... 15
2.3 COMMUNICATION NETWORK ARCHITECTURE ... 17
2.3.1 Network Designs ... 17
2.3.2 Process Bus Network ... 19
CHAPTER 3 ... 22
SECONDARY SYSTEM ARCHITECTURE ... 22
3.1 OVERVIEW ... 22
3.2 LVFEEDER PROTECTION ARCHITECTURE ... 22
3.2.1 Change In Architecture Impact Assessment ... 22
vii
3.2.2.1 Singly Attached Node (SAN) IED Redundant Network ...25
3.2.2.2 Doubly Attached Node implementing PRP (DANP) Redundant Network ...27
3.2.2.3 Doubly Attached Node implementing HSR (DANH) Redundant Network ...28
3.2.2.4 Combination of DANP and DANH Redundant Network ...30
3.2.2.5 Sensitivity Analysis ...31
3.3 ULTIMATE PROCESS BUS ARCHITECTURE ... 33
3.3.1 Conventional Substation Secondary System Architecture ... 33
3.3.1.1 LV Protection ...34
3.3.1.2 Transformer Protection ...36
3.3.1.3 HV Protection ...37
3.3.1.4 Complete System Availability ...39
3.3.2 Process Bus Substation Secondary System Architecture ... 39
3.3.2.1 General Characteristics ...39
3.3.2.2 Ultimate Process Bus Network Architecture 1 ...42
3.3.2.3 Ultimate Process Bus Network Architecture 2 ...43
3.4 SUMMARY ... 44
CHAPTER 4 ... 46
TECHNICAL SPECIFICATION OF THE SAMPLED VALUE METHODOLOGY ... 46
4.1 OVERVIEW ... 46
4.2 TEST APPARATUS ... 46
4.2.1 General Characteristics ... 46
4.2.2 Test Signal ... 48
4.2.2.1 Unsaturated Test Signal ...48
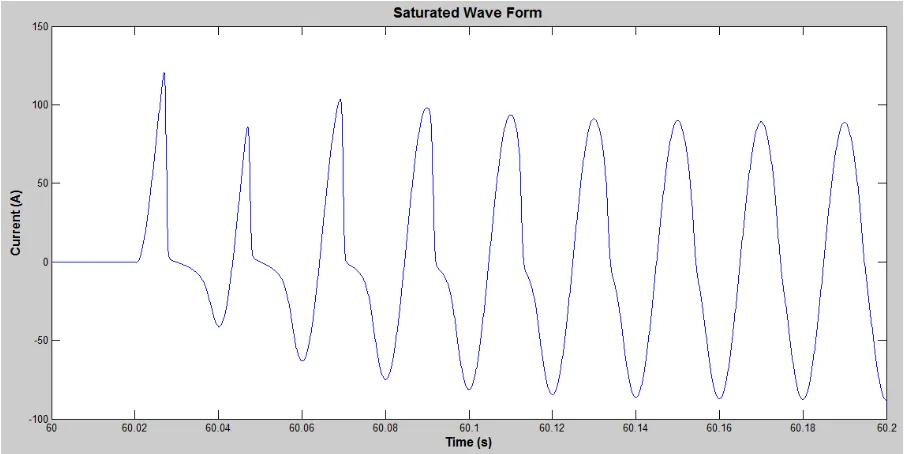
4.2.2.2 Saturated Test Signal ...49
4.2.2.3 DC Step Test Signal ...51
4.3 MERGING UNIT ... 52
4.4 TIME SYNCHRONISATION ... 57
4.4.1 Signals ... 57
4.4.2 Test Equipment ... 59
4.4.2.1 Doble F6150 ...59
4.4.2.2 Omicron CMC850 ...60
4.4.3 Tested Devices ... 61
4.4.3.1 Manufacturer “Y” Relay ...61
4.4.3.2 Manufacturer “X” Conventional relay...62
4.4.3.3 Manufacturer “Z” Process Bus Relay ...62
4.4.3.4 Manufacturer “Z” Analogue Merging Unit ...63
4.5 SUMMARY ... 64
CHAPTER 5 ... 65
SAMPLED VALUE PERFORMANCE CHARACTERISTICS ... 65
viii
5.2 CURRENT TRANSFORMER PERFORMANCE ... 66
5.2.1 Current Transformer Theory ... 66
5.2.2 Current Transformer Model ... 68
5.2.3 Impact of the New Technology ... 69
5.3 CONVENTIONAL RELAY PERFORMANCE ... 70
5.3.1 General Characteristics ... 70
5.3.2 Manufacturer “Y” Protection Relay ... 72
5.3.3 Manufacturer “X” Protection Relay ... 74
5.3.4 Conventional Relay Result Comparisons ... 75
5.4 PROCESS BUS PERFORMANCE ... 76
5.4.1 General Characteristics ... 76
5.4.2 Manufacturer “Z” Analogue Merging Unit ... 77
5.4.3 Manufacturer “W” Ethernet switch ... 79
5.4.4 Manufacturer “Z” Protection Relay ... 80
5.5 SUMMARY ... 82
CHAPTER 6 ... 84
ANALOGUE MERGING UNIT TRANSFER FUNCTION ... 84
6.1 OVERVIEW ... 84
6.2 DCSTEP RESPONSE... 85
6.3 FREQUENCY RESPONSE ... 88
6.4 IMPULSE RESPONSE ... 89
6.5 SUMMARY ... 90
CHAPTER 7 ... 93
CONCLUSION ... 93
7.1 PROJECT SUMMARY ... 93
7.1.1 System’s Availability ... 93
7.1.2 System’s Performance ... 94
7.2 FURTHER WORK ... 96
7.2.1 Process Bus Architecture ... 96
7.2.2 Developing a Mathematical model for a merging unit ... 96
7.3 MERGING UNIT ASSESSMENT ... 96
REFERENCES ... 97
APPENDIX A: PROJECT SPECIFICATION ... 100
APPENDIX B: CHAPTER 3 AVAILABILITY CALCULATIONS ... 101
APPENDIX C: AVAILABILITY BLOCK DIAGRAM FOR SECTION 3.3.2.2 ... 108
ix
APPENDIX E: VBA CODE FOR SAMPLED DATA CONVERSION ... 110
APPENDIX F: TEST PLAN CONNECTION DIAGRAMS ... 112
APPENDIX G: CURRENT TRANSFORMER MATLAB® MODEL ... 114
APPENDIX H: FREQUENCY RESPONSE BODE PLOT ... 116
x
List of Tables
Table 1 – Reliability data for components of a protection system (Tournier & Werner, 2010) (Schweitzer, et al., 1997) (Institute of Electrical and Electronics Engineers, Inc., 2007) ... 24 Table 2 – Manufacturer “Z” merging unit step test recorded data ... 78
List of Figures
Figure 1 – Conventional connection between primary plant and secondary equipment 2 Figure 2 – Connection and signal flow diagram for the test methodology 8 Figure 3 – Relations between modelling and mapping parts of the IEC 61850 series (International
Electrotechnical Commission, 2013) 9
Figure 4 – Simplified Operating Single Line Diagram of Oonoonba Substation 13 Figure 5 – Simplified block diagram of a merging unit (Vandiver & Apostolov, 2006) 14 Figure 6 – Analogue signal phase shift due to not compensating for the delay (Vandiver &
Apostolov, 2006) 15
Figure 7 – Current Transformer model referred to the secondary side (Noshad, et al., 2013) 16
Figure 8 - Series Reliability Block Diagram 17
Figure 9 - Parallel Reliability Diagram 18
Figure 10 – Star and Ring Network Topology for Process Bus of a Single Bay (Tournier & Werner,
2010) 20
Figure 11 – LV Feeder Secondary System Network Architectures 23 Figure 12 – LV Feeder Process Bus Network Redundancy Architecture 1 26 Figure 13 – LV Feeder Process Bus Network Redundancy Architecture 2 26 Figure 14 – LV Feeder Process Bus Network Redundancy Architecture 3 27 Figure 15 – LV Feeder Process Bus Network Redundancy Architecture 4 28 Figure 16 - LV Feeder Process Bus Network Redundancy Architecture 5 29 Figure 17 - LV Feeder Process Bus Network Redundancy Architecture 6 29 Figure 18 – LV Feeder Process Bus Network Redundancy Architecture 7 30 Figure 19 – Process flow diagram for assessing the sensitivity of the Merging Unit’s MTBF on the
network’s availability 32
xi Figure 22 – A Conventional LV Bus section’s protection connection diagram 35 Figure 23 – Ultimate substation’s LV secondary system availability block diagram 36 Figure 24 – A Conventional transformer’s protection connection diagram 37 Figure 25 – Conventional HV Feeder’s protection connection diagram 38 Figure 26 - Conventional HV Bus secondary system’s protection connection diagram 38 Figure 27 – Placement of Merging Units within the Ultimate Substation Layout 40 Figure 28 – Protection Relays dependency on a particular Merging Unit 41 Figure 29 – Ultimate Process Bus Architecture based on Section of the Primary System 42 Figure 30 - Ultimate Process Bus Architecture based on Segregating Main and Backup Protection
44
Figure 31 – Doble F6150 User Interface Panel Layout 47
Figure 32 – Omicron CMC850 User Interface Panel Layout 47
Figure 33 – State Simulation settings for an unsaturated test signal 48
Figure 34 – Unsaturated Test Signal 49
Figure 35 – Saturated Test Signal 51
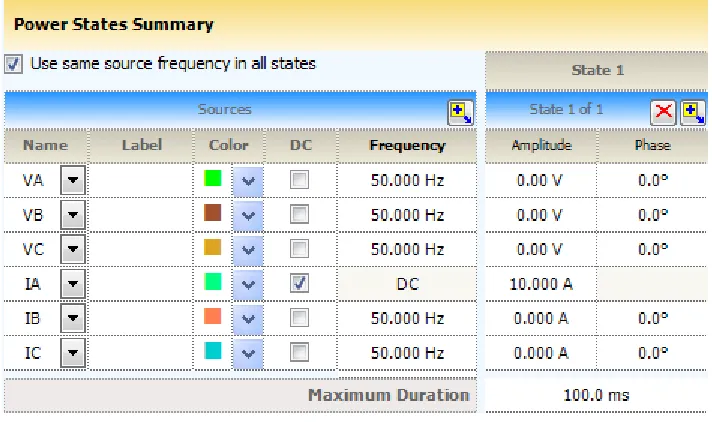
Figure 36 - State Simulation settings for a DC Step test signal 52
Figure 37 – DC Step Test Signal 52
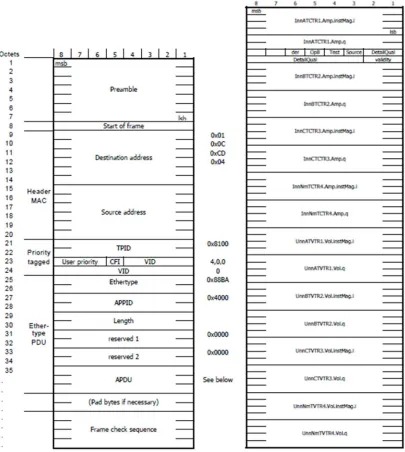
Figure 38 – Content of a Sampled Value messages Ethernet frame and Data set 53
Figure 39 – Wireshark Capture of a Process Bus Network 54
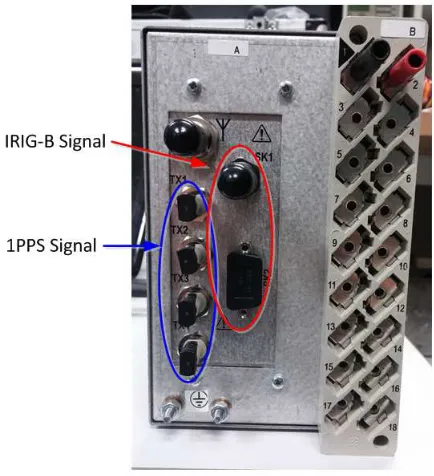
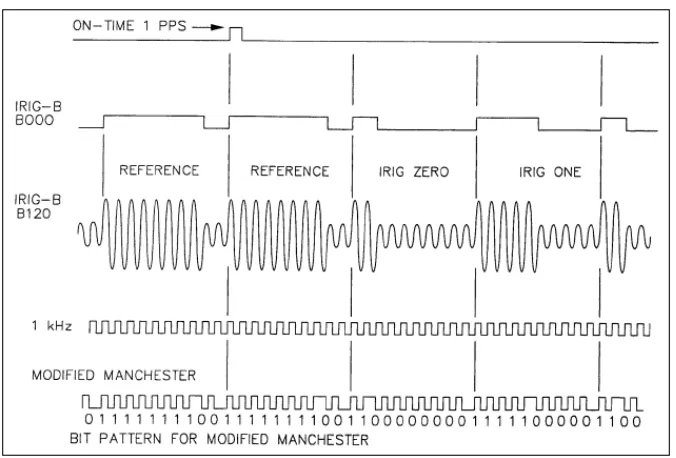
Figure 40 – Program flow diagram for sampled value data conversion 56 Figure 41 – Alstom MiCOM P594 Interface panel for time Synchronisation signal outputs 57 Figure 42 – IRIG-B signal modulations (Timing Committee Telecommunications and Timing
Group Range Commanders Council, 2012) 58
Figure 43 – Conformation Test result for the MiCOM P546 IED 58 Figure 44 – Doble F6150 Test Signal’s start time confirmation test result 59 Figure 45 – Omicron CMC850 Test Signal’s start time confirmation test result 60 Figure 46 – Results of multiple test for Manufacturer “Y” relay showing time stamping
comparison 61
Figure 47 - Results of multiple test for Manufacturer “X” relay showing time stamping
comparison 62
Figure 48 - Results of multiple test for Manufacturer “Z” relay showing time stamping
comparison 63
Figure 49 - Results of multiple test for manufacturer “Z” merging unit showing time stamping
comparison 64
xii Figure 52 – Secondary current with respect to secondary burden change 70
Figure 53 – Conventional relay information flow diagram 71
Figure 54 – Effect of the relay’s input transformer on the output data 71 Figure 55 – Clipped Manufacturer “Y” waveform due to input exceeding 64pu peak to peak 72 Figure 56 – Transient response of the manufacturer “Y” protection relay for a DC step input 73 Figure 57 - Transient response of the manufacturer “X” protection relay for a DC step input 74 Figure 58 – Average waveform comparison for the Manufacturer “Y” and Manufacturer “X” 76 Figure 59 - Transient response of the Manufacturer “Z” merging unit for a DC step input 78 Figure 60 – Comparison of test results for a process bus network with different connections 79 Figure 61 – Effect of the reduced sampling rate between the merging unit and the protection
relay 81
Figure 62 – Manufacturer “Z” relay transient response to a step input 82 Figure 63 – Simplified block diagram for information flow in a merging unit 84
Figure 64 – Underdamped system parameters (Norris, 2009) 85
Figure 65 – Doble DC step test signal oscilloscope recording 86
Figure 66 – Step input Simulink model extract 87
Figure 67 – Comparison of the model out vs actual test data 87 Figure 68 – Frequency response test results in a gain and phase bode plots 88 Figure 69 Gain plot of the transfer function based on the Zeros and poles of the test data gain
plot 89
Figure 70 – Impulse response of the Alstom MU Agile 90
Figure 71 Unsaturated waveform results 91
Figure 72 Saturated waveform results 92
Figure 73 – Conventional Relay Base test connection diagram 112 Figure 74 – Process Bus Devices including an Ethernet Switch test connection diagram 112 Figure 75 – Process Bus devices excluding an Ethernet switch test connection diagram 113
Figure 76 – Process Bus relay test connection diagram 113
1
Chapter 1
Introduction
1.1
Existing Ergon Energy Architecture
Ergon Energy as a Distribution Network Service Provider (DNSP) is responsible for constructing and maintaining electrical assets to supply electricity to both low and medium voltage customers in Queensland. Zone Substations are a combination of various pieces of primary plant such as circuit breakers, transformers and secondary system equipment such as protection relays, local control facilities to transform the voltage levels to distribute power. These substation are key infrastructure to provide connection from a Transmission Network Service Provider (TNSP) i.e. Powerlink Queensland, to distribute electricity efficiently to a geographically disperse customer base.
Australian Energy Regulator (AER) and the Australian Energy Market Commission (AEMC) set the requirements of the DNSP. The criterion focuses on the reliability and safe operation of the electrical network. Therefore, to operate the network to comply with the criteria, Ergon Energy has continually improved their technology and infrastructure.
The secondary system equipment is responsible for the general control of the primary plant, for example regulating the system voltages. The secondary system is also tasked with maintaining the safe operation of the network by isolating a faulty part of the electrical network. The connection between the two systems has not changed significantly since the conception, with the use of copper wiring connecting directly between two points.
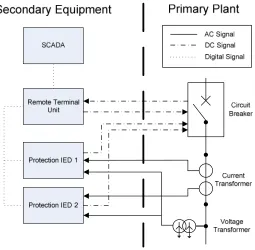
2 Figure 1 – Conventional connection between primary plant and secondary equipment
The digital signal part of the architecture consists of the transmission of information gathered via the IEDs through a remote terminal unit (RTU) to be made available on SCADA. The technology that is within the zone substation has allowed more information to be available to remote control centres to monitor the network’s condition. An example of this would be power flow during planned or unplanned outages on the network. Having the visibility of power flow and ratings of the primary plant allows the remote operator to open or close switches within the network so that the system operates safely within its limit.
In summary, the architecture that is presently deployed into Ergon Energy’s network is a mixture of protocols and limited in its distribution of measured values from a particular instrument transformer, as will be discussed later on.
1.2
Development of new Technology
3
1.2.1
Station Bus
The Station Bus conveys control and condition messages between the secondary system equipment. Information such as open/close indication from circuit breakers and information from Protection IEDs to remote locations through SCADA are typical communication signals assigned to Station Bus. The majority of the signalling that is transported over this level already exists in a non-proprietary communication medium, which therefore can be deemed common practice. The Digital and some DC signals shown in Figure 1, which illustrates the conventional system connections, will be replaced by Station Bus architecture.
The advancement and use of this technology is already being implemented within the power industry. The deployment of this technology is due to the overlying architecture being very similar to that of the existing practices. The introduction of primary plant, which publishes condition-based information in a digital format, meant that having a system that can transmit this information would have known quantifiable benefits.
A single communication protocol with the main advantage of interoperability such as IEC 61850 is the reason for equipment with these abilities being developed. It can be noted that the equipment that is being developed is predominately the same with the addition of a module to allow an IEC 61850 communications capabilities.
Interoperability at the station bus is the main driver for the introduction of IEC 61850. The ability at this level to be interoperable has not been as complex due to the information that is being transmitted. Different manufactures using this information are not using proprietary algorithms that are dependent on the quality of the information.
1.2.2
Process Bus
Process Bus is used to transport the measured values taken by an instrument transformer and other primary plant condition status over a communication medium to an IED. The conventional medium for the transportation of this information is via a copper wire connected directly between the two devices.
The measurement process within a substation’s protection system is typically made up of three (3) components:
1. Transformation
4 The first component is completed by a conventional instrument transformer to a level that can be used by sensitive equipment. This information is then transported to a device that converts the signal to a format that can then be used in the following component. With the introduction of numerical relays, the signal would need to be in a digital format. The numerical relays then implement a protection algorithm specific to the information that is available to identify when there is a system abnormality.
The conventional system has had both the second and third component built into the same IED. The new technology is now moving the second component physically closer to the first. The measured values are now being sampled by an IED separate to the protection relay. The new IED then broadcasts the measured values now referred to as “Sampled Values” onto a communication bus (Process Bus) for protection IEDs to use.
Although the end-to-end measurement process has not changed, the connection between each component will with the introduction of IEC61850-9-2. The protection system is critical to ensure the safe operation of an electrical network and any change to this system is heavily scrutinised. Interoperability of the Process Bus is quite complex due to the requirement of the sampled value. Presently the protection relay is only responsible to sample the analogue signal to ensure the correct operation of its own protection algorithm. The system’s interoperability means that different manufactures protection IEDs will need to be able to use sampled values from other manufacturer’s IEDs to function correctly.
1.3
Project Rationale
5 Ergon Energy’s network has evolved over time; this included the development of the company’s protection standards to comply with Australian standards and regulatory requirements. Ergon Energy’s network consists of a number of substations that have limited protection schemes and aging protection relays. Given the expected life of a protection relay is less than half that of the primary system means that during the substation’s life cycle the protection systems will be replaced and need to utilise existing measurement equipment.
The technology presently used to replace the protection relays has particular requirements of the instrument transformers. These requirements limit the ability of the instrument transformer to share the measurement to allow additional protection schemes to be implemented without the need to make changes to the instrument transformer. Development of technology such as process bus, which allows measured values to be shared amongst multiple intelligent devices, provides an engineering solution to remove the limited protection scheme issue within Ergon Energy’s network.
1.4
Project Aim
The aim of this project is to objectively assess the impact of introducing process bus into Ergon Energy’s substations. This assessment will include two main components of a process bus system: Network Architecture and Sampled Values.
The network architecture for process bus has a direct impact on the operation of the protection system within the Ergon Energy substation. The adoption of such a network would be a significant change from what is presently installed: hardwired connection between the instrument transformer and the protection IED. The process bus architecture is a communication network and therefore has the flexibility in the topology due to the introduction of new redundancy communication protocols. The aim of this section of the project is to assess the possible topologies to understand:
• a comparison to the conventional architecture • how improvements can be made
6
1.5
Project methodology
Process bus is still in development with very few known systems that have been implemented. The two main parts to process bus are Sampled Values and the Communication Network. The project will look into both parts analytically and practically where possible due to limited accessibility to IEC61850 process bus compliant equipment.
1.5.1
Process Bus Architecture
The methodology adopted for determining the architecture of the process bus network for a recently commissioned Ergon Energy substation in a staged process. The initial stage of the assessment will isolate a section of the ultimate arrangement so that a strategy can be developed to apply to a larger scale. The criteria to which this will be assessed, is based on the comparison of the reliability and availability of the existing versus the new architecture.
The assessment will use the proven methodology of IEEE 493 standard by deriving reliability and availability block diagrams and then simplifying down to single block. Although this methodology is proven, the extension of this to the next stage of applying to the ultimate arrangement with the integration of multiple smaller networks to construct the total network will require the development of a new process to assess the network.
The ultimate arrangement will then require a number of topologies to be assessed to fully understand the advantages and disadvantages of each topology. The topologies will be based on the learnings from the isolated case.
The final architecture is then to be deconstructed so that using the logic used to develop it that smaller blocks can be created. These smaller blocks can then be used to implement the process bus architecture for different substation configurations.
It should be noted that this methodology would only be completed analytically, as the hardware that is IEC61850 compliant presently does not support any redundancy protocol.
1.5.2
Sampled Values
7 To understand the change in the systems performance it required an assessment of conventional protection relays and the new process bus devices. The tests were carried out using following equipment:
Test Equipment
• Doble F6150 Power System Simulator – This device has been used to provide the analogue test signal
• Omicron CMC850 – This device has been used to provide the sampled value test signal • SAT Sync test kit – This was used to provide a GPS signal to the Doble F6150 for time
synchronisation
• ALSTOM MICOM P594 – This device produces IRIG-B and 1 Pulse Per Second signalling to be used in the tested devices for time synchronisation.
• Personal computer – This is used to control the test, communicate with relays and capture test data
Test Software
• MATLAB® R2013b – This software was used to produce the saturated second test signal
• Microsoft Excel 2013 – This software converted the MATLAB® saturated waveform model output into COMTRADE format for use in the test device.
• Protection Suite v2 – This software controls the Doble F6150 • Test Universe – This software controls the Omicron CMC850 • Manufacture “X” configuration software
• Manufacture “Y” configuration software • Manufacture “Z” configuration software
• Wireshark v1.8.15 – This software captured the sampled value messages on the network
Tested Devices
• Manufacture “X” relay- This is a conventional multifunction relay • Manufacture “Y” relay - This is a conventional multifunction relay
• Manufacture “Z” merging unit – This is an analogue merging unit compliant with IEC61850-9-2LE
8 • Manufacture “W” Ethernet Switch – This device allowed the establishment of a
process bus.
To derive the impact of each device and it’s response to different inputs, four different test plans were required. The following are the test name and the general purpose:
• Conventional Relay Base Test – Determine the system response of a conventional relay.
• Process Bus Devices including Ethernet Switch Test - Determine the system response of the Merging unit and Process Bus relay. Record the response with the sample values having to pass through an Ethernet Switch.
• Process Bus Devices excluding Ethernet Switch Test - Record the response with the sample values not having to pass through an Ethernet Switch to then compare with other test results to determine the delay created by an Ethernet switch.
• Process Bus Relay Test – Use generated sample values to assess the system response of the Process Bus relay.
Each test was subject to three different types of types signals: • Unsaturated single phase current input
[image:20.595.208.458.493.754.2]• Saturated single phase current input • DC Step single phase current input
Figure 2 below is a signal flow diagram that has summarised all four tests into one diagram.
9
Chapter 2
Literature Review
2.1
Relevant Standards
2.1.1
IEC61850
2.1.1.1
Part 7
The IEC61850 standard consists of a number of parts to address different applications of this communication standard. The standard was developed to address a number of communication requirements between IEDs to improve the automation and interoperability of devices within a substation. Figure 3 below has been taken from IEC 61850-7-1 section 5 that describes the overview of the 61850 series concepts.
10 Part 7 is primarily focused on constructing data models for transportation of information over the station bus whilst maintaining the conventional connection between the instrument transformers and protection relays. The critical information that is discussed within part 7 of the series is the introduction of logical nodes and the naming convention associated with the functionality of the node. Throughout Part 7, there is regular reference to a communication path for condition and control signalling for primary plant using Generic Oriented Object System Event (GOOSE) data structure to assist with determining priority.
With reference to a number of manufacturers, these GOOSE messages are used by IEDs referred to as bay controllers to perform logical actions. The location of these bay controllers has led to the development of IEDs that accept both station and process bus information. For the purpose of this dissertation, it will be assumed that these forms of communication will occur over physically separate communication mediums.
2.1.1.2
Part 9
The transportation of measured values from the instrument transformer to an intelligent electronic device is the reason for the development of Part 9 of the IEC61850 standard. The concept of Specific Communication Service Mapping (SCSM) set outs the data structure for transporting sample values was defined within this part. This standard is targeted to set key requirements of components within the process bus of the substation automation.
Implementation of this standard has brought about discussions within the industry to refine the standard. Through industry workshops, an IEC61850-9-2LE version or also known as Implementation Guideline for Digital Interface to Instrument Transformers Using IEC 61850-9-2
was published. In this publication, the areas that were targeted towards the implementation of this standard have been addressed.
11 Although the standard has worked to develop the data structure and key requirements such as sample rates that ultimately effect the process down the chain, it still lacks more detail as to the application. The sampling frequency is only one criterion that can define the quality of the information that is to be received by an IED to use. Other criteria such as resolution, peak range and any filtering performed prior to the conversion would be needed to allow full interoperability. This will be discussed later in the dissertation.
2.1.2
IEC 61869
The implementation of process bus has a significant impact on the protection and metering system of the substation. The IEC61869 standard is in place to define the technical requirements for instrument transformers, which includes their performance and test requirements. The key component of the systems mentioned is their associated instrument transformers; the IEC61869 series is in the process of being extended to included two additional parts to cover the introduction of IEC 61850. These two parts are:
IEC 61869 Instrument Transformers - Part 9: Digital Interface for Instrument Transformers IEC 61869 Instrument Transformers - Part 13: Standalone Merging Unit
Part 9 is presently in draft release that allowed a copy to be obtained for review from a standards body within a particular country. A review of this standard has reproduced the development of IEC61850-9-2LE version that looked more into the requirements of the logical devices. By defining specific technical requirements based on their application is important to allow different manufactures to develop such devices.
12
2.1.3
Ergon Energy
Developing a standard design will ensure that what is designed and constructed will consistently comply with Australian standards, AER and AEMC within Ergon Energy’s network infrastructure. The company standards in all cases either meet or exceed legislative requirements, these requirements are typical safety clearance or ratings.
The introduction of sampled values and process bus architecture into the substation will have considerable impact on the protection and metering standards. Within the standards, they clearly define the requirements of the equipment. The protection standards STNW1002 – Standard for Substation Protection defines the requirements of the protection systems for Ergon Energy assets.
The architecture has been defined based on the use of either “X” and “Y” or “Main” and “Backup” configuration to support the criticality of the asset that was being protected. The connection of these configurations is predominantly independent of one and other. This means that each protection scheme requires separate instrument transformers, protection relays, DC supplies etc. The duplication is to ensure that in the event of a common mode failure of an individual part it does not compromise the overall system; an example of this is to use different relay manufacturers.
The protection system is not only designed to isolate a faulty part of the network but also to reduce the number of customers impacted by the fault. The protection system may cover a larger customer base, in particular for back up protection that may rely on a remote location to isolate a fault in the event of the primary protection failing to operate.
The development of the process bus architecture must demonstrate that the reliability and availability of the system is adequate to be implemented as a company standard. The rules set throughout the existing standard in reference to main and back up protections will be maintained within the development of the new architecture.
13 A simplified single line diagram showing the primary system’s connection can be seen in Figure 4 .This single line diagram will be used to develop the ultimate arrangement of the proposed process bus architecture and allow for comparison of the two systems.
Figure 4 – Simplified Operating Single Line Diagram of Oonoonba Substation
2.2
Measured Values
2.2.1
Sampled Value
14 A recent paper by Alexander (2010) stated important differences between the sampled data presently being performed in a numerical relay and that of a merging unit. These were:
• While in the relays the sampling is controlled by the IED and is usually using frequency tracking, in IEC 61850 all interface or merging units are time synchronised with an accuracy better than 1 microsecond and use a fixed number of samples per cycle at the nominal frequency
• The sampled values in the IED are exchanged directly between the A/D converter and the processor, while IEC 61850 they are transmitted using typically multicast from the merging unit(publisher) to all IEDs (subscribers) that need these sampled values • The sampled values in IEC are primary quantities
This author has thought about the differences in the transportation of these measurements rather than the measurement itself. Given the process in which a sample is taken can ultimately influence the system’s design to use it; this brings about the appreciation of this impact. Alexander (2010) and Benton & Alexander (2006) discussed the impacts that a merging unit could have on the system using measured values. The introduction of the merging unit meant that, protection device which were dependant on a number of measured values would be receiving sampled data from multiple merging units. Benton & Alexander (2006) proposed a simple block diagram showing the process within a merging unit, which can be seen in Figure 5. The delay within this system has the potential to impact on a protection schemes that are dependent on a number of sampled values. Also extracted from the same paper is an illustration of this delay as shown in Figure 6, if poorly dealt with it could be seen as a phase shift.
15 Figure 6 – Analogue signal phase shift due to not compensating for the delay (Vandiver & Apostolov, 2006)
Throughout my review I had found a number of articles which analysed the use of non-convention instrument transformers and very few for the implementation of analogue merging units. The impact studies that showed how the introduction of the merging unit had on the change in requirements of the primary systems would only be included as an insert similar to section 3 of IEC 61850 Process Bus benefits of IEC 61850 9-2 Process Bus Applications and Benefits. A. Apostolov (2010) discusses the removal of the lead resistance from the secondary burden due to the merging unit being located near to the instrument transformer.
The literature review identified that there is limited information regarding the impact of the sampled data resolution on the protection device. Given the difference in present practices of different relay manufacturers, these sampled value qualities have the ability to impact on the interoperability of the IEC61850 standard.
2.2.2
Current Transformer Models
The measured value that is produced by the instrument transformer is critical in determining the performance requirements of the secondary systems. The performance criteria for new instrument transformers are dictated by the requirements of the intelligent devices, which uses the measurement. Existing substations where the secondary systems are to be replaced are governed by the existing primary plant’s performance qualities.
16 Amongst the journals that were reviewed, Noshad, et al. (2013) illustrated the model in a simplistic form that connected the system to a current source, which is equivalent to the primary side being replicated ideally on the secondary side of the current transformer as shown in Figure 7. The key feature is the identification of the non-linear inductor for the magnetising arm of the transformer and the introduction of the magnetising current (iµ).
Figure 7 – Current Transformer model referred to the secondary side (Noshad, et al., 2013)
Noshad, et al. (2013) went on to develop a MATLAB® model based on the relationship of the flux linkage and magnetising current. To determine the relationship that this model was based on, the information regarding the material with which the current transformer was constructed of and the way in which it was constructed is required.
In January 2000, Working group C-5 of the Systems Protection Subcommittee of the IEEE Power System Relaying Committee published a paper Mathematical Models for Current, Voltage, and Coupling Capacitor Voltage Transformers. This paper explored the use of existing Power System Simulation software, such as Electromagnetic Transients Program (EMTP) to determine guidelines for the physical elements within an instrument transformer that are impacted by transient conditions. This paper is similar to the previous paper, as it too required specific construction details about the current transformer to complete the model.
17 The review of the information within this model, which refers to as an IEC Version referencing IEC 44-1 First edition 1996-12, has revealed that it was developed to use data known about a “P” class current transformer. Within Ergon Energy and for the purpose of this dissertation a “Px” class current transformer is to be used. The accuracy of the model for the purpose of this project is not significant and that the error will be common to all analysis.
The review of literature available for developing a mathematical model for a current transformer has been covered extensively. The area with which for the purpose of my dissertation is lacking and that there is no clear literature covering the application that is needed.
2.3
Communication Network Architecture
2.3.1
Network Designs
Oxford University Press (2014) defines “Network” as “A group or system of interconnected people or things”. The design of a network is determined by the application and its dependencies. Two networks that have similar application and dependencies would be the electricity and telecommunication networks. Both of these networks are critical to the way in which society can function in today’s environment. Therefore, government agencies or regulators place certain conditions on the availability of these networks.
To assist with designing reliable networks the industry working groups develop standards that assist these companies to comply or improve the way in which they design and construct their infrastructure. One such guide was developed by the Institute of Electrical and Electronics Engineers (IEEE) to assist the power industry; this was IEEE Recommended Practice for the Design of Reliable Industrial and Commercial Power Systems. Of particular use is “Chapter 2 Basic concepts of reliability” that sets out the terminology, common equations and relationships for reliability evaluations. These evaluations included the construction of either an Availability or Reliability Block Diagram. With these diagrams, the system can be simplified or altered to determine the impact or overall reliability of a complex network. The reduction of a whole system to a single block is process to determine the reliability of a system. The reduction method is best represented by the basic operation of reducing two nodes into one, with two initial configurations of nodes in either series or parallel as shown in Figure 8 and Figure 9 respectfully.
18 Figure 9 - Parallel Reliability Diagram
Simplifying Figure 8 could be done two ways; the preferred method is to multiply the availability values of each block in series by each other, as per equation (2-1). Simplifying Figure 9 is a little more complicated with the need to determine the probability when both branches will fail. To determine the probability of failure (POF) for a single branch is done using equation (2-2) and then multiply the result for each branch, in this case they are identical, to get the probability of both branches failing at the same time. The availability of the system is then obtained by using equation (2-3.
௦௦
ୀ
(2-1)
1- (2-2)
1-( ଵ× ଶ) (2-3)
The application of this type of analysis on a communication network has been best shown by Babbitt & Pollock (2008). Their analysis was conducted on the topology of telecommunication service providers. They started by explaining the need for such an assessment with the introduction of availability being specified in Service Level Agreements (SLAs).
Babbitt & Pollock (2008) introduced the methodology of accessing the topology of a communication network. Throughout the journal, it focuses mainly on the availability, which used an equation that was also stated in IEEE 493 guide, this equation required two parameters of the system to determine the availability of a single component within the system. These parameters are; Mean Time between Failures (MTBF) and Mean Time to Repair (MTTR). Equation (2-4) is the combination of these variables to determine the availability. This paper then discusses the impact these variables have and the way in which a design could improve availability of the network. The concept to take from this is that with an increase in MTBF there will be an increase in Availability, an increase in MTTR results in a decrease in Availability.
19 The variation in topology that is available to this type of communication network has been assessed to derive a function, which approximates the cost per 9’s. 9’s is the terminology given to the reliability of the system, in their journal it is stated that the required number of 9’s was four. There were no discussions of communication protocols that could limit the way in which the network nodes can be connected to each other, this limited the use of a similar type of topology for the Process Bus communication network.
The technical journals that assessed the reliability design for common networks shows well-structured procedures however, they lacked the direct application to this project. The reliability and availability assessment is relevant and will be adopted in this project to assess the process bus network.
2.3.2
Process Bus Network
Process bus network plays a significant role in transportation of sampled values enabling the operation of a substation. The key dependants of this information are the protection relays. These devices are part of safety system that is governed by the National Electricity Rules. The system that this bus network is designed to replace is an analogue system that in a traditional application is well known and is a proven method. Therefore, the conversion to a new architecture that is communication based will be heavily scrutinised.
Similar to other networks that were discussed in section 2.3.1 the process bus network is best described by its reliability and availability. To improve the networks reliability and availability the design would incorporate a level of redundancy to reduce the probability of failure to the network. This redundancy is not only considered by the communication paths but also the hardware that is connected.
20 The reliability of the network topology is dependent on how it functions when there is a failure of one component. RSTP is effective for implementation in a typical Ethernet network however; the process bus has a time requirement. A typical RSTP time to restore the redundant path is dependent on the size and complexity of the network but typically can be in the order of over 100ms and very rarely around the low millisecond range. The process bus typically functions on a time precision in the order of microseconds, therefore it can be seen that this protocol does not provide adequate redundancy.
The IEC have published IEC62439 Industrial communication networks – High availability automation networks to define the protocols to address the need for reliability protocols for substation automation. In particular, Part 3 of the series is designed specifically for the application of IEC61850-9-2. The two protocols are Parallel Redundancy Protocol (PRP) and High-availability Seamless Redundancy (HSR). The two protocols are used for star and ring topologies respectively, with no time required for the system to correct itself in the event of a failure within the network.
Figure 10 – Star and Ring Network Topology for Process Bus of a Single Bay (Tournier & Werner, 2010)
21 The PRP messages are sent on two separate networks wether this is via physical or virtual separation. In the case of the process bus, the merging unit would send a sampled value message with a prescribed header as per the protocol standard out of each port. Another device, in this case a protection relay with redundant ports, would receive the same message in each port and with an appropriate algorithm be able to reject the duplicate message. Hence, if there is a failure on one network the system is able to continue without interruption.
HSR protocol as previously mentioned is used in a ring type topology. To create the ring all devices are required to have redundant ports as described for a doubly attached node. Using the process bus as an example to describe how this protocol works we start with the merging unit. The merging unit sends a sampled value messages each with the same information with the appropriate suffix out of each port. If a device such as a protection relay, which has subscribed to this sampled value stream, will need to use an algorithm to eliminate the duplicate message.
The other devices in the ring are required to ensure that the message continues around the ring so that all devices see both messages. Therefore, the message is maintained all the way around the ring and then rejected once the sender receives the message on the other port. This has meant that a ring type network has twice as much traffic.
22
Chapter 3
Secondary System Architecture
3.1
Overview
The secondary system architecture has a number of components. These components are responsible for conveying information between different devices to monitor and control the primary system. The introduction of Process Bus as part of the IEC 61850 standard has brought about a new way of conveying that information.
The component of the secondary system that this project is assessing is in respect to the transportation of the measured value. This value has been transformed by a conventional instrument transformer to a level that can be used in sensitive electronic devices. The change to this component is that what is presently being done via a hardwired connection will now be replaced by a communication network.
It should also be noted that the term LV has been used to describe the low voltage plant in a substation. This could be either 11 or 22kV within an Ergon Energy substation. The HV plant has a voltage rating of 33kV, 66kV, 110kV or 132kV.
3.2
LV Feeder Protection Architecture
3.2.1
Change In Architecture Impact Assessment
The LV feeder bay’s secondary system network architecture has been selected to perform a case study to assess the impact of the new network architecture. The case study will observe the impact that changing from the conventional hardwire point-to-point system to a
communication-based system has on the secondary system’s availability.
23 Figure 11 – LV Feeder Secondary System Network Architectures
The process bus system shown in Figure 11 consists of four (4) new components, these are: • Merging unit (MU) – Creates the Sampled Values (SV) to be published on the Process
Bus
• SV Access Ethernet switch – Used to collate multiple SV data streams to be distributed over the Process Bus network
• IED Access Ethernet Switch – Used to allow multiple protection IEDs to access the Process Bus network
• Fibre Optic (F/O) cable – Used for the connection of all the electronic devices communication paths
Both the MU and F/O cables are common to all Process Bus network architectures. The Ethernet switches are considered variables within the construction of the network architecture. The selection of this equivalent network architecture in Figure 11 incorporates a number of assumptions:
• The Sample Values will be shared amongst multiple subscribing protection IEDs • A separate Ethernet switch will be used for connecting MUs and Protection IEDs to the
24 Assessing the change in the system’s availability will determine the impact that the changes to the system’s components has had. Tournier & Werner (2010) and Schweitzer, et al. (1997) both completed a similar type assessment on different process bus architectures, these assessments required knowledge of the MTBF for each component within the system. Table 1 below is a collation of data from these journals and IEEE 493 for the MTBF of components for both systems. The MTTR in Table 1 has been estimated based on:
• The criticality of the system
• The ability of Ergon Energy tradesmen to respond and correct the failure
• The substation is located in an urban location with workshops and strategic spares located within a 50km radius
Device MTBF (years) MTTR (hours) Availability (%)
Protection IED (PIED) 100 12 99.9986
Merging Unit (MU) 150 12 99.9991
Ethernet Switch (ES) 50 12 99.9972 DC Power System
(UPS) 100 12 99.9986
DC Cables (DCC) 150 12 99.9991
Optic Fibre Cable (OFC) 50 12 99.9972
Table 1 – Reliability data for components of a protection system (Tournier & Werner, 2010) (Schweitzer, et al., 1997) (Institute of Electrical and Electronics Engineers, Inc., 2007)
The existing and new systems in Figure 11 consist of two main connections, CT to IED and VT to IED. The connection of a VT to the IED incorporates redundancy with the ability to select between two possible VTs. Therefore, a loss of a single component in the CT to IED connection results in a complete system failure and it would take the failure of both VT connections to have a complete system failure. Using equations (2-1), (2-2) and (2-3) from section 2.3.1 both systems can be reduced to a single availability value for comparison purposes. The availability of the existing system as shown in Figure 11 is given by:
௫௦௧=ଶ×1 −1 −ଶ×ூா= 99.9968%( 9ᇱ)
In addition, the availability of the new system is given by:
25 The results of the availability assessment have shown a reduction of one 9’s. The reduction of protection system’s availability should not be considered best practice. The reduction in availability can be linked to the number of additional electronic devices required in the Process Bus network architecture such as the Merging Unit and Ethernet Switches.
Improving the availability of a Process Bus system can be done by two means: • Install devices which have higher availability
• Incorporate redundancy in to the network architecture
The first option to utilise devices with higher availability would still mean that the introduction of new electronic devices would reduce the availability. However, the overall impact might not be as significant, it is expected that there will still be a reduction in the system’s availability. Given that Table 1 defines the availability of these device based on industry experience this option will not be further explored.
The development of the communication protocols such as PRP and HSR, explained in section 2.3.2, allows redundant communication paths to be incorporated into the network. Duplicating electronic devices and utilising redundant communication paths allows the system’s availability to be improved.
3.2.2
Process Bus Network Architecture Redundancy
Process Bus network architecture’s redundancy is limited by the functionality of the IEDs within the network. The main limiting factor is the inability of a process bus protection IED to be configured such that if it loses the current-sampled values from one merging unit it is unable to automatically change over and use of the current-sampled values from another merging unit. The Protection IEDs do have the ability to switch voltage-sampled values, ALSTOM (2013) technical manual for a protection IED that is IEC 61850 -9-2LE compliant is an example of this restricted functionality. Given this restricted functionality, the duplication of a merging unit will not be considered unless it is for use in a second protection IED.
3.2.2.1
Singly Attached Node (SAN) IED Redundant Network
26 The system shown in Figure 12 introduces another parallel path into the availability block diagram due to the redundant protection IEDs. Utilising all three availability equations given in section 2.3.1 the – LV Feeder Process Bus Network Redundancy Architecture 1 has an availability of 99.9918%
Figure 12 – LV Feeder Process Bus Network Redundancy Architecture 1
A system comprising of two protection IEDs such as the one in Figure 12 is able to utilise a second merging unit. Figure 13 shows the connection of this system with each protection IED subscribing to a separate merging unit’s sampled value data stream.
Figure 13 – LV Feeder Process Bus Network Redundancy Architecture 2
27
3.2.2.2
Doubly Attached Node implementing PRP (DANP) Redundant
Network
A redundant communication path can be created using a combination of software and hardware based networks. The software component can occur within the Ethernet Switches using Virtual Networks known as VLANs. Throughout the following assessments, it is assumed that all Ethernet switches have the following functionality:
• They are manageable – Allows for Multiple VLAN configuration • Capable of performing the tasks of a RedBox as defined in IEC62439-3
The Process Bus network architecture shown in Figure 11 has the ability of utilising PRP to create redundant communication pathway between the Merging units and protection IED. Figure 14 below shows the connection of the network with redundant communication paths.
Figure 14 – LV Feeder Process Bus Network Redundancy Architecture 3
The implementation of PRP utilising doubly attached nodes has introduced another level of redundancy for the VT signal. An assessment of the availability of the connection between the voltage transformer merging units and the SV access Ethernet switches has resulted in the availability being 100%. Having this high availability is the reason for this part of the network being omitted for the remaining of this case study.
28 The network’s availability can be further increased by introducing redundancy of the IEDs connected as seen in section 3.2.2.1. Given the network is already configured for DANP the second protection IED will utilise this as the option as a SAN protection IED would not be the preferred solution. Figure 15 shows the inclusion of a second DANP Protection IED.
Figure 15 – LV Feeder Process Bus Network Redundancy Architecture 4
Having both a redundant communication path and protection IEDs has resulted in the availability of the process bus network increasing to 99.9990%. This new availability exceeds the original network architecture’s availability and increases the number of 9’s to five (5).
3.2.2.3
Doubly Attached Node implementing HSR (DANH) Redundant
Network
HSR requires the use of a new type of Ethernet switch referred to as “RedBox” or “QuadBox” in the IEC62349-3 standard. These types of Ethernet switches allows the interconnection of the multiple HSR networks or connecting a SAN to either a PRP or HSR network to utilise the redundant communication paths. The availability of a HSR network is dependent on the number of IEDs within the ring. Figure 16 below shows the typical connection that would be utilised between the SV access network and the IED access network, it should be noted that the dotted line indicates that more IEDs can be added or removed from the network. This configuration also does not allow for redundancy of the communication link between the different access networks.
The system’s availability is dependent on the number of other IEDs on the ring. The network architecture has been assessed for a range of IEDs in each ring ranging from the minimum number of IEDs required to perform the protection function up to eight (8) additional IEDs split evenly on each parallel path.
௦௬௦ହn ெ×1 −1 −ைிଶଶ×1 −1 −ெ×ைிଶ×ோாଶ
×ைி ×1 −1 −ூா×ைிଶ×ூா
(3-1)
29 Figure 16 - LV Feeder Process Bus Network Redundancy Architecture 5
Equation (3-1 above describes the availability function for the Process Bus network architecture shown in Figure 16. The results from the above analysis show that by increasing the number of IEDs in each parallel path has minimal effect on the overall network availability. The results for the network’s availability with the minimum number of IEDs being 99.99477% and the worst-case scenario resulting in an availability of 99.99476%.
The availability of the network is still below the original network architecture. To improve the availability of the system the connection between the two access networks will incorporate redundancy. This is achieved by using additional RedBoxes as described in IEC62439-3 (International Electrotechnical Commission, 2012). The new Process Bus network architecture can be seen in Figure 17 below.
30 The additional IEDs in the parallel paths have no impact on the network’s availability when interpreting the result with precision to the fourth decimal place. Therefore, the assessment of the availability for the network shown in Figure 17 is based on the worst-case scenario of four additional IEDs in each parallel path. The result obtain for this network was 99.9977%, which when compared with the original network architecture is the same.
The combination of redundant communication paths utilising HSR and redundant protection IEDs similar to that for the DANP assessment conducted in section 0 is an option to improve the network’s availability. The inclusion of the redundant protection IED increases the system’s availability to 99.9990%. This availability of a system with both a redundant communication path and protection IED has the same improvement in availability whether HSR or PRP has been used.
3.2.2.4
Combination of DANP and DANH Redundant Network
Process Bus network architectures that combine different redundancy protocols, such as HSR and PRP, into one network are heavily dependent on the functional ability of the RedBox. The ability to configure the RedBox to appropriately filter the redundant packets, then apply the appropriate new redundancy protocol suffix into the packet so that the subscriber can identify the redundant packets. Figure 18 below consists of two network topologies using the combination of the two types of redundant protocols. In these cases, the SV access network and IED access network would be opposite to the other.
31 The two network topologies shown in Figure 18 are very similar with the creation of parallel communication paths. The difference will only be seen when adding redundant protection IEDs. The availability assessment confirmed this with only a slight increase when the HSR ring consisted of Merging Units given their higher availability compared to that of the protection IED. The availability of the network that used the combination of DANP and DANH devices was the same as the networks utilising only one type with an availability of 99.9977%.
3.2.2.5
Sensitivity Analysis
The values of MTBF for the new devices introduced into the network have been taken from previous bodies of work for assessing the availability of a Process Bus system. Manufacturer supplied MTBF values are based on the number of units sold verse the number of units that had reported failures. These devices are new to the industry and using actual data to determine the MTBF can lead to a miss representation of what can be expected.
A sensitivity analysis has been conducted on the impact that these inaccuracies for the MTBF of a merging unit, optical Fibre cable and ethernet switch will have. The methodology adopted for this uses the Monte Carlo method, which is defined as:
“A Technique in which a large quantity of randomly generated numbers are studied using a
probabilistic model to find an approximate solution to a numerical problem that would be
difficult to solve by other methods.” (Oxford University Press, 2014)
The sensitivity analysis will be conducted so that the relative error in the MTBF for the three new components of the Process Bus are assessed individually. The relative error will only be looking at the minus component, as this analysis will assume worst case that the specified values for the MTBF used in the previous assessments is the upper limit.
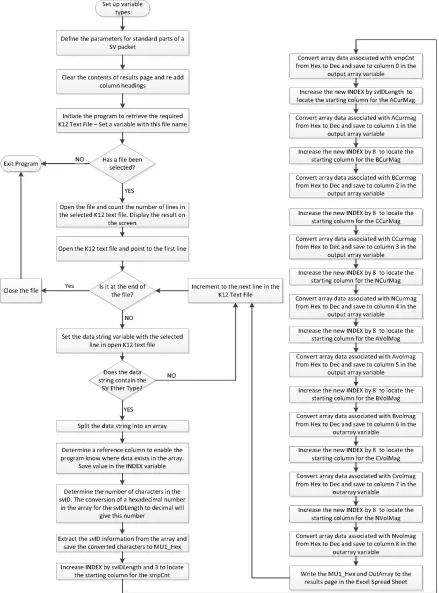
Figure 19 below shows the process flow for determine the probability that the systems availability will be greater than equal to that of the existing network’s availability as the relative error is increased.
32 Figure 19 – Process flow diagram for assessing the sensitivity of the Merging Unit’s MTBF on the network’s
availability
33 The sensitivity test for the MTBF value of both the ethernet switch and fibre optic cable has shown that the relative error has little impact on the network’s availability. Both components could have a relative error of -97% before the network’s availability is impacted. Figure 21 below is a plot showing this result.
Figure 21 – Sensitivity analysis results for a fibre optic cable’s MTBF
These results have concluded that the use of the MTBF values defined in Table 1 for these new devices is an acceptable practice.
3.3
Ultimate Process Bus Architecture
3.3.1
Conventional Substation Secondary System Architecture
The conventional architectures shown previously in Figure 11 consist of the following components: CT core, VT winding, control cables and the protection relay. This architecture is very simplistic due to the limitations of the components within the network; these limitations will been discussed later in this dissertation. Section 2.1.3 outlined Ergon Energy standards that included both an ultimate substation design for a two-32MVA transformer zone substation and specific standards that defined the requirements of subsystems with in the standard design. The main standard that influences the secondary system architecture is the Protection Standard STNW1002.
34 The analysis of the system’s availability for the ultimate substations secondary system is quite complex. The complexity lies in the analysis of all the different functionalities that occur within the system. This project is focused on the impact that the implementation of sampled values has on the system. Therefore, the availability of the system is limited to the devices in the network that are responsible for the transfer of the secondary measurement obtained by the instrument transformer to the protection relays that uses this information to make a decision. The key factors in assessing the systems availability is to identify smaller system’s within the network that do not directly influence each other’s individual availability. This breakdown will identify where parallel paths occur and allow the block reduction procedure to be used to determine the complete system’s availability. Please note that a failure of the whole system as part of this analysis does not imply that all protection functionality of the safety system is breached.
3.3.1.1
LV Protection
The LV protection consists of two main protection schemes, these are: • Feeder protection, &
• Bus Protection
Due to the nature of the equipment being protected, the standard does not require that the protection be duplicated. Instead the backup protection can be performed in a more cost effective/ practicable way.
For reliability purposes through studies of distribution loading for feeders, Ergon Energy has adopted a three-bus section arrangement for the LV component of the substation. The single line diagram in Figure 4 illustrates that the two outer sections support three outgoing feeders and the middle section supports four. Each feeder consists of a secondary system as shown in Figure 11.
35 Figure 22 – A Conventional LV Bus section’s protection connection diagram
The bus section and feeder protection schemes are backed up using a summated overcurrent protection scheme. The method for this scheme is to summate the CT measurements of the bays that has the potential to supply current to the faulty section of the network.
36 Figure 23 – Ultimate substation’s LV secondary system availability block diagram
3.3.1.2
Transformer Protection
The ultimate substation arrangement consists of two power transformers. Due to the criticality and cost associated with this type of equipment the protection standard defined the requirement for the protection scheme to be duplicated. The protection scheme selected for protecting a power transformer is a low impedance differential scheme. The benefit of this scheme is its ability to use the intelligence of the protection relay to adjust both the mismatch in current magnitude and phase angle due to the effect the power transformer has on the primary current of the system. The relays used for this protection also have the added function of not just a differential pickup but also pickups for both HV and LV over current.
The connection of the protection schemes for each transformer is the same. Given this, Figure 24 below shows the secondary connection for a single transformer.