Contents lists available atScienceDirect
Global Ecology and Conservation
journal homepage:www.elsevier.com/locate/gecco
Original research article
Groundwater decline and tree change in floodplain
landscapes: Identifying non-linear threshold responses in
canopy condition
J. Kath
a,b,c,∗, K. Reardon-Smith
b,c,d, A.F. Le Brocque
b,c, F.J. Dyer
a, E. Dafny
e,
L. Fritz
c, M. Batterham
caInstitute for Applied Ecology and Collaborative Research Network for Murray-Darling Basin Futures, University of Canberra, ACT 2601,
Australia
bInternational Centre for Applied Climate Sciences, University of Southern Queensland, Toowoomba QLD 4350, Australia cFaculty of Health, Engineering and Sciences, University of Southern Queensland, Toowoomba QLD 4350, Australia dDigital Futures CRN, University of Southern Queensland, Toowoomba QLD 4350, Australia
eNational Centre for Engineering in Agriculture, University of Southern Queensland, Toowoomba, QLD 4350, Australia
a r t i c l e i n f o
Article history:
Received 26 June 2014
Received in revised form 5 September 2014 Accepted 5 September 2014
Available online 22 September 2014
Keywords:
Canopy condition Dieback Drought Tipping point Ecological threshold
Groundwater dependent ecosystems
a b s t r a c t
Groundwater decline is widespread, yet its implications for natural systems are poorly understood. Previous research has revealed links between groundwater depth and tree condition; however, critical thresholds which might indicate ecological ‘tipping points’ as-sociated with rapid and potentially irreversible change have been difficult to quantify. This study collated data for two dominant floodplain species,Eucalyptus camaldulensis(river red gum) andE. populnea(poplar box) from 118 sites in eastern Australia where signifi-cant groundwater decline has occurred. Boosted regression trees, quantile regression and Threshold Indicator Taxa Analysis were used to investigate the relationship between tree condition and groundwater depth. Distinct non-linear responses were found, with ground-water depth thresholds identified in the range from 12.1 m to 22.6 m forE. camaldulensis
and 12.6 m to 26.6 m forE. populneabeyond which canopy condition declined abruptly. Non-linear threshold responses in canopy condition in these species may be linked to root-ing depth, with chronic groundwater decline decouplroot-ing trees from deep soil moisture resources. The quantification of groundwater depth thresholds is likely to be critical for management aimed at conserving groundwater dependent biodiversity. Identifying thresholds will be important in regions where water extraction and drying climates may contribute to further groundwater decline.
©2014 The Authors. Published by Elsevier B.V. This is an open access article under the CC BY-NC-ND license (http://creativecommons.org/licenses/by-nc-nd/3.0/).
1. Introduction
Riparian and floodplain woodland vegetation provide habitat, corridors and refugia for numerous species and play a major role in channel hydraulics, sediment transport and nutrient filtration (Naiman and Décamps, 1997). However, these
∗Corresponding author at: Institute for Applied Ecology and MDB futures CRN, University of Canberra, ACT 2601 Australia. Tel.: +61 0 2 6201 5506.
E-mail addresses:kath.jarrod@gmail.com(J. Kath),Kathryn.Reardon-Smith@usq.edu.au(K. Reardon-Smith),Andrew.LeBrocque@usq.edu.au (A.F. Le Brocque),fiona.dyer@canberra.edu.au(F.J. Dyer),Elad.Dafny@usq.edu.au(E. Dafny),fritzee_8@hotmail.com.au(L. Fritz),
Megan.Batterham@bg-group.com(M. Batterham).
http://dx.doi.org/10.1016/j.gecco.2014.09.002
functions may be compromised where riparian and floodplain vegetation are degraded or lost. Degradation of riparian and floodplain vegetation have been linked to a number of biophysical factors, including climate, fire, grazing and disease (Jurskis, 2005), all of which can interact in complex ways across scales. Several recent studies have shown that groundwater decline is also a key driver of change for some vegetation communities. To date, changes in groundwater have been linked to differences in canopy condition (e.g.Cunningham et al., 2011), population characteristics (e.g. recruitment and survivorship (e.g. Horner et al., 2009)) and vegetation community composition (e.g. Stromberg et al.,1996;Elmore et al.,2006), as well as decreased shoot water potential, leaf mortality and branch dieback (Cooper et al., 2003). More generally, other studies have also shown links between groundwater decline and the degradation of riparian habitats (Stromberg et al.,1992;Busch and Smith, 1995;Stromberg et al.,1996).
While the importance of groundwater and the consequences of groundwater decline for biodiversity are recognised in temperate (e.g. Harding,1993; Fojt, 1994; Smith, 2000; Danielopol et al., 2003; Wamelink et al., 2013), tropical (e.g. Lamontagne et al., 2005) and arid climates (e.g. Fensham et al., 2011), few studies have investigated the nature of the relationship between groundwater decline and ecological response and, in particular, whether critical threshold responses (sensuGroffman et al., 2006) can be identified. Groundwater depth thresholds might represent ‘tipping points’
(sensuLaurance et al., 2011) beyond which the vulnerability of groundwater dependent species and communities to other
water related stressors, such as drought, could substantially increase and from which recovery is uncertain (Groffman et al.,
2006;Laurance et al.,2011).
The literature reflects two models of ecological response to groundwater decline in riparian and floodplain tree species: (i) a linear response, where tree condition declines across a gradient of groundwater depths (e.g. Cunningham et al.,2011;
González et al.,2012); or (ii) a threshold response, where tree condition remains relatively stable until groundwater depth declines below a particular level, after which tree condition declines rapidly (e.g. Horton et al.,2001;Cooper et al.,2003). Some studies have hypothesised non-linear responses but have fitted their data using linear regression and not specifically tested for thresholds (e.g. Shafroth et al., 2000). Others have selected surrogate thresholds based on maintaining mortality rates at a defined level (e.g.
<
50% inGonzález et al., 2012). As a consequence, the question of ecological threshold responses to groundwater decline remains unresolved.Despite the limited empirical evidence in the literature, a threshold response of riparian/floodplain tree condition to groundwater decline, whether due to climatic influences or over extraction, may be reasonably conjectured on the basis of genetic, physical and physiological constraints to tree rooting depth (Schenk and Jackson, 2002;Naumburg et al.,2005). Riparian and floodplain tree species tend to be mesic and highly dependent on access to reliable water sources including in-stream surface water, soil moisture and shallow groundwater (e.g.,Thorburn and Walker, 1994;Holland et al., 2006;
Stromberg and Patten, 1996). Such species may be poorly adapted to cope with moisture deficit; hence, their condition tends to be closely related to their hydrological status (Bacon et al.,1993;Cooper et al.,2003;McDowell et al.,2008). Drought and anthropogenically modified hydrological conditions may result in a range of stress induced responses in trees (e.g. Rice et al., 2004), including adaptive canopy thinning and branch sacrifice (dieback) to reduce transpiration demand and conserve hydraulic status (Tyree and Sperry, 1988; Rood et al.,2000). Extreme moisture deficit may also result in embolism, cavitation and failure in transporting xylem tissue, ultimately causing death (Tyree and Ewers, 1991;McDowell et al.,2008). Consequently, when groundwaters decline below riparian and floodplain tree rooting depths, access to a secure water resource, required for these species to persist in dry surface water environments, becomes less likely.
In this paper, we investigate the nature of the relationship between dominant tree condition and groundwater depth in remnant floodplain communities in an Australian agricultural landscape experiencing significant groundwater decline. Groundwater levels have declined by up to 25 m in the study region in recent decades; these declines are comparable in magnitude and extent to those documented in other parts of the world where levels of groundwater use are unsustainable (Gleeson et al., 2012). Empirical evidence for the existence and quantification of thresholds is vital to support robust decision-making aimed at maintaining ecological resilience.
Two commonly encountered riparian and floodplain tree species (Eucalyptus camaldulensisDenh. andE. populneaF. Muell.) in this landscape show evidence of poor canopy condition and significant dieback across parts of their distribution (Batterham,2008;Reardon-Smith,2011;Kath,2012;Fritz,2013). We investigate the nature of tree condition responses to groundwater decline in this landscape and use regression tree (Elith et al., 2008) and threshold identification (Cade et al.,
1999;Cade and Noon, 2003;Baker and King, 2010;Kail et al.,2012) approaches to identify and quantify any non-linear (threshold) responses to groundwater depth. We also discuss the need for an evidence-based approach to defining ecological thresholds to support sustainable groundwater resource management aimed at ensuring the persistence of riparian and floodplain species and communities in areas where groundwater resources support a range of uses.
2. Material and methods
2.1. Study area
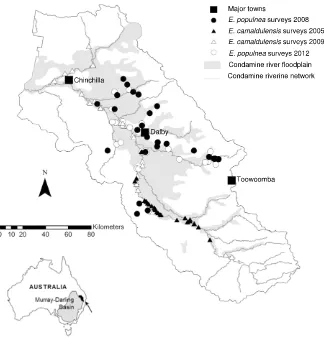
Fig. 1. Map of the Condamine catchment study area showing the extent of the Condamine riverine network, floodplain, major towns and tree condition survey sites forEucalyptus populnea(floodplain sites) andE. camaldulensis(riparian and wetland sites).
(1890–2010) mean annual rainfall across the catchment ranges from 673 to 691 mm (BoM, 2010), but is subject to significant inter-seasonal and inter-annual variation with extended drought and intense rainfall periods common throughout the historical record (Murphy and Ribbe, 2004). Annual rainfall in the ‘wet’ La Niña phase can total 1200 mm compared to 250 mm per annum in the ‘dry’ El Niño phase of the ENSO (BoM, 2010). Stream flow variability in the Condamine River is also high and increases with distance downstream (QDEH, 2009).
The alluvial floodplain sections of the Condamine catchment and its groundwater resources are extensively developed for agriculture (
∼
60% of the land area is dedicated to cropping) (QDERM,1999;CSIRO,2008). The development of irrigated cropping in the catchment since the 1960s has been accompanied and supported by significant surface and groundwater water resource development (Thoms and Parsons, 2003) to mitigate risk associated with the highly variable rainfall and stream flow of the region (McKay et al.,1999;Porter,2002;Dafny and Silburn, 2014). Current groundwater extraction rates exceed estimated recharge by 38% in over 90% of years in the historical record (CSIRO, 2008). Groundwater levels in the region have been declining steadily for many years with the exception of localised areas where direct recharge occurs from the river and its larger tributaries (Porter, 2002). In some areas, declines of 15–25 m over a period of 4 decades (1967–2007) are evident (Kelly and Merrick, 2007).2.2. Assessing tree condition on the Condamine floodplain
Tree condition data used in this study were derived from four recent surveys investigating the canopy condition of
E. camaldulensis(Reardon-Smith,2011;Kath,2012) andE. populnea(Batterham,2008;Fritz,2013) in floodplain woodlands
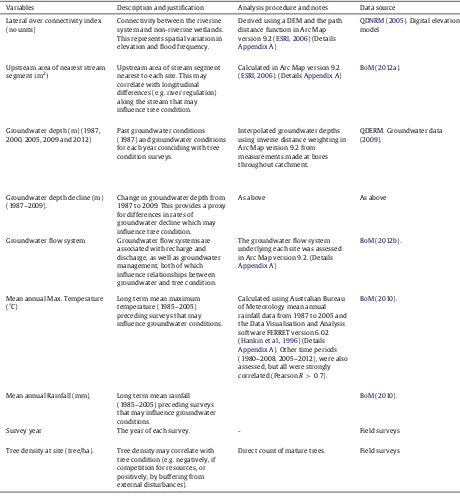
Table 1
Description of predictor variables and their quantification methods and source.
Variables Description and justification Analysis procedure and notes Data source
Lateral river connectivity index (no units)
Connectivity between the riverine system and non-riverine wetlands. This represents spatial variation in elevation and flood frequency.
Derived using a DEM and the path distance function in Arc Map version 9.2 (ESRI, 2006) (Details Appendix A)
QDNRM(2005). Digital elevation model
Upstream area of nearest stream segment(m2)
Upstream area of stream segment nearest to each site. This may correlate with longitudinal differences (e.g. river regulation) along the stream that may influence tree condition.
Calculated in Arc Map version 9.2 (ESRI, 2006). (DetailsAppendix A)
BoM(2012a).
Groundwater depth (m) (1987, 2000, 2005, 2009 and 2012)
Past groundwater conditions (1987) and groundwater conditions for each year coinciding with tree condition surveys.
Interpolated groundwater depths using inverse distance weighting in Arc Map version 9.2 from measurements made at bores throughout catchment.
QDERM. Groundwater data (2009).
Groundwater depth decline (m) (1987–2009).
Change in groundwater depth from 1987 to 2009. This provides a proxy for differences in rates of groundwater decline which may influence tree condition.
As above As above
Groundwater flow system Groundwater flow systems are associated with recharge and discharge, as well as groundwater management, both of which influence relationships between groundwater and tree condition.
The groundwater flow system underlying each site was assessed in Arc Map version 9.2. (Details Appendix A)
BoM(2012b).
Mean annual Max. Temperature (°C)
Long term mean maximum temperature (1985–2005) preceding surveys that may influence groundwater conditions.
Calculated using Australian Bureau of Meteorology mean annual rainfall data from 1987 to 2005 and the Data Visualisation and Analysis software FERRET version 6.02 (Hankin et al., 1996) (Details Appendix A). Other time periods (1980–2008, 2005–2012), were also assessed, but all were strongly correlated (PearsonR>0.7).
BoM(2010).
Mean annual Rainfall (mm). Long term mean rainfall (1985–2005) preceding surveys that may influence groundwater conditions.
BoM(2010).
Survey year The year of each survey. - Field surveys
Tree density at site (tree/ha). Tree density may correlate with tree condition (e.g. negatively, if competition for resources, or positively, by buffering from external disturbances).
Direct count of mature trees. Field surveys
indicator of stand condition. This study uses the site level Average Foliage Index (AFI) as the primary response variable in the analyses conducted. Survey year and the density of trees assessed at each site were included as factors in analyses to account for the effect of observer bias and seasonal conditions and differences in the number of trees surveyed.
2.3. Mapping groundwater depths across the Condamine catchment
from 1987 to 2009). Cross validations showed that interpolated rasters predicted recorded groundwater depths reasonably well across the catchment (PearsonR
=
0.
65,R2=
0.
43).A range of additional hydro-climatic and hydrogeological variables were also assessed and included in models to account for any influence these may have on relationships between groundwater depth and tree condition (details given inAppendix A). A summary of all predictor variables used in analysis is given inTable 1.
We initially ran models with interpolated groundwater depths for all years, but due to significant correlations (p
<
0.
01) between groundwater depths between years, final models included only the 2005 interpolated groundwater depths as: (i) the 2005 dataset was the most highly correlated with other years; (ii) the 2005 dataset provided groundwater depths that all tree condition surveys were exposed to (i.e. all surveys were carried out in 2005 and after); and (iii) in initial models, 2005 groundwater depth had the greatest relative importance of all groundwater variables (Section3.1).2.4. Data analysis — Identifying and quantifying thresholds
Recent developments in statistical techniques have seen an increase in the number of methods that can be used to identify and quantify thresholds (Kail et al., 2012). However, differences between these methods may lead to uncertainty in interpretation (Kail et al., 2012). To account for any discrepancies in threshold identification and quantification that may occur with the method used, we used a range of techniques to check for consistency in any threshold values identified. Boosted regression trees (BRTs) were used to qualitatively assess relationships, while quantile regression and Threshold Indicator Taxa Analysis (TITAN) were used to quantify threshold values. Within BRTs, ‘tree species’ was included as a factor within the analysis, while quantile regression and TITAN threshold values were quantified individually for each species. Each of the techniques used is outlined below (Sections2.4.1–2.4.3).
2.4.1. Boosted regression tree analysis
BRTs were used to qualitatively investigate the relationship (i.e. linear or threshold) between groundwater depth and tree condition. BRTs are well suited for modelling complex functions and interactions between variables without making assumptions about the shape of the fitted functions (De’ath, 2007). Tree condition data from all studies combined were modelled as a function of groundwater depth (afterElith et al., 2008), with tree condition data arc-sine transformed to correct for boundedness (Ahrens et al., 1990). BRT analyses were performed in R version 2.15.0 (R Development Core Team, 2011) using the ‘gbm’ library (Ridgeway, 2012) supplemented with functions fromElith et al.(2008). Partial dependence plots were used to visualise the fitted functions from the BRT model (Elith et al., 2008). These plots show the influence of each variable on the response, while controlling for the average effect of other variables in the model (Elith et al., 2008). This allowed for the relationship between tree condition and groundwater depth to be assessed, while taking account of other factors (e.g. survey year, rainfall, temperature etc.). To account for residual spatial autocorrelation, which can bias parameter estimates, we followed the residual autocovariate method outlined byCrase et al.(2012).
2.4.2. Quantile regression
Quantile regression (Koenker and Bassett, 1978) was used to assess the relationship between groundwater depth and tree condition across different parts of the probability distributions for both species. In contrast to classical linear regression techniques, which are restricted to estimating rates of change in the mean of the response variable (Cade and Noon, 2003), quantile regression allows the estimation of functional relationships between variables across the entire probability distribution (Cade and Noon, 2003). Quantile regression thus allows for differences in the relationship between a predictor and a response to be accounted for and provides estimates for multiple rates of change from the minimum to maximum response (Cade and Noon, 2003).
Quantile regression was performed on all quantiles from 0.05 to 0.95 for bothE. camaldulensisandE. populneatree condition data using the quantreg package (Koenker and Ng, 2012) in R version 2.15.0 (R Development Core Team, 2011). Bootstrapping (
×
1000 replicates) was performed for each quantile, at 0.05 intervals, to identify and validate significant relationships. Quantiles showing significant relationships between groundwater depth and tree condition (p<
0.
05 and bootstrapped confidence intervals not including zero) were then used for threshold identification using the GUIDE software (afterKail et al., 2012). In contrast toKail et al.(2012), who determined threshold values for the upper most quantile with the narrowest confidence interval only (indicative of a limiting factor), we examined thresholds for all significant quantiles to assess the full range of possible responses.2.4.3. Threshold identification
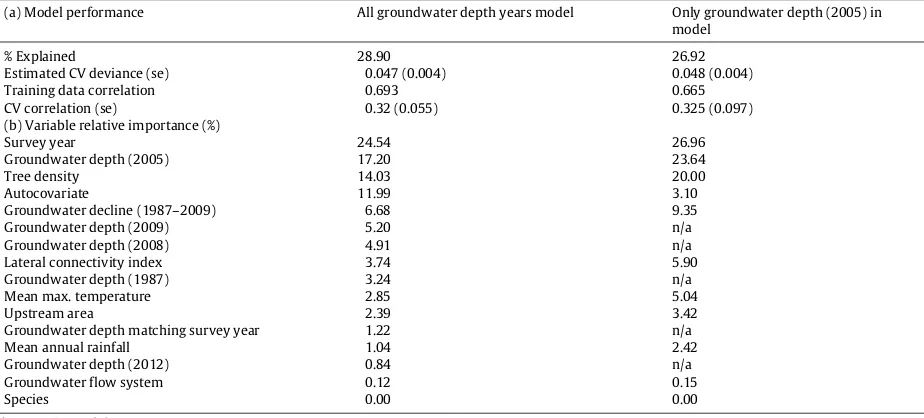
Table 2
Boosted regression model results groundwater depth in 2005 and all groundwater years together. (a) Model performance. (b) Relative importance of predictor variables. Residuals of the BRT model showed no spatial auto-correlation and were randomly distributed (Moran’s Index= −0.05,p>0.05).
(a) Model performance All groundwater depth years model Only groundwater depth (2005) in model
% Explained 28.90 26.92
Estimated CV deviance (se) 0.047 (0.004) 0.048 (0.004)
Training data correlation 0.693 0.665
CV correlation (se) 0.32 (0.055) 0.325 (0.097)
(b) Variable relative importance (%)
Survey year 24.54 26.96
Groundwater depth (2005) 17.20 23.64
Tree density 14.03 20.00
Autocovariate 11.99 3.10
Groundwater decline (1987–2009) 6.68 9.35
Groundwater depth (2009) 5.20 n/a
Groundwater depth (2008) 4.91 n/a
Lateral connectivity index 3.74 5.90
Groundwater depth (1987) 3.24 n/a
Mean max. temperature 2.85 5.04
Upstream area 2.39 3.42
Groundwater depth matching survey year 1.22 n/a
Mean annual rainfall 1.04 2.42
Groundwater depth (2012) 0.84 n/a
Groundwater flow system 0.12 0.15
Species 0.00 0.00
n/a=not in model.
Threshold Indicator Taxa Analysis (TITAN) (Baker and King, 2010) was used to provide another threshold estimate
forE. camaldulensisandE. populneatree condition groundwater depth thresholds. TITAN utilises change point analysis, a
non-parametric technique that orders and partitions observations along a gradient. TITAN works by splitting sample units into 2 groups at the value of the predictor variable (e.g. groundwater depth) that maximises association of the response of interest (e.g. tree condition) with one side of the partition.
Within TITAN, bootstrapping (
×
1000 replicates) was also used to assess the uncertainty around change points or threshold estimates. Uncertainty was assessed by taking the bootstrap 5th and 95th quantile change points, which provided a 90% confidence interval (CI) for the threshold value (Baker and King, 2010). Bootstrapping also provides two measures of the quality of responses, purity and reliability.Purityrefers to the proportion of change-point directions (−
or+
) within bootstrap replicates that agree with the observed response; a pure indicator is one with a consistent response direction (i.e. purity≥
0.
95) (Baker and King, 2010).Reliabilityrefers to the proportion of bootstrap replicate change points with indicator value scores (a measure of strength between a taxa and an external sample grouping) below a defined probability (e.g.p≤
0.
05);reliableindicators have≥
0.
95 of bootstrap replicates significant atp≤
0.
05 (or some other defined level). FollowingBaker and King(2010), we used the cut-offs for significance criteria provided in the TITAN package (i.e. for p≤
0.
05, purity≥
0.
95 and reliability≥
0.
90). TITAN was run with the TITAN package in R.2.9.2 (for further details seeBaker and King, 2010).3. Results
3.1. Tree condition response to groundwater depth
The BRT model for ‘tree condition’ explained 26.9% of the variation in tree condition (CV correlation
=
0.
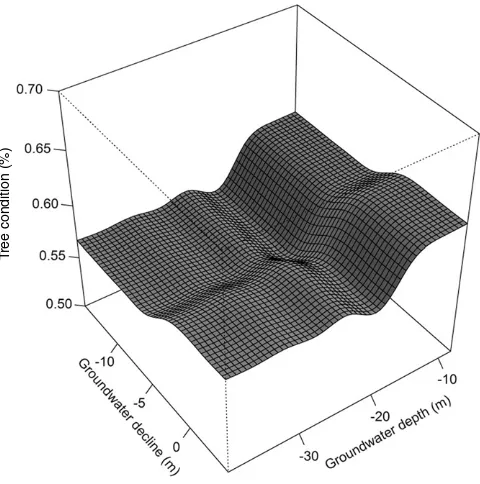
33) (Table 2). Within the model, the variable ‘survey year’ had the highest relative contribution to the model (27%); ‘groundwater depth’ explained 23.6%; ‘tree density’ 20.0%; and ‘groundwater decline’ 9.4% (Fig. 2). The remaining predictor variables all explained less than 6% of the variation within the model (Fig. 2). Models including all groundwater depth variables showed similar model performance and results (Table 2; Appendix B, Fig. B.1). Visual inspection of the partial plot of the relationship between ‘groundwater depth’ and ‘tree condition’ accounting for other predictors suggests a non-linear response of tree condition to groundwater depth, declining sharply between 12.5 and 20.0 m (Fig. 2). ‘Groundwater decline’ also showed an abrupt response in tree condition with groundwater declines of 2 and 5 m below 1987 levels (Fig. 2).Fig. 2. Boosted regression tree partial plots showing the relationship between floodplain tree condition (E. camaldulensisandE. populneacombined), and groundwater depth (m) and other predictor variables in the Condamine catchment. SeeTable 1for variable units and details andAppendix Bfor description of variables and groundwater flow system abbreviation meaning.
T
ree condition (%)
[image:7.544.154.394.420.662.2]Table 3
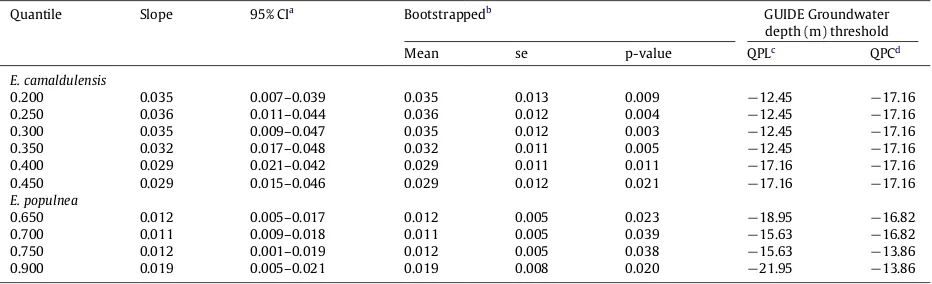
E. camaldulensisandE. populneaquantile regression results with threshold values for significant quantiles from GUIDE.
Quantile Slope 95% CIa Bootstrappedb GUIDE Groundwater
depth (m) threshold
Mean se p-value QPLc QPCd
E. camaldulensis
0.200 0.035 0.007–0.039 0.035 0.013 0.009 −12.45 −17.16
0.250 0.036 0.011–0.044 0.036 0.012 0.004 −12.45 −17.16
0.300 0.035 0.009–0.047 0.035 0.012 0.003 −12.45 −17.16
0.350 0.032 0.017–0.048 0.032 0.011 0.005 −12.45 −17.16
0.400 0.029 0.021–0.042 0.029 0.011 0.011 −17.16 −17.16
0.450 0.029 0.015–0.046 0.029 0.012 0.021 −17.16 −17.16
E. populnea
0.650 0.012 0.005–0.017 0.012 0.005 0.023 −18.95 −16.82
0.700 0.011 0.009–0.018 0.011 0.005 0.039 −15.63 −16.82
0.750 0.012 0.001–0.019 0.012 0.005 0.038 −15.63 −13.86
0.900 0.019 0.005–0.021 0.019 0.008 0.020 −21.95 −13.86
aCI=confidence interval.
b Bootstrap resample=1000, se=standard error. c QPL-quantile piecewise linear.
d QPC=quantile piecewise constant.
3.2. Groundwater depth thresholds for tree condition
Groundwater depth was significantly associated (p
<
0.
05) with quantiles 0.2 through to 0.45 forE. camaldulensis (Table 3) and significantly associated (p<
0.
05) with quantiles 0.65, 0.70, 0.75 and 0.9 forE. populnea(Table 3). All significant quantiles forE. camaldulensisandE. populneashowed declining tree condition as groundwater depth declined (Table 2). Results for all quantiles and quantile plots are given inAppendix B(Tables. B.1, B.2. and Fig. C.3). Quantiles 0.2, 0.25 and 0.3 showed the greatest rate of decline forE. camaldulensiscondition in relation to groundwater depth with slopes of 0.035–0.036 (Table 2).E. populneacondition decline was greatest in relation to groundwater depth for quantiles 0.9 and 0.95, with both having a slope of 0.019 (Table 3). Residuals for allE. camaldulensisandE. populneaquantile regression models showed no spatial auto-correlation and were randomly distributed (Moran’s Index=
0−
0.
01,p>
0.
05).Groundwater depth thresholds derived from GUIDE software for significant quantiles ranged from 12.5–17.2 m for quantile piecewise linear (QPL) and 17.2 m for quantile piecewise constant regression (QPC) forE. camaldulensis(Table 3) and from 15.6–22.0 m (QPL) and 13.9–16.8m (QPC) forE. populnea(Table 3). Visualised thresholds for these quantiles for locally weighted quantile regression were at approximately 12 m for quantile 0.3 and 18 m for quantile 0.4 forE. camaldulensis (Fig. 4a, Fig. 5b, respectively). E. populneathresholds were approximately 19 m and 18 m for quantiles 0.65 and 0.75, respectively (Fig. 4c, d). Threshold responses for quantile 0.9 forE. populneawere less pronounced, but suggest a change at around 21 m (Fig. 4e).
3.3. TITAN groundwater depth estimation
TITAN estimated overlapping groundwater depth thresholds of 17.5 m (90% confidence interval, 12.5–20.8 m) for
E. camaldulensisand 14.3 m (90% confidence interval, 14.33–26.5 m) forE. populnea. Estimates for both species had similar
purity and reliability scores (
>
0.95 and≥
0.92, respectively). TITAN threshold estimation 90% confidence intervals also overlapped regardless of which groundwater depth year data was assessed, with all estimates falling between 12.1 and 22.6 m forE. camaldulensisand 12.6 and 26.7 m forE. populnea(Appendix B, Table. B.3).4. Discussion
a
b
c
e
[image:9.544.122.430.53.450.2]d
Fig. 4. Locally weighted quantile regression plots forE. camaldulensisquantiles (a) 0.3 and (b) 0.4 andE. populneaquantiles (c) 0.65, (d) 0.75 and (e) 0.9. Different bandwidths represent different sensitivities to change. An intermediate bandwidth resulting in the sharpest change was selected visually and two additional bandwidths were included to show that lower bandwidths result in a curve strongly influenced by single data points, while higher bandwidths are less sensitive and mirror the linear quantile regression line (afterKail et al., 2012).
groundwater declines such as those occurring in the Condamine are not an isolated case, with vegetation in many other parts of the world exposed to similarly persistent groundwater declines (Gleeson et al., 2012). As such, vegetation responses to groundwater decline in the Condamine have significant global relevance.
Results from this study suggest non-linear threshold responses for bothE. camaldulensisandE. populneatree condition to groundwater depth, identifying thresholds of between 12.1 and 22.6 m forE. camaldulensis and between 12.6 and 26.7 m forE. populnea.The identified thresholds were consistent for all methods used, with TITAN estimates overlapping those derived through GUIDE using both quantile piecewise linear and quantile piecewise constant approaches. These values also concurred with visually estimated thresholds from boosted regression trees (
∼
12–20 m) and locally weighted quantile regression (∼
12–22 m). These groundwater depths corroborate proposed thresholds of 12–15 m forE. camaldulensis mortality in floodplain plantation forests on the Murray River floodplain, south-eastern Australia (Horner et al., 2009) and 13–16 m forE. camaldulensissite-level dieback severity in riparian woodlands on the Upper Condamine floodplain ( Reardon-Smith, 2011). They are also consistent with the estimates of maximum lateral root extension in this and similar species reported byMensforth et al.(1994) andCanadell et al.(1996). Modelled groundwater depth thresholds forE. populnea condition are the first such evidence for this species, although groundwater depth was reported byFritz(2013) to be a strong correlate of tree condition in this species.draw water in the absence of alternate sources may therefore indicate a threshold at which such stress responses become critical and provides a mechanism for the hypothesis that there is a threshold response of tree condition to groundwater decline. While maximum rooting depths inE. camaldulensisandE. populneaare unknown, critical groundwater depths identified in this study may represent a functional physiological limit to root growth. As suggested byNaumburg et al.(2005), groundwater decline may decouple tree roots from accessible moisture resources contributing to moisture deficit and impacting tree condition, particularly during extended drought conditions when surface soil moisture levels are depleted. Although, several studies have noted strong links with groundwater, the quality of this water is likely to be critical; in areas of high groundwater salinity, trees may rely more on deep soil moisture infiltrating after rainfall which may lie above the more saline groundwater (e.g. Holland et al., 2006). Generalisations about vegetation’s dependence on groundwater and related thresholds should therefore be made cautiously, as there may be important exceptions (e.g. Holland et al., 2006). Isotope studies would confirm the source(s) of water used by trees and are likely to be an important area of future research. Nonetheless, if the tree condition-groundwater depth thresholds identified forE. camaldulensisandE. populneain this study are associated with physiological limits to rooting depth for reaching groundwater and such limits apply to other species, then declining groundwater depths may have wide-ranging implications for the future condition, function and persistence of trees in environments where conditions such as extreme drought may increase vegetation’s dependence on groundwater.
If riparian and floodplain tree species commonly respond to groundwater depth thresholds, improved understanding of this relationship will have significant implications for biodiversity conservation and resource management elsewhere in the world where chronic groundwater decline is an issue (e.g. in much of Africa, the Americas, southern Europe, the Middle East, Southeast Asia and Australia;Dai, 2011). Riparian and floodplain vegetation support a wide range of ecosystem functions that would likely be impaired by changes in the condition and survivorship of key species sensitive to groundwater depletion (Naiman and Décamps, 1997). For example, population failure in dominant tree species could trigger cascading changes resulting in altered community composition and structure, which in turn could cause declines in other species (e.g. avifaunaBetts et al., 2010). In the study area much of the mappedE. camaldulensisandE. populneavegetation occurs in areas in which groundwater depths exceed the identified thresholds (Appendix C, Fig. C.1). Such spatial representations could provide important starting points for managers to identify ecosystems that may be at high risk from groundwater decline.
More specifically, if the tree condition-groundwater depth thresholds identified forE. camaldulensisandE. populneain this study are associated with physiological limits to rooting depth and such limits also apply to other species, it is probable that declining groundwater depths across many regions of the world (as reported byGleeson et al., 2012) will have wide-ranging ecological implications. In environments where dry climatic extremes exacerbate both societal and vegetation dependence on groundwater, knowledge of rooting depths could provide important indications of where thresholds may occur. However, whilst rooting depth is a plausible mechanism, rooting depth is difficult to ascertain directly; hence, threshold responses to groundwater decline remain difficult to verify. Although isotopic studies are able to identify the sources of water being utilised by vegetation (e.g.Dawson and Ehleringer, 1991), this is a resource intensive approach and difficult to execute over large spatial scales (e.g. entire forests or catchments). Hence, threshold identification, such as implemented in this study, provides a valuable approach to indirectly derive such information.
In combination with broader regional scale modelling approaches, fine scale physiological approaches will be needed to improve confidence about the mechanisms behind threshold responses to groundwater decline. Finer scale studies would also allow investigation of the relative importance of groundwater depth and the rate of groundwater change, as trees may be affected not only by declines in absolute depths but also the rate of decline (e.g. Shafroth et al., 2000). Variability in groundwater levels could potentially be important, especially in areas where seasonal irrigation activities may cause water tables to fluctuate above and below thresholds over time. Although, we focused on groundwater, in some instances, deep soil moisture may also be an important fine scale determinant of tree condition, particularly in areas of high groundwater salinity (e.g. Holland et al., 2006). In addition, measures of tree size and estimations of root length may also help better explain some of the patterns observed; tree size can correlate strongly with the water source being used (e.g.Dawson and Ehleringer, 1991) and younger trees with shallow roots may show threshold responses at different depths to those of larger trees. Incorporation of these factors would likely improve both fine and broad scale predictions and provide important information for targeting conservation activities at different scales. In combination, information about the sources of water being derived (e.g.Dawson and Ehleringer, 1991) and knowledge of rooting depths (e.g. Stromberg, 2013) in addition to statistically derived thresholds (as in this study) could provide robust grounds for conserving groundwater dependent biodiversity at both local and regional scales.
While threshold responses to groundwater decline were identified in this study, groundwater decline is not the only factor influencing tree condition in landscapes such as the Condamine catchment. Tree condition represents an integrated response to a range of environmental factors including defoliating insects, disease and pesticides (e.g.Wylie et al., 1992;
5. Conclusions
The ability to quantify critical groundwater thresholds for canopy condition in riparian/floodplain tree species provides valuable evidence for biodiversity conservation and resource use, improving our ability to predict the impact of groundwater depletion on riparian and floodplain ecosystems and to identify safe operating limits for sustainable water resource management in these regions. In this paper, we have identified clear threshold responses forE. camaldulensisandE. populnea canopy condition in a highly modified agricultural production landscape subject to chronic groundwater decline. We have presented an approach which allows for a relatively rapid assessment of groundwater–tree condition relationships over large spatial scales and contributes to addressing significant knowledge gaps in understanding groundwater decline impacts on ecosystems. Given widespread groundwater decline globally, and predictions that many semi-arid regions will experience increased incidence of drought under climate change (Dai, 2011), the susceptibility of riparian and floodplain tree species to drought, in combination with groundwater decline, will be an important issue for biodiversity conservation into the future. The findings and approaches outlined in this paper will inform policy and management to address these challenges and to better understand the broader ecological implications of groundwater decline.
Acknowledgements
This research was supported by the MDBFutures-Collaborative Research Network (CRN), the University of Southern Queensland’s International Centre for Applied Climate Sciences and Digital Futures CRN and the landholders of the Condamine catchment. Many thanks to Katharine Hewison, Neil Byron and anonymous reviewers, whose comments have helped to greatly improve upon earlier versions of the manuscript.
Appendix A, B and C. Supplementary data
Supplementary material related to this article can be found online athttp://dx.doi.org/10.1016/j.gecco.2014.09.002.
References
Ahrens, W.H., Cox, D.J., Budhwar, G.,1990. Use of the arcsine and square root transformations for subjectively determined percentage data. Weed Sci. 38, 452–458.
Bacon, P.E., Stone, C., Binns, D.L., Leslie, D.J., Edwards, D.W.,1993. Relationships between water availability andEucalyptus camaldulensisgrowth in a riparian forest. J. Hydrol. 150, 541–561.
Baker, M.E., King, R.S.,2010. A new method for detecting and interpreting biodiversity and ecological community thresholds. Method. Ecol. Evol. 1, 25–37. Banks, V.S.B.,2006. An investigation of eucalypt dieback on the Northern Liverpool Plains, Australia Unpublished PhD thesis, University of New England,
Armidale New South Wales, Australia.
Batterham, M.,2008. The resilience ofEucalytpus populneawoodlands in the production landscape of the Condamine Catchment, southern Queensland Unpublished BSc,Honours. thesis, University of Southern Queensland, Toowoomba, Queensland, Australia.
Betts, M.G., Hagar, J.C., Rivers, J.W., Alexander, J.D., McGarigal, K., McComb, B.C.,2010. Thresholds in forest bird occurrence as a function of the amount of early-seral broadleaf forest at landscape scales. Ecol. Appl. 20, 2116–2130.
BoM,, 2010, Climate data online. Australian Government Bureau of Meteorology (BoM), Melbourne VIC Australia. Available at:http://www.bom.gov.au/ climate/data/, accessed 29.08.2013.
BoM,, 2012a. Australian Hydrological Geospatial Fabric— Surface Network. Australian Government Bureau of Meteorology (BoM), Melbourne VIC Australia, Available athttp://www.bom.gov.au/water/geofabric/download.shtml, accessed 29.11.13.
BoM,, 2012b. Australian Hydrological Geospatial Fabric – Groundwater cartography 2.1 & Water table aquifer 2.1. Australian Government Bureau of Meteorology (BoM), Melbourne VIC Australia, Available athttp://www.bom.gov.au/water/geofabric/download.shtml, accessed 15.09.13.
Brenden, T., Wang, L., Su, Z.,2008. Quantitative identification of disturbance thresholds in support of aquatic resource management. Environ. Manage. 42, 821–832.
Busch, D.E., Smith, S.D.,1995. Mechanisms associated with decline of woody species in riparian ecosystems of the southwestern U.S. Ecol. Monogr. 65, 347–370.
Cade, B.S., Noon, B.R.,2003. A gentle introduction to quantile regression for ecologists. Front. Ecol. Environ. 1, 412–420. Cade, B.S., Terrell, J.W., Schroeder, R.L.,1999. Estimating effects of limiting factors with regression quantiles. Ecology 80, 311–323.
Canadell, J., Jackson, R.B., Ehleringer, J.B., Mooney, H.A., Sala, O.E., Schulze, E.D.,1996. Maximum rooting depth of vegetation types at the global scale. Oecologia 108, 583–595.
Chen, Y., Pang, Z., Chen, Y., Li, W., Xu, C., Hao, X., Huang, X., Huang, T., Ye, Z.,2008. Response of riparian vegetation to water-table changes in the lower reaches of Tarim River, Xinjiang Uygur. China. Hydrogeol. J. 16, 1371–1379.
Cooper, D.J., D’amico, D.R., Scott, M.L.,2003. Physiological and morphological response patterns ofPopulus deltoidesto alluvial groundwater pumping. Environ. Manage. 31, 215–226.
Crase, B., Liedloff, A.C., Wintle, B.A.,2012. A new method for dealing with residual spatial autocorrelation in species distribution models. Ecography 35, 879–888.
CSIRO, 2008, Water availability in the Condamine-Balonne. A report to the Australian Government from the CSIRO Murray-Darling Basin Sustainable Yields Project. Commonwealth Scientific and Industrial Research Organization (CSIRO), Canberra ACT Australia.
Cunningham, S.C., Read, J., Baker, P.J., Mac Nally, R.,2007. Quantitative assessment of stand condition and its relationship to physiological stress in stands ofEucalyptus camaldulensisMyrtaceae.. Aust. J. of Bot. 55, 692–699.
Cunningham, S.C, Thomson, J.R, Mac Nally, R., Read, J., Baker, P.J.,2011. Groundwater change forecasts widespread forest dieback across an extensive floodplain system. Freshwater Biol. 56, 1494–1508.
Dafny, E., Silburn, D.M.,2014. The hydrogeology of the Condamine river alluvial aquifer, Australia: a critical assessment. Hydrogeol. J. 22, 705–727. Dai, A.,2011. Drought under global warming: a review. Wiley Interdiscip. Rev. Clim. Change 2, 45–65.
Danielopol, D.L., Griebler, C., Gunatilaka, A., Notenboom, J.,2003. Present state and future prospects for groundwater ecosystems. Environ. Conserv. 30, 104–130.
Davidson, N.J., Close, D.C., Battaglia, M., Churchill, K., Ottenschlaeger, M., Watson, T., Bruce, J.,2007. Eucalypt health and agricultural land management within bushland remnants in the Midlands of Tasmania. Australia. Biol. Con. 139, 439–446.
De’ath, G.,2007. Boosted trees for ecological modeling and prediction. Ecology 88, 243–251.
Elith, J., Leathwick, J.R., Hastie, T.,2008. A working guide to boosted regression trees. J. Anim. Ecol. 77, 802–813.
Elmore, A.J., Manning, S.J., Mustard, J.F., Craine, J.M.,2006. Decline in alkali meadow vegetation cover in California: the effects of groundwater extraction and drought. J. Appl. Ecol. 43, 770–779.
ESRI,2006. ARC MAP Version 9.2. Environmental Systems Research Institute (ESRI), Redlands California USA.
Fensham, R.J., Silcock, J.L., Kerezsy, A., Ponder, W.,2011. Four desert waters: setting arid zone wetland conservation priorities through understanding patterns of endemism. Biol. Conserv. 144, 2459–2467.
Fojt, W.J.,1994. Dehydration and the threat to East Anglian fens. England. Biol. Conserv. 69, 163–175.
Fritz, L.R.,2013. The effects of patch and landscape factors on the resilience of poplar box (Eucalyptus populneaF. Muell.) woodlands, south east Queensland Unpublished MSc Thesis, University of Southern Queensland, Toowoomba QLD Australia.
Gleeson, T., Wada, Y., Bierkens, M.F.P., Van Beek, L.P.H.,2012. Water balance of global aquifers revealed by groundwater footprint. Nature 488, 197–200. González, E., González-Sanchis, M., Comín, F.A., Muller, E.,2012. Hydrologic thresholds for riparian forest conservation in a regulated large Mediterranean
river. River Res. Appl. 28, 71–80.
Groffman, P., Baron, J., Blett, T., Gold, A., Goodman, I., Gunderson, L., Levinson, B., Palmer, M., Paerl, H., Peterson, G., Poff, N.L., Rejeski, D., Reynolds, J., Turner, M., Weathers, K., Wiens, J.,2006. Ecological thresholds: the key to successful environmental management or an important concept with no practical application? Ecosystems 9, 1–13.
Hankin, S., Harrison, D.E., Osborne, J., Davison, J., Obrien, K.,1996. A strategy and a tool, ferret, for closely integrated visualization and analysis. J. Visual. Comp. Animat. 7, 149–157.
Harding, M.,1993. Redgrave and lopham fens, East Anglia, England: A case study of change in flora and fauna due to groundwater abstraction. Biol. Conserv. 66, 35–45.
Holland, K.L., Tyerman, S.D., Mensforth, L.J., Walker, G.R.,2006. Tree water sources over shallow, saline groundwater in the lower River Murray, south-eastern Australia: implications for groundwater recharge mechanisms. Aust. J. Bot. 54, 193–205.
Horner, G.J., Baker, P.J., Mac Nally, R., Cunningham, S.C., Thomson, J.R., Hamilton, F.,2009. Mortality of developing floodplain forests subjected to a drying climate and water extraction. Global Change Biol. 15, 2176–2186.
Horton, J.L., Kolb, T.E., Hart, S.C.,2001. Physiological response to groundwater depth varies among species and with river flow regulation. Ecol. Appl. 11, 1046–1059.
Jurskis, V.,2005. Eucalypt decline in Australia, and a general concept of tree decline and dieback. Forest Ecol. Manag. 215, 1–20.
Kail, J., Arle, J., Jähnig, S.C.,2012. Limiting factors and thresholds for macroinvertebrate assemblages in European rivers: empirical evidence from three datasets on water quality, catchment urbanization, and river restoration. Ecol. Indic. 18, 63–72.
Kath, J.,2012. Integrating hydrology and land use to understand the ecology of floodplain wetlands in the Condamine Catchment, southern Queensland, Australia Unpublished PhD thesis, University of Southern Queensland, Toowoomba QLD Australia.
Kelly, B., Merrick, N., 2007, Groundwater knowledge and gaps in the Condamine Alliance area. NCGM Report 2006/9d. National Centre for Groundwater Management (NCGM), University of Technology, Sydney NSW Australia.
Koenker, R., Bassett, G.,1978. Regression quantiles. Econometrica 46, 33–50.
Koenker, R., Ng, P., 2012, SparseM: Sparse Linear Algebra. R package version 0.96. Available at:http://CRAN.R-project.org/package=SparseM, accessed 27.08.2013.
Lamontagne, S., Cook, P.G., O’Grady, A., Eamus, D.,2005. Groundwater use by vegetation in a tropical savanna riparian zone (Daly River, Australia). J. Hydrol. 310, 280–293.
Laurance, W.F., Dell, B., Turton, S.M., Lawes, M.J., Hutley, L.B., McCallum, H., Dale, P., Bird, M., Hardy, G., Prideaux, G., Gawne, B., Mcmahon, C.R., Yu, R., Hero, J.-M., Schwarzkopf, L., Krockenberger, A., Douglas, M., Silvester, E., Mahony, M., Vella, K., Saikia, U., Wahren, C.-H., Xu, Z., Smith, B., Cocklin, C.,2011. The 10 Australian ecosystems most vulnerable to tipping points. Biol. Conserv. 144, 1472–1480.
Loh, W.Y., 2002. Regression tree with unbiased variable selection and interaction detection. Statist. Sinica 12, 361–386. GUIDE package v12.6 available at: http://www.stat.wisc.edu/~loh/guide.html, accessed 15.03.2013.
Loh, W.Y.,2010. User Manual for GUIDE 9.0. Department of Statistics. University of Wisconsin–Madison, Madison Wisconsin USA.
McDowell, N., Pockman, W.T., Allen, C.D., Breshears, D.D., Cobb, N., Kolb, T., Plaut, J., Sperry, J., West, A., Williams, D.G., Yepez, E.A.,2008. Mechanisms of plant survival and mortality during drought: why do some plants survive while others succumb to drought? New Phytol. 178, 719–739.
McKay, A., Goudie, S., Lee, L.,1999. Water resources. In: Harris, P., Biggs, A., Stone, B., Crane, L., Douglas, N. (Eds.), Central Downs Land Management Manual: Resource Information Book. Department of Natural Resources, Brisbane QLD Australia.
Mensforth, L.J., Thorburn, P.J., Tyerman, S.D., Walker, G.R.,1994. Sources of water used by ripirianEucalyptus camaldulensisoverlying highly saline groundwater. Oecologia 100, 21–28.
Murphy, B.F., Ribbe, J.,2004. Variability of southeast Queensland rainfall and climate indices. Int. J. Climatol. 24, 703–721. Naiman, R.J., Décamps, H.,1997. The ecology of interfaces: riparian zones. Annu. Rev. Ecol. Syst. 28, 621–658.
Naumburg, E., Mata-Gonzalez, R., Hunter, R., Mclendon, T., Martin, D.,2005. Phreatophytic vegetation and groundwater fluctuations: a review of current research and application of ecosystem response modeling with an emphasis on Great Basin Vegetation. Environ. Manage. 35, 726–740.
Overton, I.C., Jolly, I.D., Slavich, P.G., Lewis, M.M., Walker, G.R.,2006. Modelling vegetation health from the interaction of saline groundwater and flooding on the Chowilla floodplain, South Australia. Aust. J. Bot. 54, 207–220.
Porter, J.W.,2002. Impacts of water management options on flows in the Condamine River in Southern Queensland. Water Sci. and Technol. 45, 233–240. QDEH,, 2009, Stream flow data. Queensland Department of Environment and Heritage (QDEH), Brisbane QLD Australia. Available at: http://
watermonitoring.derm.qld.gov.au/host.htm, accessed 27.08.2013.
QDERM,, 1999, Land use Mapping Data. Queensland Government Department of Environment and Resource Management (QDERM), Brisbane QLD Australia. QDERM,, 2009, Queensland groundwater data. Queensland Department of Environment and Resource Management (QDERM), Brisbane QLD Australia.
Available at:http://www.nrm.qld.gov.au/services_resources/item_list.php?category_id=206, accessed 27.08.2013.
QDNRM,, 2005, Digital elevation model (DEM). Queensland Department of Natural Resources (QDNRM), Brisbane QLD Australia. Available at: http://www.nrm.qld.gov.au/services_resources/item_details.php?item_id=1684, accessed 27.08.2013.
R Development Core Team,, 2011, R: A Language and Environment for Statistical Computing. R Foundation for Statistical Computing, Vienna Austria. Available at:http://www.r-project.org, accessed 27.08.2013.
Reardon-Smith, K.M.,2011. Disturbance and resilience in riparian woodlands on the highly-modified Upper Condamine floodplain Unpublished PhD thesis, University of Southern Queensland, Toowoomba QLD Australia.
Reid, N., Nadolny, C., Banks, V., O’Shea, G., Jenkins, B., 2007,Causes of eucalypt tree decline in the Namoi Valley, NSW. Final Report. Land and Water Australia, Canberra ACT Australia.
Rice, K.J., Matzner, S.L., Byer, W., Brown, J.R.,2004. Patterns of tree dieback in Queensland, Australia: the importance of drought stress and the role of resistance to cavitation. Oecologia 139, 190–198.
Ridgeway, G., 2012, Gbm: generalized boosted regression models. R package version 1.6-3.2. Available at:http://cran.r-project.org/web/packages/gbm/ index.html, accessed 27.08.2013.
Rood, S.B., Patiño, S., Coombs, K., Tyree, M.T.,2000. Branch sacrifice: cavitation-associated drought adaptation of riparian cottonwoods. Trees-Strut. Funct. 14, 248–257.
Schenk, H.J., Jackson, R.B.,2002. Rooting depths, lateral root spreads and below-ground/above-ground allometries of plants in water-limited ecosystems. J. Ecol. 90, 480–494.
Smith, H.,2000. The status and conservation of the fen raft spider,Dolomedes plantarius. at Redgrave and Lopham Fen National Nature Reserve. England. Biol. Conserv. 95, 153–164.
Stone, R.C., Hammer, G.L., Marcussen, T.,1996. Prediction of global rainfall probabilities using phases of the Southern Oscillation Index. Nature 384, 252–255.
Stromberg, J.C.,2013. Root patterns and hydrogeomorphic niches of riparian plants in the American Southwest. J. Arid Environ. 94, 1–9. Stromberg, J.C., Patten, D.T.,1996. Instream flow and cottonwood growth in the eastern Sierra Nevada of California. USA. Regul. River 12, 1–12. Stromberg, J.C., Tiller, R., Richter, B.,1996. Effects of groundwater decline on riparian vegetation of semiarid regions: The San Pedro. Arizona. Ecol. Appl. 6,
113–131.
Stromberg, J.C., Tress, J.A., Wilkins, S.D., Clark, S.D.,1992. Response of velvet mesquite to groundwater decline. J. Arid Environ. 23, 45–58.
Thoms, M.C., Parsons, M.,2003. Identifying spatial and temporal patterns in the hydrological character of the Condamine-Balonne River, Australia, using multivariate statistics. River Res. Appl. 19, 443–457.
Thorburn, P.J., Walker, G.R.,1994. Variations in stream water-uptake by Eucalyptus camaldulensis with differing access to stream water. Oecologia 100, 293–301.
Tyree, M.T., Ewers, F.W.,1991. The hydraulic architecture of trees and other woody plants. New Phytol. 119, 345–360.
Tyree, M.T., Sperry, J.S.,1988. Do woody plants operate near the point of catastrophic xylem dysfunction caused by dynamic water stress?: answers from a model. Plant Physiol. 88, 574–580.
Wamelink, G.W.W., De Knegt, B., Pouwels, R., Schuiling, C., Wegman, R.M.A., Schmidt, A.M., Van Dobben, H.F., Sanders, M.E.,2013. Considerable environmental bottlenecks for species listed in the Habitats and Birds Directives in the Netherlands. Biol. Conserv. 165, 43–53.