BIS RESEARCH PAPER NUMBER 159
Tracking the impact of 24+ Advanced
Learning Loans
John has been working in social research for the past eleven years specialising in the
areas of further and higher education.
Graham Keilloh
is a Research Manager in Ipsos MORI’s Employment, Welfare and Skills
research team. Graham has worked in social research for Ipsos MORI since 2003.
Rachael Emmett
is a Senior Research Executive specialising in Education and Skills
research. Rachael graduated from the London School of Economics with a BSc in Social
Policy with Government.
The views expressed in this report are the authors’ and do not necessarily reflect those of
the Department for Business, Innovation and Skills.
Department for Business, Innovation and Skills
1 Victoria Street
London SW1H 0ET
www.gov.uk/bis
Contents
1. Introduction ... 7
1.1. Introduction to the research ... 7
1.2. Aims ... 7
1.3. The research audiences ... 7
1.4. Conventions ... 8
2. Summary of main findings ... 11
2.1. Awareness of 24+ Loans amongst research audiences ... 11
2.2. Knowledge of the 24+ Loans policy ... 12
2.3. Attitudes towards the purpose of 24+ Loans ... 13
2.4. Reported response to 24+ Loans ... 14
3. Learning providers ... 16
3.1. Summary ... 16
General awareness ... 16
Knowledge of specific aspects of the Loans ... 16
Provider’s preparedness for 24+ Loans ... 17
Attitudes towards loans ... 17
The influence of loans on providers ... 18
3.2. Introduction ... 18
3.3. Awareness ... 19
3.4. Information sources ... 20
3.5. Knowledge of specific aspects of 24+ Loans ... 23
3.6. Preparedness for 24+ Loans ... 25
Preparedness in relation to business planning ... 26
3.7. Attitudes to loans ... 28
3.8. Attitudes towards the potential impact of 24+ Loans ... 30
3.9. The influence of loans on decision-making ... 32
4. Apprentice employers ... 37
4.1. Summary ... 37
4.2. Introduction ... 38
4.3. Awareness and understanding ... 39
Overall awareness ... 39
Knowledge of eligibility criteria ... 41
Terms and conditions ... 45
Information ... 46
4.4. Preparedness ... 47
4.5. Attitudes to loans ... 48
Attitudes to training ... 48
Contributing to fees ... 50
Views on loan implementation ... 51
4.6. Likely future response ... 52
Continuing offering Apprenticeships where a 24+ Loan is involved ... 52
Stopping the Apprenticeship framework and doing the technical certificate only ... 56
Influence on the Apprenticeship offer ... 57
5. Potential Learners ... 59
Awareness of loans ... 59
Information sources about loans ... 60
Attitudes to loans... 60
5.2. Awareness of loans ... 61
5.3. Motivations for doing a course ... 61
5.4. Awareness and understanding of loans ... 62
5.5. Eligibility criteria ... 63
5.6. Terms and conditions ... 65
Earnings threshold ... 66
5.7. Uses for 24+ Loan ... 66
5.8. Information sources about 24+ Loans ... 67
5.9. Attitudes to loans ... 69
5.10. Positive aspects of loans ... 70
Concerns regarding the loans ... 72
5.11. Likely future response ... 73
6. Technical Annex ... 79
6.1. Sampling ... 79
Providers ... 79
Apprentice employers ... 79
Potential Level 3 Learners ... 80
6.2. Fieldwork ... 82
6.3. Response rates ... 82
6.4. Non-response and corrective weighting ... 84
6.5. Wave 2 Questionnaires ... 86
Apprentice Employer Questionnaire ... 108
Learner Questionnaire ... 128
6.6. Advance letters ... 152
Providers ... 152
Employers ... 153
6.7. Social grade definitions ... 154
6.8. Sample Profiles ... 155
Providers ... 155
Apprenticeship employers ... 157
1. Introduction
1.1. Introduction to the research
In November 2010, the Government’s skills strategy, Skills for Sustainable Growth and Investing in Skills for Sustainable Growth was launched and developed further in New Challenges, New
Chances at the end of 2011. Together, they set out how the skills system will be redesigned to better engage people in learning, improve the skills of the workforce and enhance the performance of the economy.
As part of this strategy, 24+ Advanced Learning Loans (24+ Loans) are being introduced. The previous system for people aged 24+ studying Level 3 (L3) qualifications is being replaced with a new loans system, similar to those available for studying at HE. The aim of which is to enable funding to be targeted on priority groups such as young adults and those seeking work, as well as delivering further benefits, such as:
• Giving greater responsibility and choice to adult learners - increasing engagement and encouraging a more focussed selection of subjects with stronger labour market outcomes.
• Improving the quality and relevance of courses as employers and students demand more from providers.
• Simplifying and improving the funding processes for providers.
This major change to Further Education in England is being introduced in a fairly short period of time.
1.2. Aims
In order to assess their potential impact and to better target communications, BIS commissioned Ipsos MORI to undertake research with its three key audiences likely to be affected by the
introduction of the loans: providers of Further Education; employers of apprentices; and, potential L3 + learners aged 24+. The ultimate aim of the research was to provide the basis for an evidence-based implementation strategy for the FE loans, which both effectively targets resources and support, and is credible to the full range of stakeholders.
1.3. The research audiences
The employer audience was defined as employers of apprentices because this was the most critical audience for the policy. 24+ Loans will affect Advanced and Higher Apprenticeships and this is by far the most important cohort affected by the proposals. These employers currently fund or partly fund the training of their employees’ Apprenticeships. These employers were further defined as those with current or recent experience of employees on Level 3 learning.
The hardest group to research was “potential learners”. The policy came into effect in August 2013, so the research needed to define and identify those who were the right age and who were likely to study at Level 3 or 4 from this point in the academic cycle. This audience were screened from two sources: Those from the Individualised Learner Record (ILR) who were studying in the 2012 academic year at L2; and from the general public. The screening identified those stating they were likely to study a relevant qualification in 2013/14.
1.4. Conventions
Table 1.1: Naming conventions
Pronoun An interviewee representing...
Provider A learning or training provider
FE College A Further Education College
Other provider Another type of learning provider
Larger provider A provider listed on the ILR as having 301 or more
learners
Smaller provider A provider listed on the ILR as having 300 or fewer learners
Employer An organisation that employs apprentices
Larger employer An employer with 50 or more employees in total
Smaller employer An employer with fewer than 50 employees in total
Larger apprentice employer An employer with 5 or more apprentices Smaller apprentice employer An employer with fewer than 5 apprentices
Potential L3 learners Those screened from the general public and the Individualised Learner Record (ILR) who said they were at least fairly likely to take part in L3 learning in September 2013
Current learners The above who were screened from the ILR
General public The above who were screened using the Ipsos MORI
Capibus or through random Digit Dialling (RDD)
W1 / W2 Wave 1 / Wave 2
24+ Loans / Loans / The policy 24+ Advanced Learning Loans
Table 1.2: Aggregate level phrasing
Knowledge Usage Agree / disagree Usage
Know a lot Know at least a fair
amount, or aware
Strongly agree
Agree
Know a fair amount Tend to agree
Know a little
Know a little at most, or unaware
Tend to disagree
Disagree Heard of but know
2. Summary of main findings
2.1. Awareness of 24+ Loans amongst research audiences
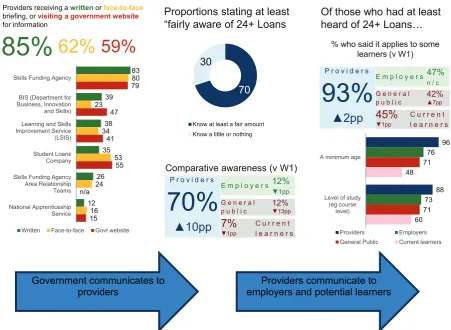
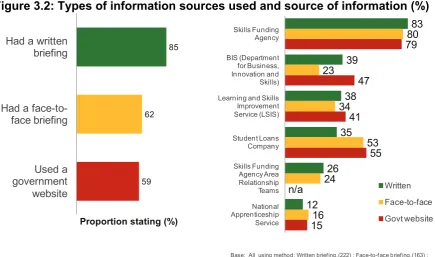
Awareness of 24+ Loans was much higher amongst providers than either apprentice employers or potential L3 learners. This is not unexpected as the policy strategy was to use providers as the conduit for information to other audiences. Figure 2.1 summarises this communication strategy and uses some of the research findings to illustrate its success at the time each audience was
surveyed at Wave 2. The key government agencies providing information to providers were the Skills Funding Agency, the Student Loans Company, BIS and LSIS and, in the main, these agencies were successful in raising awareness amongst providers by January 2013. As a result, only 4% said they knew nothing - seven in ten providers (70%) stated they had a lot or a fair amount of knowledge of 24+ Loans by this point.
[image:11.595.71.523.438.768.2]What had not happened by May/June 2013 was the next stage of the process – the transmission of this information to employers and potential L3 learners. Relatively small proportions of each said they were at least fairly aware of the loans policy in late spring 2013.
Figure 2.1: Comparative awareness of each research audience
85%
62%
59%
Providers receiving a writtenor face-to-face
briefing, or visiting a government website
for information 83 39 38 35 26 12 80 23 34 53 24 16 79 47 41 55 n/a 15
Skills Funding Agency
BIS (Department for Business, Innovation and Skills) Learning and Skills Improvement Service (LSIS)
Student Loans Company
Skills Funding Agency Area Relationship Teams
National Apprenticeship Service
Written Face-to-face Govt website
70 30
Know at least a fair amount Know a little or nothing
70%
▲10pp
Comparative awareness (v W1) 12%
▼1pp
7%
▼1pp
P r o v i d e r s
E m p l o y e r s
C u r r e n t l e a r n e r s
12% ▼13pp
G e n e r a l p u b l i c
96 88 76 73 71 71 48 60
A minimum age
Level of study (eg course
level)
Providers Employers General Public Current learners
93%
▲2pp
% who said it applies to some learners (v W1)
47%
n / c
45%
▼1pp
P r o v i d e r s
E m p l o y e r s
C u r r e n t l e a r n e r s
42% ▲7pp
G e n e r a l p u b l i c
Proportions stating at least
“fairly aware of 24+ Loans Of those who had at least heard of 24+ Loans…
Government communicates to
The lack of awareness of the policy amongst employers and potential L3 learners is exemplified by the lack of knowledge of key policy attributes. By the second wave of research, nearly all providers who had at least heard of the policy knew that it only applied to some learners. Of this group, 96% knew a minimum age applied and 88% knew that the level of the learner affected eligibility. In comparison, less than half of employers and potential L3 learners knew the policy only applied to some learners. Similarly, these two audiences were less able to identify the key policy attributes concerning age and level.
2.2. Knowledge of the 24+ Loans policy
Each audience’s knowledge of the detail of 24+ Loans policy was linked to their awareness; providers were far more knowledgeable than either employers or potential L3 learners. Even so, providers were less sure on some of the specific details. As noted above, the vast majority of providers knew learners were eligible if they had reached a minimum age and were studying at a certain level. However, just over three quarters who had at least heard of the policy (77%) knew the minimum age was 24. More providers knew that Level 3 programmes were covered by the policy (98%). Again, by January 2013 the majority of providers (96%) knew there was a minimum salary needed before repayments began, but just over seven in ten (72%) of this group knew the salary was £21,000.
Employers and potential L3 learners knew less than providers about the policy instruments which is unsurprising given they were less aware overall. Fewer than half of employers and potential L3 learners knew the policy only applied to some learners. Around three quarters of these employers said that learners needed to be a certain age and study at a certain Level 3 to be eligible. The general public reported higher levels of knowledge than those in learning at the time of the survey, for example more of the general public knew about the minimum age requirement.
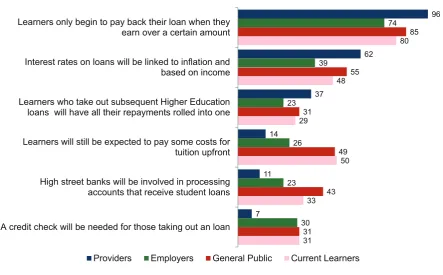
It was clear that all audiences were unsure about some of the specific details during the second wave of surveys1. As Figure 2.2 (overleaf) shows, providers were more knowledgeable than
employers and potential L3 learners on some of the specific policy elements. However, there were still some providers who felt some criteria applied which do not (such as an expectation that some fees will be paid up front, or that high street banks are involved in processing the loans). Figure 2.2 (overleaf) clearly shows these misconceptions were much more prevalent amongst employers and potential L3 learners who said they had at least heard of the loans.
Figure 2.2: Knowledge of specific elements of 24+ Loans (%)
31 33 50 29 48 80 31 43 49 31 55 85 30 23 26 23 39 74 7 11 14 37 62 96A credit check will be needed for those taking out an loan High street banks will be involved in processing accounts that receive student loans Learners will still be expected to pay some costs for tuition upfront Learners who take out subsequent Higher Education loans will have all their repayments rolled into one Interest rates on loans will be linked to inflation and based on income Learners only begin to pay back their loan when they earn over a certain amount
Providers Employers General Public Current Learners
2.3. Attitudes towards the purpose of 24+ Loans
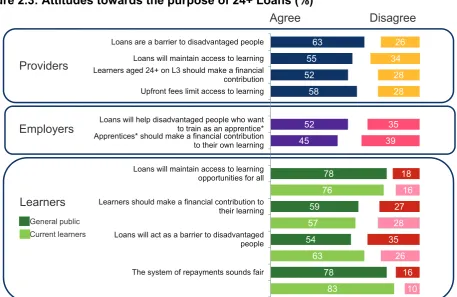
Each research audience had a generally positive attitude towards 24+ Loans. One purpose of the policy is to ensure that access to learning is improved by delaying payment until after the learner earns over a certain amount. Moving payment from the point of enrolment to the time when learner earner earns over a threshold removes the immediate financial barrier faced by learners. More providers agreed than disagreed with most statements about improving access (Figure 2.3 overleaf). However, there was a mixed picture as the majority of providers agreed that loans will maintain access to learning opportunitiesand that loans will act as a barrier to disadvantaged people who want to learn at Level 3 or above. Whilst apparently contradictory, these responses suggest that providers think overall access with be maintained at the possible expense of the more disadvantaged. Communications to providers should address this point.
Figure 2.3: Attitudes towards the purpose of 24+ Loans (%)
Agree Disagree Providers 83 78 63 54 57 59 76 78 45 52 58 52 55 63 7 11 11 15 14 8 4 16 13 14 20 12 11 10 16 26 35 28 27 16 18 39 35 28 28 34 26The system of repayments sounds fair Loans will act as a barrier to disadvantaged people Learners should make a financial contribution to their learning Loans will maintain access to learning opportunities for all Apprentices* should make a financial contribution to their own learning Loans will help disadvantaged people who want to train as an apprentice* Upfront fees limit access to learning Learners aged 24+ on L3 should make a financial contribution Loans will maintain access to learning Loans are a barrier to disadvantaged people
Employers
Learners General public Current learners
* The question stipulated advanced and higher apprentices
2.4. Reported response to 24+ Loans
Each of the different research audiences were asked different questions relating to how they would respond to the 24+ Loans policy. As noted above providers were generally positive although they were more mixed about whether loans maintained access to disadvantaged groups. Providers did though agree that loans would change the FE landscape (70% agreed with this) and that they feared the policy would be overly bureaucratic (although the proportion saying this has fallen). Providers also felt it would lead to a fall in apprenticeships.
A third of employers (34%) agreed that their organisation would stop offering Apprenticeships as a result of the policy whilst a half (48%) disagreed and the main reasons cited for stopping
Apprenticeships were financial. Two in five of employers that would stop offering Apprenticeships said they could not afford the fees and a quarter said they could not or would not pay fees. At Wave 2, three in ten employers said they would be fairly or very likely to offer a technical certificate only rather than a full Apprenticeship as a result of the loans. Furthermore, employers with 5 or more apprentices were more likely to say this.
(within which employers were more likely to traditionally offer Apprenticeships) were those that were least likely to predict an impact on training.
Potential learners were screened as part of the interview process and only those who said they
were at least fairly certain to take part in Level 3 learning were asked the full questionnaire. Learners were asked again about their intentions to learn after completing the survey. Around one in ten of the general public and one in seven of current learners said they probably or definitely would not want to study.
3. Learning providers
3.1. Summary
General awareness
Of the three research audiences, providers were by far the most aware of 24+ Loans. This is important because BIS’s communication strategy relies on using providers as a channel for reaching learners and providers. Encouragingly, awareness grew significantly by ten percentage points between the autumn of 2012 and January 2013 – a relatively short time frame. Furthermore, it is also possible that awareness has continued to improve since the research was carried out as further events and briefings have been carried out by the Skills Funding Agency.
The data did suggest that some work was still required to raise awareness at the time of the second survey wave. Three in ten providers knew a little at best about the loans and the vast majority of this group (86%) were “other providers” such as private training providers, local authorities, charities and employers running their own training. Just 13% of FE Colleges knew a little at best about 24+ Loans.
It is unsurprising to find that providers who were at least fairly aware of 24+ Loans were also more likely to feel prepared for their introduction. Similarly, aware providers were also more likely to have considered the Loans as part of their business plan and to think that the policy will influence the number or courses they offer, and the subject and level of these courses in some way.
All of those who had at least heard about the Loans were asked where they got their information from. By W2, nearly all providers who had at least heard about the Loans (94%) used the Skills Funding Agency Update; even those who knew a little at most were very likely to have used this source (88%). What is clear is that even those who said they were less aware still used a lot of different ways of getting information.
Knowledge of specific aspects of the Loans
In the main, providers were able to identify key aspects of the policy, and to recognise attributes that did not apply. One of the key points of difference between providers and employers/potential learners was the ability of providers to correctly identify aspects that were not applicable to 24+ Loans.
(88%) knew that the learners were eligible based on their level of study. However, providers were less certain on the details. Whilst nearly every provider who identified the level of study as a criterion knew that Level 3 learners were eligible (98%), fewer said those at Level 4 were (88%). Six percent of these providers also said learners studying at Level 2 were eligible. Three quarters of providers (77%) said those aged 24 or above were eligible.
The same applied for the terms and conditions of Loans: providers were better at recognising the broad elements, but less sure on the detail. Nearly all providers (96%) knew that learners only begin to pay back their loan when they earn over a certain amount but only seven in ten of this group (72%) correctly identified that amount as £21,000 per annum. Six in ten providers (62%) correctly said that interest rates on loans will be linked to inflation and based on income.
Provider’s preparedness for 24+ Loans
Four in five providers (78%) felt at least fairly prepared for the Loans at W2, a figure that 21 percentage points higher than at W1. Nearly all FE Colleges felt prepared (96%) compared to seven in ten other providers (70%). Similarly, larger providers (87%) were felt more prepared than smaller ones.
Over a quarter of providers (77%) had taken 24+ Loans into account in their business plan and this had also increased significantly from W1 (by 11 percentage points). As above, larger providers and FE Colleges were more likely to have considered Loans in their business plan as were providers who were aware and prepared for the policy.
Attitudes towards loans
Providers tended to be positive about the policy, although concerns about access were raised by a minority. Providers were more likely than not to agree that the Loans will maintain access to learning opportunities and that upfront fees limit access to further education. However, nearly two thirds agreed (63%) with the statement loans will act as a barrier to disadvantaged people. In the main, awareness of the policy did not affect attitudes about it, which suggests not all providers have been convinced on the policy arguments.
In January 2013, most providers (71%) though there was enough time to develop communications before August 2013. There was little statistical difference in this view by the type of provider or levels of awareness and/or preparedness.
say they wanted more information on the practical aspects of operating the 24+ Loans system rather than other general information on the policy such as eligibility criteria.
The influence of loans on providers
Providers thought the policy would have more influence on operational matters rather than the way they structured their learning. For example, three quarters thought that it would influence the time they spent with learners explaining the Loans (75%). Around two thirds of providers said Loans would influence their Management Information Systems (68%) and enrolment processes (67%).
Fewer providers felt the structure of their learning would be influenced as a result of loans. Under half (45%) said 24+ Loans would be at least fairly influential on the Level of courses they offer and 41% said it influence subjects and the number of courses. However, there was no consensus on the direction of that change: similar numbers of providers said that the number of courses offered would increase as decrease; or that the number of courses and/or subjects offered would broaden as narrow.
3.2. Introduction
Learners starting on eligible courses on or after 1st August 2013 can apply for a 24+ Loan2. This date is important in the context of research with providers which was carried out in two waves. Fieldwork for Wave 1 (W1) took place between 27 August and 15 October 2012; for Wave 2 (W2) fieldwork took place between 8 and 30 January 2013. Representatives of learning providers3 (referred to as “providers” in this report) were therefore responding 10 or 11 months before
implementation at W1, and 7 and 8 months before implementation at W1. The position at the time of writing (July 2013) is possibly different for providers given that 24+ Loans will soon become a reality.
Learning providers fall into two groups. On one hand, the majority of large FE Colleges claimed to be aware and prepared for the loans. Conversely, smaller providers that were not FE Colleges were less aware and, as a consequence, less prepared. This group was mostly composed of private training providers. One caveat on this general finding is the proportion of learners thought, by the provider, to be affected by 24+ Loans. Around one in twenty (6%) providers across both waves thought that none of their learners were affected by the new policy. Providers with 300 learners or fewer were nearly twice as likely to think this (10%).
2 See https://www.gov.uk/advanced-learning-loans
3 The screening question sought an interview with the person within [an] organisation who has the most
However, if these providers are removed for the purpose of analysis, the same general trend held; larger FE colleges were in a better state of readiness for 24+ Loans than smaller providers.
3.3. Awareness
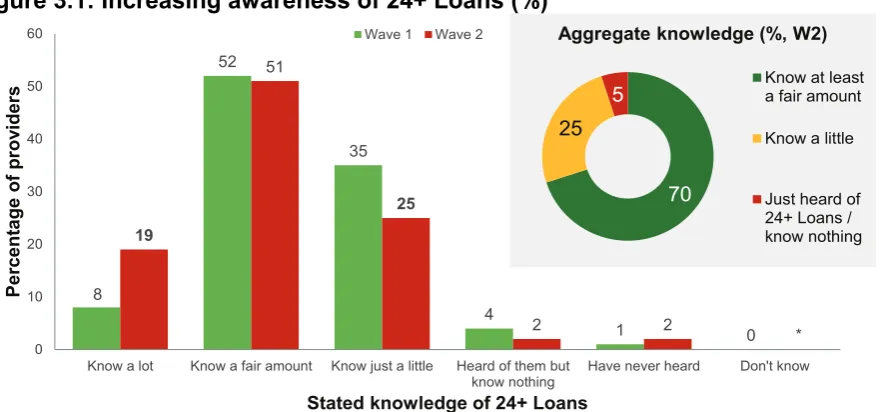
[image:19.595.70.512.256.462.2]Overall awareness of 24+ Loans was fairly high at Wave 2 (W2) as seven in ten providers (70%) said they knew at least a fair amount4 about the policy. As shown in Figure P1, the two statistically significant changes between W1 and W2 were a fall in the proportion saying know just a little about 24+ Loans and an increase in those saying know a lot (bold figures).
Figure 3.1: Increasing awareness of 24+ Loans (%)
8 52 35 4 1 0 19 51 25
2 2 *
0 10 20 30 40 50 60
Know a lot Know a fair amount Know just a little Heard of them but
know nothing Have never heard Don't know
Pe rc enta ge of pr ov ide rs
Stated knowledge of 24+ Loans
Wave 1 Wave 2
Base: All (Wave 1: 255; Wave 2: 266)
70 25
5
Aggregate knowledge (%, W2)
Know at least a fair amount
Know a little
Just heard of 24+ Loans / know nothing
As might be expected, the level of knowledge relates to many other survey measures, including the type of learning provider and the extent to which 24+ Loans have been considered in business planning.
Nearly nine in ten (87%) Further Education Colleges5 knew at least a fair amount about 24+ Loans compared to six in ten (62%) of other types of provider. Providers with over 300 learners and those with 500 or more employees were also more likely to know at least a fair amount (82% and 80% respectively).
4 A convention is used in the survey to denote aggregate measures. Those knowing “at least a fair amount”
is an aggregate of know a lot and know a fair amount
5 This is a shorthand for the person within a Further Education College who had the most responsibility for
Providers that had accounted for 24+ Loans in their business plan were also more likely to say they were knowledgeable: three quarters of these providers (76%) said they know at least a fair amount about 24+ Loans compared to half (50%) that had not accounted for 24+ Loans in their planning.
In the main, the more aware were also the more prepared as six in ten providers said they were at least fairly prepared and knew a fair amount about the Loans (figures in the black box).
Table 3.1: Relationship between awareness of, and preparedness for 24+ Loans
How much, if anything, would you say you know about loans
in Further Education? Would you say you...?
Overall, in your opinion, how prepared is your organisation
for the introduction of 24+ Advanced Learning Loans? Total Very
prepared prepared Fairly prepared Not very Not at all prepared Don't know
Know a lot 3% 14% 2% * 19%
Know a fair amount 2%
43%
5% 1% *51%
Know just a little 1% 14% 6% 3% * 25%
Have heard of them but know
nothing about these loans 2% 1% 2%
Have never heard of these
loans before today * 1% 1% 2%
Don't know *
Total 6%
73%
13% 7% 2% 100%Figures in bold indicate statistically significant difference between sub-groups and/or overall * means figure is less than 0.5%
Those who were more aware were also more prepared and had better knowledge of policy attributes. This relationship is considered in greater detail later.
3.4. Information sources
Overall awareness increased significantly between W1 and W2 by ten percentage points and this shows communications generally about 24+ Loans had a positive effect during this time. In part, changing awareness was due to a higher level of interest from providers as, between waves, the median number of different sources used to find out about 24+ Loans increased from 6 to 76. What this means is providers used a broader number of information sources at W2, as shown in Table 1. The Skills Funding Agency Update was the source most commonly at W1 and W2. As
indicated by bold figures, a variety of the other sources were used more often by W2 and only one source was used significantly less: specialist education sector press and media.
Table 3.2: Which of the following sources have you used to find out about loans in
Further Education?
Sources about loans W1 W2 W2 – low
awareness
Base 252 259 68
Skills Funding Agency Update 92% 94% 88%
Written briefing documents from a government department or
agency through the post, sent via email or accessed online 74% 85% 69%
General email alert services 66% 75% 66%
Skills Funding Agency Area Relationship Teams 54% 70% 55% Word of mouth from other people working in the sector 61% 65% 59% Learning and Skills Improvement Service (LSIS)- only read
out at W2 1% 63% 51%
Face-to-face briefings from a government department or
agency 50% 62% 32%
General information on Further Education on government
websites 57% 59% 49%
FE and Skills Newsletter 52% 42% 29%
Specialist education sector press and media 46% 42% 32%
Eight of the sources listed were used by at least half of those surveyed in each wave and, by W2, nearly all had used at least one of the top four and most had used more than one. Even those whose knowledge of 24+ Loans was low (i.e. they said they knew a little or had just heard of the loans) had still seen several sources of information. Several factors could account for this:
These providers may have known or thought their learners would not be affected. Indeed,
the low awareness group were more likely to say later in the survey that none of their learners were affected by 24+ Loans (15% compared to 8% overall).
The communications were less effective. Little evidence for this exists, especially as the vast
majority of those who used written or face-to-face briefings rated them as at least fairly useful.
A focus on the operational rather than structural consequences of the loans. As noted later,
The role of Government information sources
Three government information sources were covered in greater detail in the survey: written briefings, face-to-face briefings and government websites. Of these, written briefings were used most often by providers (Figure 3.2) followed by face-to-face briefings and government websites. The Skills Funding Agency (SFA) was the most important source of information when the level of use is taken into account: around four in five providers said they had accessed all three of the listed forms of communication provided by the SFA. Responses regarding the Student Loans Company (SLC) perhaps reflect the channels they have adopted for communication as that organisation was the second most popular option for face-to-face briefings and website use.
[image:22.595.63.499.376.633.2]Finally, the role of the National Apprenticeships Service (NAS) should not be underestimated. Whilst overall usage appears low, providers other than FE Colleges were more likely to cite NAS as an information source. For example, a quarter of “other” providers (25%) said they received a face-to-face briefing from NAS compared to just 2% of FE Colleges. Targeting information in this way is an important element of the 24+ Loans communication strategy.
Figure 3.2: Types of information sources used and source of information (%)
59 62 85 Used a government website Had a face-to-face briefing Had a written
briefing
Proportion stating (%)
Base: All providers at W2: (266)
83 39 38 35 26 12 80 23 34 53 24 16 79 47 41 55 n/a 15 Skills Funding Agency BIS (Department for Business, Innovation and Skills)
Learning and Skills Improvement Service (LSIS) Student Loans Company Skills Funding Agency Area Relationship Teams National Apprenticeship Service Written Face-to-face Govt website
Base: All using method: Written briefing,(222) ; Face-to-face briefing,(163) ; Government Website (156)
Providers were also asked to rate each of the information sources they used on their usefulness. These results were encouraging as nearly all providers (over 90% in nearly all cases) said the sources they used were at least fairly useful. However, towards the end of this chapter we discuss the information gaps mentioned by providers. These centred on organisational and administrative aspects of managing 24+ Loans (such as MIS systems and enrolments) and this sort of
3.5. Knowledge of specific aspects of 24+ Loans
As awareness between W1 and W2 increased by 10 percentage points we would expect more providers to correctly identify the principle attributes of the 24+ Loans policy at W2 and this is borne out by the findings.
The survey asked do you know if all learners in Further Education are affected by the introduction of loans, or just some of them? At W2, 93% of providers said that the policy affected some
learners7 compared to 90% at W1. Although higher, the W2 figure is not a significant increase. Those who said some learners were affected were asked a subsequent set of questions on eligibility criteria such as age, level and income.
Figure 3.3 shows that nearly all providers who knew 24+ Loans affect some learners said a minimum age applied (96%) and, of this group, over three quarters (77%) knew 24 was that age and this is a 16 percentage point increase from W1.
Figure 3.3: Awareness of loan eligibility criteria (%)
24 2 61 10 16 94 48 56 17 8 19 15 2 77 7 6 98 88 72 12 7 9 0 20 40 60 80 100 A
ged 20 or younge
r
A
ged 21 t
o
23
A
ged 24
A
ged 25 t
o 30 Lev el 2 Lev el 3 Lev el 4 £21k U nder £21k O ver £21k D on' t k now Wave 2 Wave1
72 Statistically significant change at W2
Bases – A minimum age applies. W1: 221 ; W2: 234 Bases – A level of study applies. W1: 205; W2: 215 Bases – Minimum earnings before repayment. W1: 237; W2: 249
*Note that there has been question approach differences between waves on this measure
Similarly, providers at W2 were significantly more likely to know the policy affected Level 3 learning (94% to 98%) and providers were twice as likely to say Level 4 learners were affected (88% from 48% at W1).
By W2, the exact salary at which learners needed to pay back their loan was still the least
understood policy attribute. While nearly all (96%) knew that learners only begin to pay back their
loan when they earn over a certain amount, seven in ten (72%) correctly identified the salary as £21,000. Roughly twice as many underestimated this value as over-estimated and nearly one in ten who knew a minimum value applied did not know the value. Providers that said they knew at least a fair amount about the policy were more likely to give the correct figure.
Furthermore, the extent to which a learner would be expected to pay a tuition fee upfront was not universally understood. At W2, seven in ten providers who had at least heard of 24+ Loans (71%) felt this was not one of the terms and conditions of a 24+ Loan. However, 14% thought it was one of the terms and conditions and same proportion replied “don’t know” to this question.
The proportion of providers giving incorrect answers about many aspects of loans fell between W1 and W2, and the figures in boxes in Figure 3.3 show which of those falls were statistically
significant. However, the data still shows that awareness of the different basic policy elements was still not universal in March 2013 and communications activity which emphasises the age at which learners are eligible and what they need to earn before repaying their loan is still likely to be beneficial.
The lack of awareness of some basic policy elements explains the high lack of awareness in some of the detail. Figure 3.4 (overleaf) shows that nearly all providers knew that Loans were paid back when a learner earns over a certain amount. The extent to which other factors did or did not apply was less well understood. For example, there are no credit checks and eligibility for a 24+ Loan does not depend on income. Seven in ten providers knew credit checks were not needed. Similarly, interest is linked to the Retail Price index (RPI) and the amount paid back is based on total income8 and six in ten providers knew this.
The level of knowledge of the detail held by learning providers is important because they are the main source of information for learners. This is especially important given providers thought
learners knew very little about 24+ Loans. At W2, a half of providers said that learners were “not at all knowledgeable” (51%), and over a third said learners were “not very knowledgeable” (37%). Whilst this was an improvement from W1 when 64% said learners were “not at all knowledgeable”, the concern that those directly affected by 24+ Loans know little about them remains.
8 As outlined in the terms and conditions published by Student Finance England:
Figure 3.4: Perceptions of terms and conditions attached to loans (%)
7
11
14
37
62
96
23 26 14
44 18
2
70
63
71
20
19
2
A credit check will be needed for those taking out an loan High street banks will be involved in processing
accounts that receive student loans Learners will still be expected to pay some costs
for tuition upfront Learners who take out subsequent Higher Education loans will have all their repayments rolled into one Interest rates on loans will be linked to inflation
and based on income Learners only begin to pay back their loan when
they earn over a certain amount
Base: All providers who have at least heard of 24+ Loans W2, (259)
Applies Does not apply Don’t know
Providers said they would use common channels to communicate details of the Loans to learners. Almost nine in ten providers (86%) said their website would be used to inform learners about Loans and around three quarters said they would use “current links with employer organisations” (76%) and their “course prospectus” (72%). FE Colleges were more likely than other providers to use all but the last of these channels, and to use others such as “open days/evenings” (89% versus 50%) and “local media such as newspapers and freesheets” (57% versus 32%). In the main, providers from FE Colleges were more geared up to disseminate information to learners.
As well as the relationship between knowledge of policy elements and awareness, there were statistically significant differences in how prepared providers felt they were for the advent of the new policy, as covered in the next section.
3.6. Preparedness for 24+ Loans
Overall, nearly four in five providers (78%) felt their organisation was at least fairly prepared for the introduction of the Loans. This was an increase of 21 percentage points from W1, which illustrates the lengths that providers had gone to in the intervening three months to prepare.
At W2, nearly all FE Colleges (96%) said they were prepared compared to seven in ten (70%) of other providers. Similarly, larger providers9 were more prepared than smaller providers (87% and 72% respectively).
In part, being prepared is a function of whether the provider thought the loans would affect their learners. As noted earlier, 8% of providers felt that none of their learners were affected. In the case of providers who were unprepared, more than twice as many (19%) said that none of their learners were affected.
Excluding the 8% who said none of their learners were affected still left one in five providers in a position of entering a critical period unprepared for the new policy. Aggregated to the provider population as a whole, this would mean around 140 providers being unprepared in March 2013 although other work conducted later in 2013 by the Skills Funding Agency10 indicated providers were receiving the support they needed. As noted earlier, it was particularly the case that providers with fewer learners felt less prepared; by the same token, 96% of FE Colleges felt at least fairly prepared compared to 70% of other types of provider.
Preparedness in relation to business planning
Part of being prepared is the extent to which an organisation plans, or has realistic expectations of what can be achieved in a finite length of time. At W2, over three-quarters of providers said they had taken 24+ Loans into account in their current business plan (77%) which was a ten percentage point increase from W1. Looking in more detail, there are some fairly predictable determinants of providers who had taken account of Loans in their business plan, including those who are more knowledgeable and prepared for the policy, as well as FE Colleges and large providers. This is illustrated in Figure 3.5 overleaf.
9 With 301 learners or more.
Figure 3.5: Business planning as an indicator of other factors (%)
63 86
73 86
44 87
60 84
77
36 12
26 11
54 12
36 15
21
1 to 600 learners
601 + learners
Non-FE College
FE College
Unprepared for loans
Prepared for loans
Unaware of loans
Aware of loans
Overall
Base: All providers at W2, (266)
Loans taken into account
in plan (%) Loans not taken into account in plan (%)
Nearly nine in ten (87%) of providers that were at least fairly prepared for 24+ Loans had
accounted for them in their business plan and this was twice the proportion who were unprepared. A similar relationship, albeit less strong, existed for levels of awareness, and by type and size of provider. Furthermore, providers with a business plan which included 24+ Loans were more likely to strongly or tend to agree that our organisation will have the systems in place to manage and administer loans by 1 April 2012 (68% compared to 38% of those not accounting for 24+ Loans in their business plan).
Figure 3.6: Aspects of 24+ Loans considered in business plans (%)
Base: All at W2 who are taking loans into account in current business plan (209)
95 95 95 87 83 67 65 The financial impact on your
organisation
The impact on learner numbers
The actions required to manage the impact in your organisation
The impact on the courses you offer
Opportunities arising from the introduction of loans The effect on competition for learners in your local area The wider impact to Further Education in your local area
3.7. Attitudes to loans
Figure 3.7 shows the extent to which providers agreed or disagreed with a range of policy and organisational statements related to loans. In this chart, agree and disagree are aggregates measures where the “strongly...” and “tend to...” responses have been combined.
Figure 3.7: Attitudes towards Loans (%)
34
52
55
58
61
63
71
15 2% 12 14 11 11 752
28
34
28
27
26
21
Without loans, a significant fall in numbers Learners aged 24+ on L3 should make a
financial contribution Loans will maintain access to learning Upfront fees limit access to learning Systems will be in place to manage loans
by April 2013 Loans are a barrier to disadvantaged
people Enough time to develop communications
before August 2013
Base: All providers at W2, (266)
Views between W1 and W2 did not shift much in these measures and the only statement in which a significant difference was found was that loans will act as a barrier to disadvantaged people who want to learn at Level 3 or above. Just under two thirds of providers (63%) agreed11 with this statement at W2 compared to over seven in ten (72%) at W1 i.e., the policy was seen less as a barrier at W2. Although this is positive, it was still the case that more than twice as many providers agreed than disagreed with this statement.
At first glance, the attitudes expressed by some providers appear contradictory. At W2, one in five providers (22%) agreed that loans will maintain access to learning opportunitiesand that loans will act as a barrier to disadvantaged people who want to learn at Level 3 or above. This suggests that the policy was perceived to maintain access to some, but not all. However, as shown in Table 3.3, However, as shown in Table 3.3, only 2% held a strongly contrary view (figures in bold).
Table 3.3: Comparison between views on maintaining access and Loans as a barrier
to the disadvantaged
Loans will act as a barrier to disadvantaged people who want to learn at Level 3 or above (%)
Strongly
agree Tend to agree Neither agree nor disagree
Tend to
disagree Strongly disagree Total
Loans will maintain access to learning opportunities (%)
Strongly
agree 2 2 3 6 5 19
Tend to agree 7 13 5 8 3 36
Neither agree
nor disagree 5 3 * 1 0 10
Tend to
disagree 10 4 1 1 0 16
Strongly
disagree 17 1 * * * 19
Total 41 24 10 17 9 100
* denotes less than 0.5%
Overall, the principle of loans was generally supported. Around twice as many providers agreed than disagreed that further education learners aged 24 and over on Level 3 or above courses should make a financial contribution to their own learning, and that the current system of paying for tuition fees upfront limits access to further education.
Interestingly, providers’ awareness of the policy did not affect attitudes towards the impact on learners. The only significant difference by a provider’s awareness was that our organisation will
have the systems in place to manage and administer loans by 1 April 2012 and, in this case, providers who were at least fairly aware of 24+ Loans were more likely to agree (68%) than those who were less aware (44%). This relationship is unsurprising given the relationship between awareness and preparedness discussed earlier.
Some statistical differences in attitudes toward policy were found by the type of provider. FE Colleges were more likely to agree that loans will maintain access to learning opportunities (64%) than other providers (50%). FE Colleges were also less likely to agree that the current system of paying for tuition fees upfront limits access to further education (49% FE College compared to 62% others). This difference is likely to be a function of the broad range of learning offered by FE Colleges as evidenced by the variety of adult participation in Level 3 and 4 learning12.
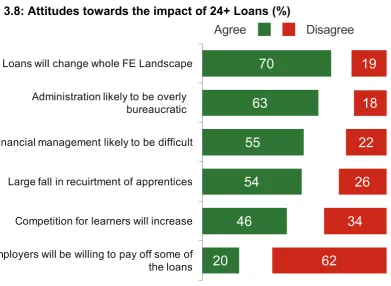
3.8. Attitudes towards the potential impact of 24+ Loans
Figure 3.8 shows the extent to which providers agreed or disagreed with statements related to the impact of 24+ Loans. As before, agree and disagree are aggregate measures of “strongly...” and “tend to...” responses.
Seven in ten providers agreed that the introduction of the loans will change the whole further education landscape, and fewer than one in five disagreed. Over half (54%) of providers agreed that the introduction of loans will mean a large fall in the recruitment of Apprentices. FE Colleges were less likely to agree with this (40%) than other providers (61%).
Figure 3.8: Attitudes towards the impact of 24+ Loans (%)
20
46
54
55
63
70
18
2% 20
23 19
11
62
34
26
22
18
19
Employers will be willing to pay off some of the loans Competition for learners will increase Large fall in recuirtment of apprentices Financial management likely to be difficult Administration likely to be overly
bureaucratic Loans will change whole FE Landscape
Base: All providers at W2, (266)
Agree
Disagree
[image:31.595.93.485.101.387.2]More providers agreed than disagreed that competition for learners will increase between providers as a result of the loans (46% agreed; 34% disagreed). The nature of this competitive change is perhaps reflected in the way 24+ Loans were felt to influence provision. Providers who said that 24+ Loans would be at least fairly influential on the number of courses offered, or the subject of those courses, were more likely to agree that competition will increase, as shown in Table 3.5. The perceived influence of loans on the structure of learning (the number of courses, and the level and subject of learning) is covered in more detail later.
Table 3.5: Relationship between competition and organisational influence of 24+
Loans – Wave 2
Competition for learners will increase between providers as a result of the loans
Overall
(%) The introduction of the loans will be at least influential on your future plans for... fairly The number of courses
offered (%) The subjects offered (%)
Base 266 116 115
Agree 46 57 56
Neither agree nor disagree 15 13 14
Most providers disagreed that employers will be willing to pay off some of their workers’ loans
(62%) and there was little significant variation in the data by sub-group in this measure.
Providers had concerns about the impact of 24+ Loans on administration. Three times as many providers agreed (63%) as disagreed (18%) that administration for the loans system is likely to be overly bureaucratic; although this fell significantly by 12 percentage points between W1 and W2.
In addition, more providers agreed than disagreed that the financial management of the loans system will be difficult (55% agree and 22% disagree). Financial management was more of a concern for smaller providers with 300 or fewer learners; 59% agreed with the statement compared to 50% of larger providers.
The only other significant change between waves was a fall in the proportion agreeing that the introduction of the loans would mean a large fall in the recruitment of apprentices. Whilst this fell by 9 percentage points, over half of providers (54%) still agreed with the statement.
It might be expected that providers’ views might vary depending on their awareness and
preparedness, however there was no statistical variation in the data. Most providers were therefore wary of administration regardless of what they knew or how ready they felt for the advent of 24+ Loans.
3.9. The influence of loans on decision-making
Figure 3.9 shows that providers thought 24+ Loans would influence operational factors more
than the way learning is structured (this is again an aggregate measure where “very” and “fairly”
influential were combined). More providers thought that 24+ Loans would be influential on aspects such as explaining loans to learners, enrolment processes and systems and Management
Figure 3.9: 24+ Loans and their perceived influence (%)
41 41 42
45 46
54
66 67
68 75
The number of courses that you will offer The subjects you will offer Your customer complaints procedures The level of courses you will offer The level of additional financial support you provide
The type of learners support services you provide Your course enrolment agreements with learners
Your enrolment processes Management Information Services in your organisation The time you spend with learners to explain loans
Proportion stating (%)
Base: All at W2 (266)
With respect to operational procedures, three quarters of providers felt that the loans policy would influence the time [spent] with learners to explain the nature of the loan liability and their payment obligations.
Enrolment processes were also perceived to be influenced by 24+ Loans; two thirds of providers said that the introduction of 24+ Loans would influence course enrolment agreements with learners
(66%) and enrolment processes (67%). Just over half of providers thought that there would be no difference in the timing of learner enrolments (54%), whereas roughly the same proportion thought learners would enrol earlier in the academic year (17%) as thought they would enrol later (18%). There were some sub-group differences regarding the timing of enrolments as providers who were more prepared, or had accounted for Loans in their business plan, were slightly more likely to think learners would enrol earlier (21% for both). However, the overall pattern of response within these sub-groups was the same in that most thought 24+ Loans would make no difference to the timing of enrolments.
Table 3.6: Relationship between perceptions of influence on operations and other
factors (%)
Factor Base
Will be influential on... (%) ...Time spent
with learners ...Enrolment processes ...Enrolment agreements ...MIS
Overall (Wave 2) 266 75 67 66 68
Awareness Aware 191 82 73 72 72
Unaware 74 57 51 53 60
Preparedness Prepared 213 83 74 69 74
Unprepared 49 49 45 60 52
Provider type FE College 100 87 81 73 73
Other provider 166 68 60 62 66
Figures in bold indicate statistically significant difference between sub-groups and/or overall
In comparison, fewer providers felt that the structure of learning would be influenced by 24+ Loans. In addition, there was no consensus on how learning would be influenced. Table 3.7 illustrates that the relationship between influence, awareness and preparedness existed in relation to the
structure of learning i.e. the more aware and prepared were more likely to think 24+ Loans would affect the number of courses offered and their level and/or subject.
Table 3.7: Relationship between perceptions of influence on the structure of
learning versus other factors (%)
Factor Base
Will be influential on... (%) ...The level of
courses ...The subject of courses ...The number of courses
Overall (Wave 2) 266 45 41 41
Awareness Aware 191 49 47 48
Unaware 74 36 27 28
Preparedness Prepared 213 49 46 46
Unprepared 49 32 27 29
Provider type FE College 100 50 49 52
Other provider 166 42 37 36
Figures in bold indicate statistically significant difference between sub-groups and/or overall
sector-wide response. The only significant difference by the type of provider regarded subjects as FE colleges were less likely broaden the range of subjects they offer compared to other providers.
Figure 3.10: Influence of policy on the structure of provider’s courses (%)
Base: All stating that loans would be an influence for each factor at W2: Number of courses (116); Subject of courses (115); Level of courses (123) 15
32 34
11 7
Influence on number (%, W2)
Increase Decrease
Different mix of levels/subjects No change
Don't know
23
21 27
20
9
Influence on subject (%, W2)
Broaden Narrow
Different mix of levels/number No change
Don't know
25
18 27
25
5
Influence on level (%, W2)
Broaden Narrow
Different mix of subjects/number No change
Don't know
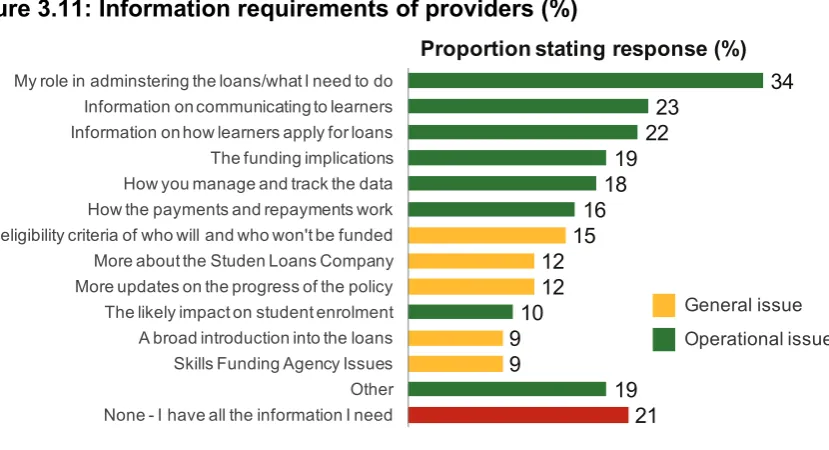
The emphasis on how 24+ Loans affect operations was also highlighted in unprompted responses to the question what elements of the loans system do you need to know most about at this point in time? (Figure 3.11). A third of providers said they wanted to know more about their role in
administering the loans (34%) and under a quarter wanted information on communicating to learners (23%) and information on how learners apply for loans (22%).
Figure 3.11: Information requirements of providers (%)
34 23
22 19 18 16 15 12 12 10 9 9
19 21
My role in adminstering the loans/what I need to do Information on communicating to learners Information on how learners apply for loans The funding implications How you manage and track the data How the payments and repayments work The eligibility criteria of who will and who won't be funded More about the Studen Loans Company More updates on the progress of the policy The likely impact on student enrolment A broad introduction into the loans Skills Funding Agency Issues Other None - I have all the information I need
Proportion stating response (%)
Base: All providers at W2: (266)
Operational issue General issue
4. Apprentice employers
4.1. Summary
The main finding is employers were not familiar with the 24+ Loans, either at the broadest level or in its detail, and many do not feel prepared for the policy’s implementation. And this picture has not changed a great deal between the two research waves. Two employers in five had not heard of the 24+ Loans in either wave, just one in eight knew at least a fair amount about them. A quarter of employers felt at least fairly prepared. And knowledge of the eligibility criteria of the loans was also patchy: while many knew that there is a minimum age and that the level of the training is part of the criteria, there were also common misconceptions, such as thinking there is a maximum age and that previous qualifications and salary are part of the criteria too. This level of “false” awareness suggests that the reported level of awareness of genuine eligibility criteria should be treated with caution.
Smaller organisations were less likely to be familiar and prepared for 24+ Loans compared to larger organisations. This distinction was more acute by the time of the second wave, suggesting marketing towards larger organisations had been more successful between waves, or else they were taking more initiative to learn about the policy. This is a reasonable conclusion given the relationship between size of organisation and the number of apprentices employed.
The thrust of the 24+ Loans policy is to ensure the person mainly benefiting from training pays and the onus to promote the new system is on the provider. But the survey suggests that 24+ Loans will come as a surprise to many employers. Many employers will likely not be communicating with their employees on the policy, nor will they yet be making arrangements to assist in paying their employees’ loan repayments.
Very few employers said they currently fund their employees’ course fees, and even though employers were generally positive about their training many – around two employers in three – said that they offered training because it is currently partly funded by government. This response was especially common among smaller organisations. Employers who were sceptical about the new loans (based on their responses to a range of attitude statements) also had concerns about the financing of loans and how the repayment system worked.
demand for, Apprenticeships. The majority of employers disagreed that recruiting staff would become easier as a result of the loans.
Knowledge of the terms and conditions of 24+ Loans was also variable. There were many misconceptions, some of which related to wider negative views and expectations of the new 24+ Loans. This included a belief that banks will be involved in processing accounts and that
subsequent HE loan repayments will not be rolled into one repayment with the FE loan repayments. More familiarity with the policy and its detail may alleviate some of employers’
concerns although it is more likely that direct experiences during the implementation of 24+ Loans will have a stronger effect on perceptions.
Employers did react positively towards some elements of the policy. They tended to be positive, and sometimes very positive, about the impact training has on their business. Further, many employers agreed with certain aspects of the new loans’ principles, particularly that apprentices should make a financial contribution to their own learning, and that the loans will help
disadvantaged people who want to train. And while the changes in awareness and preparedness
between the two research waves did not move much, there were conspicuous changes in knowledge on the details of eligibility criteria and the terms and conditions relating to 24+ Loans.
This suggests that there are some positive building blocks to work with in terms of improving employers’ awareness, preparedness and expectations of the implementation of 24+ Loans.
4.2. Introduction
This research was conducted among Apprentice employers (referred to as employers in this report) who offered a Level 3 or Level 4 training course, including Advanced and Higher
Apprenticeships, to their employees in the 2012/13 academic year. As with providers, two waves of research were carried out; the latest took place between 7th May and 4th June 2013 (Wave 2, referred to as W2). The first wave (referred to as W1) was conducted between 3rd December 2012 and 18th January 2013. In comparison with the timescale of the 24+ Loans policy, learners starting on eligible courses on or after 1st August 2013 can apply for a 24+ Loan13, which means that employers were responding around 9 months before implementation at W1, and much closer to implementation, at around 3 months before implementation, at W2.
One of the important aspects of 24+ Loans to consider when reading this chapter is that employers can make voluntary payments of part or all of a 24+ Loan repayments on behalf of their
employees.
It is therefore interesting to note that knowledge of the 24+ Loans among Apprentice employers was low, with relatively few (12% of employers in W2) knowing at least a fair amount about them14, only just over a quarter feeling at least fairly prepared, and few employers have sought information about the loans. These findings did not change between waves.
The main sub-group differences in knowledge and awareness were found by business size as employers with fewer employees (and apprentices15) tended to be less aware. There was also less of an improvement in these measures among smaller organisations between the two waves.
For the purposes of making more robust sub-group comparisons, we have combined data between waves where no significant differences between waves were found. We indicate in the text where it is combined data that we are quoting. If it is not otherwise mentioned it is W2 data that is being cited.
4.3. Awareness and understanding
Overall awareness
Overall awareness of 24+ Loans was fairly low among employers. One in eight (12%) at W2 said they knew at least a fair amount about the policy, a further quarter (27%) knew a little, while close to two in three (62%) knew nothing about it (including 40% who had never heard of it).
There was barely any change between this and the picture at W1 conducted six months earlier. Then 13% knew at least a fair amount, and 60% knew nothing. Changes between W1 and W2 are shown in Figure 4.1.
14 As earlier, the shorthand convention of “at least” is used in relation to aggregated findings
15 Where we say “smaller organisations” in terms of employees we define it in this report as those with fewer
Figure 4.1: Awareness of 24+ Loans (%)
Base: All Apprenticeship employers: W1 (376); W2 (402) 1
11
27
23
36
1 2
10
24
23
40
1
Know a lot
Know a fair amount
Know just a little
Have heard of them but know nothing about these loans
Have never heard of these loans before today
Don't know
Wave 1 Wave 2
As might be expected, awareness was related to the extent that employers had all the information required and how prepared they felt for the loans – although it remained the case that many of those prepared for the loans and with sufficient information did not feel they had strong knowledge of them.
When looking at the combined data from both waves, fewer than three in ten (27%) of those prepared for the loans know at least a fair amount about them, and 22% of those who said they had all information they need knew this amount. Private sector employers were also more likely to know at least a fair amount about the loans, 14% of whom did compared with eight percent of public/voluntary sector employers (though this difference is not statistically significant). There are also differences within these sector groups, with charities (five percent) and those in the
manufacturing/construction sectors (four percent) particularly unlikely to know a fair amount about the loans compared with those in the ‘private sector – other services’ group16 (16%).
In each wave, smaller organisations were more likely to have never heard of the loans: 42% of those with fewer than 50 employees said this, as did those with fewer than five apprentices (compared with 29% and 31% respectively for larger organisations).
16 These are private sector organisations not in the retail nor the manufacturing/construction sector. It is
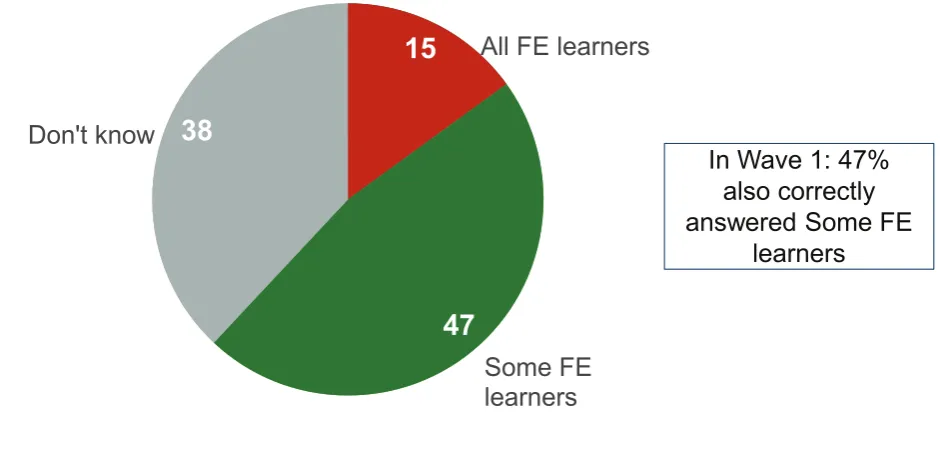
Knowledge of eligibility criteria
[image:41.595.68.540.255.483.2]Just under half of employers17 knew that the loans affect only some, and not all, learners. At W2 47% said this, as did the same amount in W1. Nevertheless, in both waves many said that they did not know either way (38% at W2 and 42% at W1, not a statistically significant change), while a significant minority believed that the loans affected all learners (15% at W2, 10% at W1, actually a significant increase).
Figure 4.2: Awareness of whether 24+ Loans applies to all or some learners (%)
Base: All who have at least heard of the loans: W2 (250)
15
47
38
All FE learners
Some FE
learners
Don't know
In Wave 1: 47%
also correctly
answered Some FE
learners
Based on the data from both waves, 69% of those who knew at least a fair amount about the loans overall also knew that only some learners were eligible. Two thirds of those who felt at least fairly prepared (66%) said the same.
At W2, around a quarter of employers who have five or more apprentices, as well as for whom all of their learners are aged 24 or over, were more likely to erroneously believe that the 24+ Loans apply to all learners.
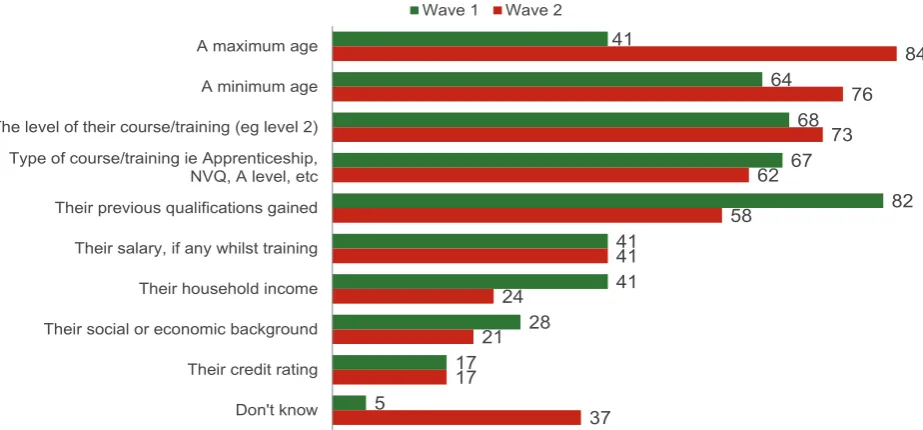
Employers who said that only some learners were affected by the policy were asked questions about who was eligible. Three in four (76%) of these employers at W2 knew that there is a
minimum age requirement, while a similar proportion (73%) knew that the level of their course or training was part of the criteria. In both cases, employers who said they were at least fairly
prepared for the loans more likely to recognise these criteria (91% of whom knew there is a minimum age and 88% that the level is part of the criteria), as were employers with five or more apprentices on the former point (91% of whom knew there is a minimum age).
Figure 4.3: Awareness of 24+ Loans’ eligibility criteria (%)
Base: All who know only some learners will be affected: W1 (115); W2 (126)
41
64
68
67
82
41
41
28
17
5
84
76
73
62
58
41
24
21
17
37
A maximum age
A minimum age
The level of their course/training (eg level 2) Type of course/training ie Apprenticeship, NVQ, A level, etc Their previous qualifications gained
Their salary, if any whilst training
Their household income
Their social or economic background
Their credit rating
Don't know
Wave 1 Wave 2
However, the criterion most employers associated with Loans is not part of the policy. Eighty-four percent thought a maximum age applied; and those with fewer than five apprentices were
especially likely to believe this. Other common misconceptions regarding eligibility were that the
type of course (62%), previous qualifications (58%) and their salarywhile training (41%) affected eligibility. Such misconceptions were fairly evenly-distributed among employers, even among those more aware and prepared regarding the loans.
Knowledge about eligibility criteria improved between waves. More employers at W2 said that a
minimum age applied (up from 64% to 76%) and fewer selected incorrect eligibility criteria such as
previous qualifications (down from 82% to 58%) and household income (from 41% to 24%). However, believing a maximum age applies rose over this time (from 40% to 84%).
Employers also tended