Evidence Report 88
November 2014
Employer Perspectives
Survey 2014:
Header title here…
Employer Perspectives Survey
2014: Technical Report
Jan Shury, David Vivian, Katie Spreadbury, Andrew Skone James and Mark
Tweddle
IFF Research
Rebecca Jones and Dr. Susannah Constable
UK Commission for Employment and Skills
Table of Contents
1
Introduction ... 3
1.1 The UK Commission’s Employer Perspectives Survey 2014 ... 3
1.2 Purpose and structure of this report ... 3
1.3 Accessing the data ... 4
2
Sample Design ... 5
2.1 Sampling population and survey sampling unit ... 5
2.2 Sampling approach and setting quotas ... 5
2.2.1 Quotas by geography ... 6
2.2.2 Quotas by size band ... 6
2.2.3 Quotas by sector... 7
2.3 Sample Sources ... 8
3
Questionnaire Design... 10
3.1 Introduction ... 10
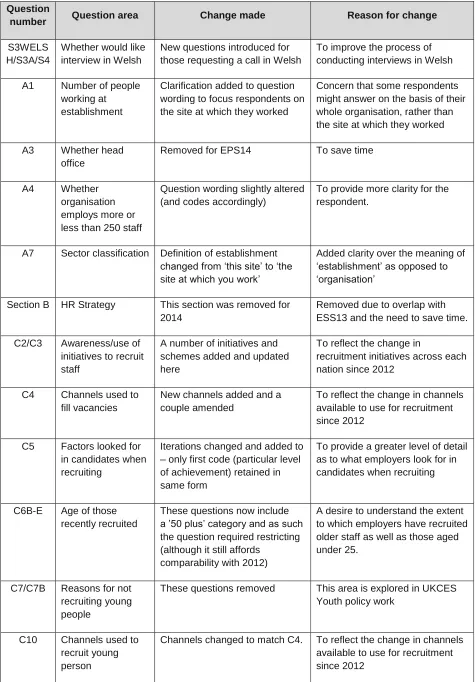
3.2 Changes from the 2012 survey ... 10
3.3 Interview length ... 11
3.4 Piloting and cognitive testing ... 11
4
Fieldwork ... 13
4.1 Methodology ... 13
4.2 Response rates ... 15
5
Coding ... 16
5.1 Methodology ... 16
5.2 Sector Classifications ... 16
6
Weighting ... 17
6.1 Data Source and Methodology ... 17
7
Sampling Error and Statistical Significance ... 18
7.1 Statistical accuracy of survey results ... 18
Appendix A
Final Survey Questionnaire ...
..
21
Appendix B
Questionnaire changes for 2014 ... 63
Appendix C
Coding ... 69
Appendix D
Quota targets, Drawn Sample and Achieved
Interviews
...
....
77
Appendix F
Reassurance email to respondents ... 81
Table of Graphs and Charts
Table 2.1Quota targets by country and statistical reliability compared with 2012………….6
Table 2.2 Comparing sector sample distributions 2012 and 2014……….………..8
Table 4.1 Interviews achieved by country .... 13
Table 4.2 Sample outcomes and response rate ..... 15
Table 7.1 Sampling error (at a 95 per cent confidence level) associated with findings of 50 per cent, by country and size band ... 18
Table 7.2 Sampling error (at a 95 per cent confidence level) associated with findings of 50 per cent, by sector... 19
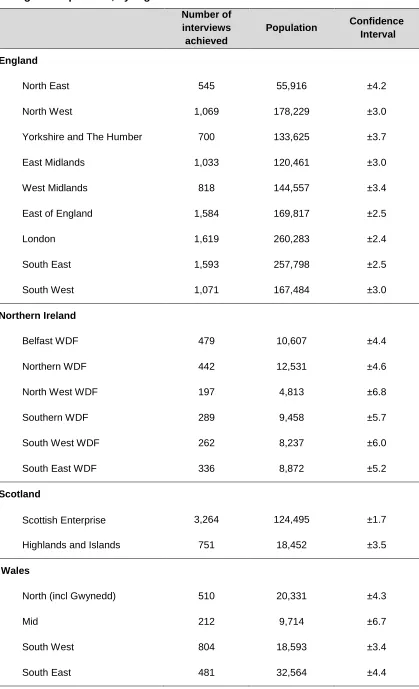
Table 7.3 Sampling error (at a 95 per cent confidence level) associated with findings of 50 per cent, by region ... 20
Table B.1 Questionnaire changes 2014………...63
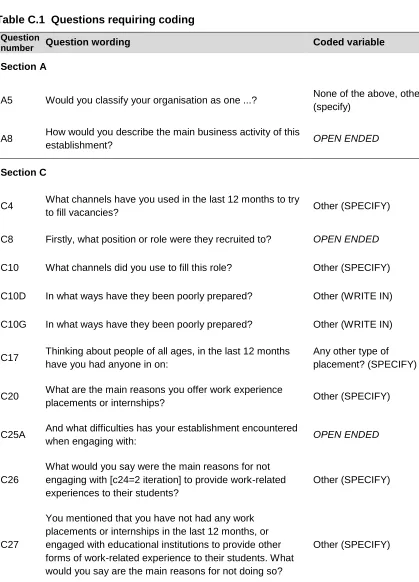
Table C.1 Questions requiring coding ... 69
Table C.2 Industry coding (broad sector) ... 72
Table C.3 Industry coding (detailed sector) ... 75
1
Introduction
1.1
The UK Commission’s Employer Perspectives Survey 2014
This report provides detail on the key aspects of the survey methodology used for the UK
Commission’s Employer Perspectives Survey 2014 (EPS) (Shury
et al.
, 2014), available
on
gov.uk
. This is a large scale survey involving over 18,000 UK employers and is part of
a series of studies commissioned by the UK Commission for Employment and Skills to
provide robust and reliable labour market information.
EPS 2014 gives an insight into the thoughts and behaviour of employers across the UK
as they make decisions about how to engage with training providers, schools, colleges
and individuals in the wider skills system, to get the skills they need. EPS sits alongside
the UK Commission’s Employer Skills Survey, which focuses on employer skills demand,
skills shortages and training within organisations. The two surveys run in alternate years.
This is the third iteration of EPS, which was also carried out in 2010 and 2012. EPS is
the successor to the Sector Skills Development Agency (SSDA)’s Employer Survey,
carried out in 2002, 2005 and 2008. For more information on the scope of, background to
or findings from EPS 2014 or some of its predecessor surveys, see the main report (p.
1-2).
The design and execution of the research was overseen by a project Steering Group
convened by the UK Commission, including officials representing the Department for
Business, Innovation and Skills (BIS) in England, the Welsh Government, the Scottish
Government, and the Department for Employment and Learning in Northern Ireland
(DELNI).
1.2
Purpose and structure of this report
This technical report provides background information on the methodology and
techniques used in carrying out EPS 2014. It is divided into six chapters, each
considering a different area of survey design and methodology in detail:
Sample Design
; exploring the method by which specific employers were selected
to take part in the research, and the reasoning behind the number and distribution
of employers interviewed;
Questionnaire Design
; exploring the considerations taken into account in survey
design, comparability with previous surveys, and the methods by which the survey
Fieldwork
; giving a detailed overview of how the interviews were carried out,
quality control procedures, and the level of response achieved;
Coding
; showing how text responses to survey questions were classified for
analysis;
Weighting
; exploring how the survey responses were processed to ensure that
the resulting dataset was representative of all types of employer, avoiding
under-representation of those groups less likely to respond to the survey; and
Sampling Error and Statistical Significance
; considering the reliability and error
margins of figures produced from the dataset in statistical terms.
1.3
Accessing the data
Much
of
the
data
discussed
in
this
report
can
be
downloaded
from
www.gov.uk/government/employer-perspectives-survey in table format. If you cannot find
the data you need or have further questions relating to any of
the UK Commission’s
2
Sample Design
2.1
Sampling population and survey sampling unit
The EPS 2014 sampling population encompasses establishments across the full
geographical spread of the UK, in all sectors of the economy (across the commercial,
public and charitable spheres). The 2014 Inter-Departmental Business Register (IDBR)
was used as the main sampling frame for the survey. All UK establishments with two or
more people working at them were eligible for the survey as they were deemed to have
employees at their site.
Establishments were used as the sampling unit for the survey, as opposed to an
organisation-based approach.
“Establishments” denote specific
individual sites or
premises
; thus if an organisation has several sites it is possible that more than one of
these sites will have appeared in the sample. This approach has been chosen because it
is at the establishment level where respondents are most likely to be able to provide a
detailed and accurate picture of how employers go about meeting their skills needs.
Interviews were sought with the most senior person at the site with responsibility for
human resource and personnel issues. In smaller establishments this would typically be
the owner or managing director; in larger establishments this was often the Human
Resources Manager or Personnel Manager.
2.2
Sampling approach and setting quotas
Using business population figures from the IDBR, the sample was stratified by nation,
establishment size and industrial sector in order to ensure robust coverage of the full
range of business types in all parts of the UK.
The sampling approach broadly mirrored the sampling strategy used in 2012 and
calculated size and sector quotas on an interlocking basis, separately within each
country. However, there were two key departures from the approach taken in 2012 in
terms of setting quotas by nation and sector, namely:
Boosting the number of interviews in the devolved administrations from the outset;
Returning to 14 Standard Industrial Classification (SIC) sector categories.
The following sections identify how quotas were set by country, size and sector and how
2.2.1 Quotas by geography
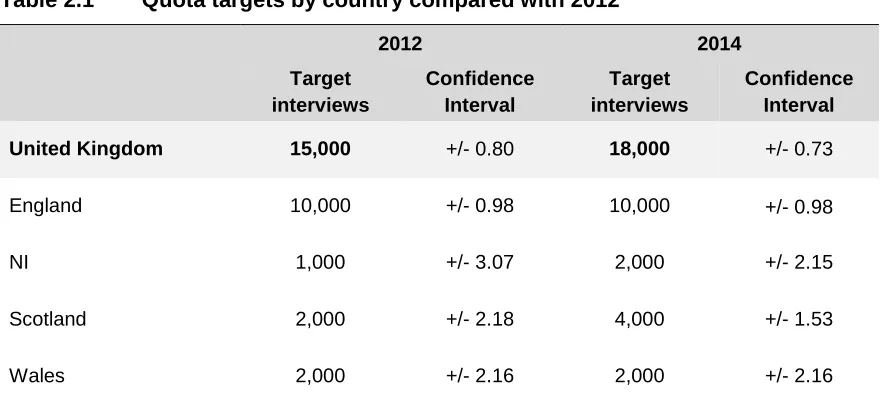
A sample size of 18,000 interviews was set which consisted of a minimum of: 10,000
interviews to be achieved in England; 4,000 in Scotland; 2,000 in Wales; and 2,000 in
Northern Ireland. This marked an increase of 3,000 interviews from the 2012 study, in
order to enhance survey analysis by nation. Table 2.1 presents the target number of
[image:9.595.80.521.189.391.2]interviews by country in 2012 and 2014.
Table 2.1
Quota targets by country compared with 2012
2012 2014
Target interviews
Confidence Interval
Target interviews
Confidence Interval
United Kingdom 15,000 +/- 0.80 18,000 +/- 0.73
England 10,000 +/- 0.98 10,000 +/- 0.98
NI 1,000 +/- 3.07 2,000 +/- 2.15
Scotland 2,000 +/- 2.18 4,000 +/- 1.53
Wales 2,000 +/- 2.16 2,000 +/- 2.16
Interview numbers were boosted to ensure that the Northern Ireland sample delivered
findings with a similar statistical confidence / accuracy as achieved in Wales in 2012 and
to increase the ability of the Scottish sample to deliver disaggregated findings.
The approaches taken to sampling within nation – as outlined in the following sections –
meant that these boosts to the national quotas had negligible impact on the accuracy of
the overall UK findings.
2.2.2 Quotas by size band
A target number of interviews was set for each size band within country. To allocate
these in proportion to the true population of establishments would have produced a
sample dominated by small companies, with only a very small proportion of large
companies. The targets for each size band were therefore set purposively to balance the
drive to maximise yield of interviews among larger establishments while minimising any
skew within the sample. This is an approach consistently taken in the EPS series and
ensures the findings are representative of the relative importance of large establishments
The size bands at which employers were sampled retained consistency with the 2012
approach, with the following bandings used:
2 to 4;
5 to 9;
10 to 24;
25 to 99; and
100+.
2.2.3 Quotas by sector
Within each size band, interviews were allocated to sectors in direct proportion to the
population of establishments in each sector for that size band.
For the 2012 survey a six SIC sector classification of employers by industry was used,
replacing the 14 sector classification used in the previous survey. However, this resulted
in some difficulties in the dissemination of the findings as some recipients were not
familiar with the six sector classification.
For 2014 there has been a return to a 14 SIC sector classification for sampling purposes
(see Table 2.2), as this still ensures flexibility to move between any one of a six, 12 or 14
sector classification in reporting (satisfying both the need for time series and the drive for
more detail / more familiar sector classifications)
1. For more information on Standard
Industrial Classification codes and sector definitions used for this survey, please see
Tables C.2 and C.3 in Appendix C.
Table 2.2:
Comparing sector sample distributions
2012 Sectors
2014 Sectors
Primary and Utilities
Agriculture, hunting,
forestry and fishing
Mining and quarrying
Electricity, gas and water
supply
Manufacturing
Manufacturing
Construction
Construction
Trade, Accommodation
and Transport
Wholesale and retail trade
Hotels and restaurants
Transport, storage and
communications
Business and Other
Services
Finance services
Real estate, renting and
business activities
Community, social and
personal service activities
Non-Market Services
Public administration and
defence; compulsory social
security
Education
Health and social work
2.3
Sample Sources
Sample was primarily drawn from the Experian database which is regarded as the most
comprehensive and up-to-date source of establishment-based data with telephone
contact details that is commercially available.
In some sectors, supplementary sample was ordered direct from IDBR and telephone
numbers sourced via UKChanges, a secure telematching service. This was used in
sectors where the coverage of the Experian database was not as complete as for others,
and for those which have few establishments in them overall, to maximise coverage in
these areas. The broad sector areas affected by this were the Non-Market Services, the
Additionally, for certain banks, head offices were contacted prior to the survey
commencing in order to obtain telephone numbers at branch level for establishments
included in the sample drawn from the Experian database. This approach was taken as
the original telephone numbers supplied in the Experian sample directed interviewers to
call centres from where, from past experience, it has proved challenging to reach
individual branches. A copy of this letter can be seen in Appendix E.
Sample was ordered on an average ratio of 8:1 against interviews required in each
interlocking cell. Due to the availability of sample this varied between quota cells from 5:1
(Public Administration in Northern Ireland) to 12:1 (Electricity in England). The ratio was
chosen to maximise response in the length of fieldwork period allocated to the survey;
any smaller ratio would have required a longer fieldwork period to achieve the necessary
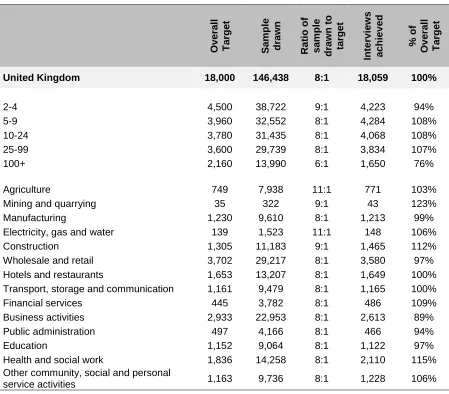
response. Table D.1 in Appendix D presents the ratio of sample drawn for each key quota
3
Questionnaire Design
3.1
Introduction
The questionnaire was designed by IFF Research in conjunction with UKCES and the
project Steering Group. The 2014 survey covered the following broad areas:
Recruitment, focusing particularly on young people and education leavers;
Work experience and internships;
Staff development, including sources of information and advice;
Training activity and sources of training;
Vocational Qualifications;
Apprenticeships;
National Occupational Standards;
Investors in People; and
Collaborating with other employers.
3.2
Changes from the 2012 survey
Although the 2014 questionnaire was designed to ensure comparability and build a time
series with previous EPS surveys (and to complement the 2013 ESS questionnaire), a
number of changes were made to reflect the changing skills and employment policy
context.
Consultation was undertaken both within the UK Commission and with the project
Steering Group to inform the questionnaire redesign. All of the questions from the
previous survey were reviewed and deleted/modified as appropriate, and some new
Significant additions were made to the questionnaire, across a number of areas,
including:
A new section on the recruitment of Education Leavers (taken from the equivalent
section in ESS 2013);
Additional detail on specific work placements and internships;
A small section on awareness and use of Traineeships in England;
A new section on employers’ interactions with educational institutions to provide
wider work-related experiences to their students;
Additional detail on obtaining information and advice on skills and training related
issues externally; and
A new section on working with other employers on their training and skills
development practices.
Details on these, as well as further deletions, modifications and additions from the 2012
survey are documented in Table B.1, Appendix B.
3.3
Interview length
The average overall interview length was 24.5 minutes. Interviews with employers varied
in length from 15 minutes to just over 40 minutes, depending on their engagement with
initiatives, services and activities.
As might be expected, interviews with larger establishments took longer on average given
that they are more likely to have engaged with the skills system and to have used more
services / initiatives.
3.4
Piloting and cognitive testing
Prior to the mainstage fieldwork a pilot exercise was undertaken in order to test and
refine the structure, to ensure any new questions used were well understood by
respondents, and to ensure that the survey was of a suitable length. Alongside this pilot
phase, cognitive interviews were also conducted to further inform the development of the
questionnaire.
The questionnaire was piloted between 17
thMarch and 19
thMarch 2014, comprising 50
interviews with establishments from across the UK, covering a range of size bands and
Cognitive interviews were also conducted with 10 employers, focussing on parts of the
questionnaire identified as potentially difficult for respondents to understand, and where
the process of revising the questionnaire would be helped by additional information which
could not be gathered during the pilot interviews. An example of this included employers’
understanding of new terms such as, ‘employer networks’.
The key areas considered for pilot and cognitive testing were:
The placement of the recruitment of Education Leavers section within the survey;
Work experience placements, internships and Traineeships (C17-C19C);
Engagement with educational institutions to provide wider work-related
experiences to their students (C23);
External training and financing (D9A-D10);
National Occupational Standards (D20-D21);
Different levels of Apprenticeships (D29); and
Working with other employers (D36-D39).
The results of both the pilot and cognitive interviews were used to inform further
development of the questionnaire, in consultation between IFF Research and the UK
Commission. Developments included:
The removal of C15 (‘umbrella’ work placement question), D10F (the
responsibility of funding for training) and E6 and E7 (awareness of UKCES);
Amends to C17 (types of work placements) and D36-D39 (working with other
employers); and
Re-ordering of various sections, for example the re-positioning of the Recruitment
of Education Leaver questions in Section C.
A secondary cognitive phase followed with five employers interviewed in the pilot, testing
questions that were developed following the pilot stage of fieldwork. These concentrated
on additional questions in the wider work experience section (C24-C26), employers’
approach to training plans (this area of questioning was subsequently removed from the
questionnaire) and the hours individuals spend away from their job role while on an
Revisions to the questionnaire were aimed at ensuring that questions posed were
effective and that the questionnaire would be of an appropriate length, reduced from 25.5
minutes to 24.5 minutes. The final questionnaire is presented in Appendix A.
4
Fieldwork
4.1
Methodology
Following the pilot exercise and finalisation of the questionnaire, a total of 18,059
interviews were conducted by telephone using computer aided telephone interviewing
(CATI) technology. Fieldwork took place between April and July 2014. Table 4.1 shows
the number of interviews achieved by country.
Table 4.1 Interviews achieved by country
Number of interviews achieved
Overall
UK 18,059
By country
England 10,032
Northern Ireland 2,005
Scotland 4,015
Wales 2,007
Introductory letters were sent in advance to the head offices of a select number of
employers in the financial services, to maximise response rates among these sites. This
letter contained information about the survey and the reasons behind contacting head
offices. An example of this letter is shown in Appendix E.
All interviewers were provided with a detailed briefing on the questionnaire design, the
aims of the research, and background of the project and the organisations involved.
These briefings paid particular attention to the screener section of the questionnaire to
ensure the correct respondent was reached. They also focussed on suitable prompts to
use for the industry SIC questions (A7 and A8) and explored the necessary level of detail
required. UKCES staff attended two briefings at the start of fieldwork.
The survey process was monitored throughout to ensure a high quality of interviewing,
whereby all interviewers were monitored by IFF’s Quality Control team at least once, and
Interviews were conducted with the most senior person at the site with responsibility for
human resource and personnel issues. Respondents were reassured of the
confidentiality of their data when they agreed to take part in the interview. If after the first
contact more information about the survey was required, a reassurance email was sent;
this can be seen in Appendix F.
Regular adjustments were made to the balance of establishments contacted to ensure an
even distribution of interviews with employers from different nations, sectors and size
bands throughout the fieldwork period. Sample was released for fieldwork in proportion to
quota targets so that quota progression was as even as possible, and to ensure
employers were called and re-called at suitable points without being over-contacted.
As is usual with surveys of this kind, there were certain types of employers with whom it
proved more difficult to achieve interviews. Various methods were employed to help
improve response rates among these employers. For example, calls were often made to
Construction and Agriculture establishments outside of normal business hours (before
9am and after 5pm) as their work is typically site/outdoor based rather than carried out
near a telephone.
As the survey neared the end of the fieldwork period it became clear that it would not be
possible to fill some of the quotas with the remaining available sample. This was
particularly evident among large establishments (with 100 or more staff) where the
available sample was fairly limited relative to establishments of smaller size bands.
Appendix D shows the drawn sample ratios; where these are lower than 8:1 this is
because the required volume of sample was simply not available from the sources used.
It was generally in these areas where it was harder to reach the original quota targets.
During fieldwork, when it became evident that a target quota within a particular cell was
unachievable, targets were increased in neighbouring cells to compensate. As an initial
step, this entailed increasing the target within the same SIC sector (and country) in an
adjacent size band. If this then became unachievable, any remaining achievable size
bands within the SIC sector were used to try to reach the overall sector target in that
country. Towards the end of fieldwork, quota targets were also opened up within the
largest size band (100 plus employees) irrespective of sector or country in order to
maximise interviews in this group.
For respondents in Wales, the survey was made available in both English and Welsh. In
4.2
Response rates
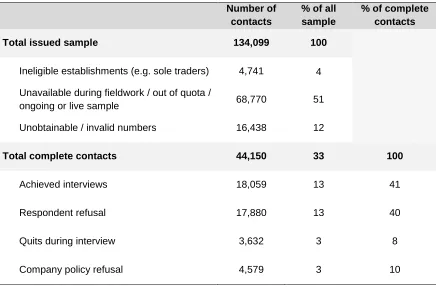
The survey achieved an overall response rate of 41 per cent, retaining broad consistency
with the 42 per cent achieved in 2012. Table 4.2 breaks down the sample outcomes and
response rate for 2014. The response rate was calculated using the number of achieved
interviews as a proportion of ‘total complete contacts’, where a final outcome was
reached with the establishment (this includes those respondents who completed the
[image:18.595.82.518.218.505.2]interview, refused to take part or quit during the interview).
Table 4.2 Sample outcomes and response rate
Number of contacts
% of all sample
% of complete contacts
Total issued sample 134,099 100
Ineligible establishments (e.g. sole traders) 4,741 4
Unavailable during fieldwork / out of quota /
ongoing or live sample 68,770 51
Unobtainable / invalid numbers 16,438 12
Total complete contacts 44,150 33 100
Achieved interviews 18,059 13 41
Respondent refusal 17,880 13 40
Quits during interview 3,632 3 8
5
Coding
5.1
Methodology
Open ended responses to the survey were
coded by IFF Research’s internal coding
team. To ensure consistency, a formal code frame was developed and regularly reviewed
during development by the research team. In addition, the application of the code frame
in practice was monitored through quality control checks to ensure a high level of
accuracy of codes assigned to verbatim responses. Table C.1 in Appendix C details the
questions which required coding.
5.2
Sector Classifications
Each establishment was allocated to one of 12 sectors, based on their Standard
Industrial Classification (SIC). SIC 2007 was used to classify respondents. A description
of business activity was read out to each respondent. If they agreed that this description
matched the main activity, then the SIC on Experian’s database was assumed to be
correct. If, however respondents did not agree with the classification of their
establishment, a verbatim response was collected at A7 and A8. This data was then
coded to 4-digit Standard Industrial Classification (SIC) 2007, and subsequently grouped
into the sector categories used for analysis and reporting. In total, nearly a quarter of
respondents (24 per cent) disagreed with the initial classification of their establishment.
A detailed outline of the sector classifications used is provided in Tables C.2 and C.3 in
6
Weighting
6.1
Data Source and Methodology
The survey data was weighted and grossed up to population figures of 1.77 million
establishments (with two or more employees). All population estimates used were derived
from the latest available (March 2014) Inter-Departmental Business Register (IDBR).
The first stage of weighting was based upon nation, size and sector. The size bands used
in the weighting process were slightly more granular than those used in sampling.
Additional sub-groups were added to the 25-99 band (25-49 and 50-99) and the 100+
band was also collapsed between 100-249 and 250+. Meanwhile employers in
Agriculture, Mining and Electricity were combined into one sector grouping (Primary
Sector and Utilities) due to the relatively low number of completed interviews among
Mining and Electricity employers. Within each country, weights were applied on a
separate, interlocking seven size band and 12 SIC sector grid based on IDBR population
counts.
The second stage involved rim weights being applied to the data to ensure that it
represented the employer population by region (GOR in England, WDF in Northern
Ireland; Scottish Enterprise / Highlands and Islands in Scotland; Broad region in Wales).
Rim weights were used to ensure the survey population of each region matched the true
7
Sampling Error and Statistical Significance
7.1
Statistical accuracy of survey results
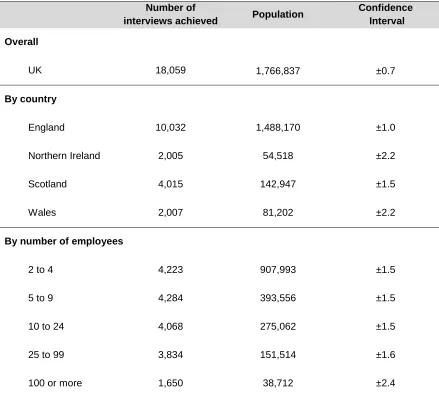
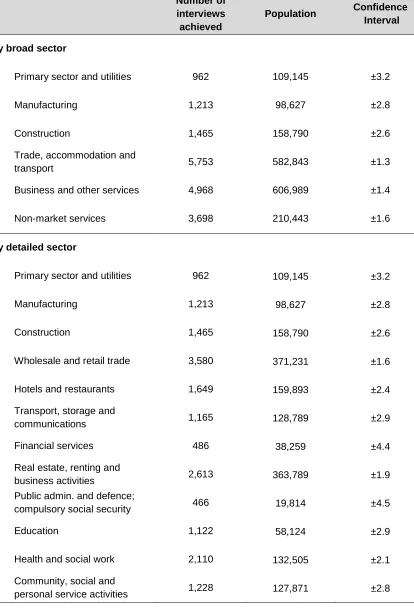
Sampling error for the survey results overall and for key sub-groups by which analysis is
presented in the report is shown in Table 7.1 and Table 7.2. Table 7.3 also shows
sampling error by region. Confidence intervals have been calculated based on a survey
result of 50 per cent, at the 95 per cent confidence level. Where the table indicates that a
survey result based on all respondents has a sampling error of +/- 0.8 per cent, this
should be interpreted as follows: ‘for a question asked of all respondents in this group
where the survey result is 50 per cent, we are 95 per cent confident that the true figure
lies within the range 49.2 per cent to 50.8 per cent’.
As a note, the calculation of sampling error has taken into account the finite population
correction factor to account for cases where we are measuring a significant portion of the
population universe (i.e. even if two sample sizes are the same, the sampling error will be
[image:21.595.80.519.398.791.2]lower if in one case a far higher proportion of the population was covered).
Table 7.1 Sampling error (at a 95 per cent confidence level) associated with
findings of 50 per cent, by country and size band
Number of
interviews achieved Population
Confidence Interval
Overall
UK 18,059 1,766,837 ±0.7
By country
England 10,032 1,488,170 ±1.0
Northern Ireland 2,005 54,518 ±2.2
Scotland 4,015 142,947 ±1.5
Wales 2,007 81,202 ±2.2
By number of employees
2 to 4 4,223 907,993 ±1.5
5 to 9 4,284 393,556 ±1.5
10 to 24 4,068 275,062 ±1.5
25 to 99 3,834 151,514 ±1.6
Table 7.2 Sampling error (at a 95 per cent confidence level) associated with
findings of 50 per cent, by sector
Number of interviews achieved
Population Confidence
Interval
By broad sector
Primary sector and utilities 962 109,145 ±3.2
Manufacturing 1,213 98,627 ±2.8
Construction 1,465 158,790 ±2.6
Trade, accommodation and
transport 5,753 582,843 ±1.3
Business and other services 4,968 606,989 ±1.4
Non-market services 3,698 210,443 ±1.6
By detailed sector
Primary sector and utilities 962 109,145 ±3.2
Manufacturing 1,213 98,627 ±2.8
Construction 1,465 158,790 ±2.6
Wholesale and retail trade 3,580 371,231 ±1.6
Hotels and restaurants 1,649 159,893 ±2.4
Transport, storage and
communications 1,165 128,789 ±2.9
Financial services 486 38,259 ±4.4
Real estate, renting and
business activities 2,613 363,789 ±1.9
Public admin. and defence;
compulsory social security 466 19,814 ±4.5
Education 1,122 58,124 ±2.9
Health and social work 2,110 132,505 ±2.1
Community, social and
Table 7.3 Sampling error (at a 95 per cent confidence level) associated with
findings of 50 per cent, by region
Number of interviews achieved
Population Confidence
Interval
England
North East 545 55,916 ±4.2
North West 1,069 178,229 ±3.0
Yorkshire and The Humber 700 133,625 ±3.7
East Midlands 1,033 120,461 ±3.0
West Midlands 818 144,557 ±3.4
East of England 1,584 169,817 ±2.5
London 1,619 260,283 ±2.4
South East 1,593 257,798 ±2.5
South West 1,071 167,484 ±3.0
Northern Ireland
Belfast WDF 479 10,607 ±4.4
Northern WDF 442 12,531 ±4.6
North West WDF 197 4,813 ±6.8
Southern WDF 289 9,458 ±5.7
South West WDF 262 8,237 ±6.0
South East WDF 336 8,872 ±5.2
Scotland
Scottish Enterprise 3,264 124,495 ±1.7
Highlands and Islands 751 18,452 ±3.5
Wales
North (incl Gwynedd) 510 20,331 ±4.3
Mid 212 9,714 ±6.7
South West 804 18,593 ±3.4
Appendix A Final Survey Questionnaire
Screener
ASK TELEPHONIST
S1 Good morning / afternoon. My name is NAME and I'm calling from IFF Research. Can I
just check, is this [COMPANY NAME FROM SAMPLE]?
Yes – correct 1 CONTINUE
No – company name wrong 2
TAKE CORRECT COMPANY NAME AND CONTINUE
Hard appointment 3
MAKE APPOINTMENT
Soft appointment 4
Refusal 5
CLOSE Refusal – company policy 6
Refusal – taken part in recent survey 7
Residential Number 8
ASK ALL
S2 IF SAMPLE NOT NAMED: Please can I speak to the person at this site who has most responsibility for staff issues such as training, recruitment or resourcing?
IF SAMPLE NAMED: Please may I speak to [NAME FROM SAMPLE]?
ALL:
IF NECESSARY: We need to speak to someone at this site rather than someone at another branch or office of your organisation. Could I speak to the person at this site who would have the best overview of human resource and personnel issues?
Yes – speaking 1 CONTINUE
Yes – transferred 2 CONTINUE
Hard appointment 3
MAKE APPOINTMENT
Soft appointment 4
Requested reassurance email (insert email address)
DP: SEND AUTOMATIC EMAIL 13
Refusal 5
CLOSE Refusal – company policy 6
Refusal – taken part in recent survey 7
Not available during fieldwork period 8
Nobody at site able to answer the questions 9
Sole trader / alone at site 10
Residential number 11
ASK ALL
S3 IF TRANSFERRED (S2=2): Good morning / afternoon, my name is NAME, calling from IFF Research, an independent market research company.
ALL: We’re conducting a survey on behalf of the UK Commission for Employment and
Skills and its partners such as [ENGLAND: the Department for Business, Innovation and Skills (BIS) WALES: the Welsh Government SCOTLAND: the Scottish Government NI: the Department for Employment and Learning in Northern Ireland (DELNI)].
The survey aims to help Government and other organisations to help employers like you, by better understanding your needs in terms of skills, training and employment. Your co-operation will ensure that the views expressed are representative of all employers in your industry.
[IF EIF/GIF SAMPLE:
ADD IF NECESSARY: You may have recently been contacted regarding a different government-sponsored survey on workforce development. The Employer Perspectives Survey is a UK-wide study of recruitment and people development activity that helps inform government policy on a range of initiatives such as Apprenticeships. Other employers have found the results useful as a tool to benchmark their recruitment and people development practices with similar employers in their area or industry. Your support with this survey would be very much appreciated.
More details can be found on their website:
https://www.gov.uk/government/news/employer-perspectives-survey-2014-now-underway.]
ALL: Can I just check, are you the best person at this site to answer questions on this subject? Are you available to take part now?
WL: INTERVIEWER NOTE: IF RESPONDENT REQUESTS AN INTERVIEW IN WELSH, SELECT CONTINUE AND CHOOSE S4=1.
Continue 1 CONTINUE
Referred to someone else at establishment
NAME_____________________________
JOB TITLE_________________________
2 TRANSFER AND RE-INTRODUCE
Hard appointment 3
MAKE APPOINTMENT
Soft appointment 4
Requested reassurance email (insert email address)
DP: SEND AUTOMATIC EMAIL 9
Refusal 5
THANK AND CLOSE Refusal – company policy 6
Refusal – taken part in recent survey 7
ASK IF WELSH LANGUAGE CALLBACK
S3WELSH Good morning / afternoon, my name is NAME, calling from IFF Research, an independent market research company.
One of our interviewers called you recently about the Employer Perspectives Survey run on behalf of the UK Commission for Employment and Skills. You said you would like to be called back in Welsh.
Would now be a good time to do the interview? When would be a suitable time to conduct the interview with you?
Continue 1 CONTINUE TO A1
Referred to someone else at establishment
NAME_____________________________
JOB TITLE_________________________
2 TRANSFER AND RE-INTRODUCE
Hard appointment 3
MAKE APPOINTMENT
Soft appointment 4
Requested reassurance email (insert email address)
DP: SEND AUTOMATIC EMAIL IN APPENDIX A 9
Refusal 5
THANK AND CLOSE Refusal – company policy 6
Refusal – taken part in recent survey 7
Not available in deadline 8
REASSURANCES TO USE IF NECESSARY
The interview will take around 20-25 minutes to complete.
Please note that all data will be reported in aggregate form and your answers will not be reported to our client in any way that would allow you or your organisation to be identified.
If respondent wishes to confirm validity of survey or get more information about aims and objectives, they can call:
MRS: Market Research Society on 0500 396 999
ASK IF HARD OR SOFT APPOINTMENT SELECTED AND WELSH SAMPLE (S3=3/4 AND COUNTRY=4)
S3A Would you prefer us to call you back in Welsh or English?
Welsh 1
“One of our Welsh speaking interviewers will call back in the next one or two working days to make an appointment with you.”
THANK AND CLOSE
English 2 CONTINUE TO APPOINTMENT SCREEN
ALL: Please note, this call may be recorded for quality or training purposes.
ASK ALL WELSH (COUNTRY=4)
S4 Would you prefer the interview to be carried out in Welsh or English?
Welsh 1
“One of our Welsh speaking interviewers will call back in the next one or two working days to make an appointment with you.”
THANK AND CLOSE
Section A – Firmographics
ASK ALL
I would like to start by asking you some questions about your organisation and, specifically, the site at which you work.
A1 How many people work at this particular establishment? Please include both full-time and part-time employees on your payroll at the site and any working proprietors or owners, but exclude the self-employed and outside contractors or agency staff.
INTERVIEWER NOTE: NON-EMPLOYEE TRAINERS AND EMPLOYEES UNDER 16 SHOULD BE EXCLUDED.
PROBE FOR BEST ESTIMATE AND RECORD NUMBER CLOSE IF DK/REF
CATI TO CODE RANGE AUTOMATICALLY AND CHECK QUOTA
1 1 THANK AND CLOSE
2-4 2
5-9 3
10-24 4
25-49 5
50-99 6
100-249 7
250 or more 8
ASK ALL
A2 Is this establishment...?
READ OUT. SINGLE CODE.
The only establishment in the organisation, or 1
One of a number of establishments within a larger organisation 2
A3 THERE IS NO A3
IF A1<250 AND A2=2
A4 And how many people does your organisation employ, including those at this site and those based elsewhere? Is it 250 or more, or less than 250?
250 or more 1
Less than 250 2
ASK ALL
A5 Would you classify your organisation as one ...?
READ OUT.CODE ONE ONLY
MAINLY seeking to make a profit (i.e. private sector) 1
A charity or voluntary sector organisation or a social enterprise 2
A local-government financed body
ADD IF NECESSARY: such as a school or a body delivering leisure, transport, social care, waste or environmental health services
3
A central government financed body
ADD IF NECESSARY: such as the Civil Service, any part of the NHS, a college or university, the Armed Services, an Executive Agency or other non-departmental public bodies
4
DO NOT READ OUT: None of the above, other (specify) 5
ASK ALL
A6 How long has your organisation been operating?
PROBE FOR BEST ESTIMATE
Under 1 year 1
1-3 years 2
Over 3 years up to and including 5 years 3
Over 5 years up to and including 10 years 4
Over 10 years 5
DO NOT READ OUT: Don’t know X
ASK ALL PRIVATE SECTOR (A5=1)
A6A Which of the following statements best applies to your outlook for the business over the next 12 months: You expect the business to…
READ OUT; CODE ONE ONLY
Grow significantly 1
Grow slightly 2
Remain about the same 3
Contract slightly 4
Contract significantly or close down 5
ASK ALL
IF MULTI-SITE ORGANISATION, SAY: From now on, when I use the word “establishment”, I mean the site at which you work.
A7 I have [SIC DESCRIPTION ON SAMPLE] as a general classification for your establishment. Does this sound about right?
Yes 1
No 2
IF NO (A7=2):
A8 How would you describe the main business activity of this establishment?
PROBE FULLY:
What would you type into a search engine to find an establishment like yours online? What exactly is made or done at this establishment?
WRITE IN. MUST CODE TO 4-DIGIT SIC07.
IF IN OPERATION FOR OVER A YEAR (A6≠1)
A9 Over the past 12 months, has the number of people employed at this
establishment…?
READ OUT AND CODE ONE ONLY.
Broadly remained the same, 1
Increased 2
Decreased 3
DO NOT READ OUT: Was not in business 12 months ago 4
Section C – Recruitment
ASK ALL
C1 Have you had any vacancies for either full-time or part-time staff in the past 12 months, regardless of whether you managed to fill them or not?
Yes 1
No 2
Don’t know X
ASK ALL
C2 Have you heard of any of the following services or initiatives? READ OUT. CODE ALL THAT APPLY
IF YES TO ANY ABOVE AND HAVE HAD VACANCIES IN LAST YEAR (C1=1 AND C2≠22) ASK C3 FOR EACH HEARD OF
C3 And have you made use of [IF MORE THAN ONE CODE SELECTED AT C2: any of] the
following to recruit staff over the past 12 months?
DISPLAY THOSE MENTIONED AT C2 (EXCEPT SOCIAL MOBILITY BUSINESS COMPACT). READ OUT. CODE ALL THAT APPLY.
C2 C3
Graduate Talent Pool 1 1
EN/WL/SC: Universal Jobmatch service 2 2
EN/WL/SC: Jobcentre Plus’s recruitment services 3 3
EN/WL/SC: Youth Contract 4 4
EN: Social Mobility Business Compact 5 -
NI Jobcentre’s recruitment services 6 6
NI: Employers Online 7 7
NI: Steps to Work 8 8
NI: Bridge to Employment 9 9
NI: Youth Employment Scheme 10 10
NI: Training for Success 11 11
SC: Training for Work 12 12
SC: Get Ready for Work 13 13
SC:Community Jobs Fund 14 14
SC:Employer Recruitment Incentive 15 15
SC: Employability Fund 16 16
WL: Go Wales 17 17
WL: Jobs Growth Wales 18 18
WL: ReAct, Redundancy Action Scheme 19 19
WL: Young Recruits Programme 20 20
WL: Traineeships 21 21
IF HAVE HAD VACANCIES (C1=1)
C4 What channels have you used in the last 12 months to try to fill vacancies? DO NOT READ OUT; PROMPT AS NECESSARY; CODE ALL THAT APPLY
PUBLIC FREE
EN/SC/WL: Jobcentre Plus services including Universal Jobmatch
NI: Jobcentre/Jobs and Benefits Office (including Employers Online) 1
Government programmes and schemes 2
EN: National Apprenticeship Service (NAS) Apprenticeship Vacancies system 3
EN: National Careers Service 4
WL: Apprenticeship Matching Service 5
PRIVATE PAID FOR
National press 6
Local press 7
Trade press / professional publications 8
Recruitment agencies 9
Paid for Recruitment websites (e.g. Monster, Jobsite or Total Jobs) 10
PRIVATE FREE
School / college / university job fairs or career services 11
Word of mouth / personal recommendation 12
Internal notices (notice boards / intranet) / filled it internally 13
Own website 14
Social media 15
Other free websites (e.g. Gumtree) 16
Notice boards / shop windows 17
Speculative enquiries 18
Other (SPECIFY) 19
ASK ALL
C5 I’d now like you to think about the factors you look for in candidates when you are looking to recruit new employees. For each factor that I read out, please say if it is critical, if it is a significant factor, if you place a small amount of value on it, or if it has no value for you?
READ OUT AND PROMPT AS NECESSARY
IF HAVE HAD VACANCIES IN LAST 12 MONTHS (C1=1)
C6A You said you have had vacancies in the last 12 months – can I just check, have you actually recruited anyone in the past year? IF NECESSARY: whether or not they are still working for you
IF RECRUITED IN LAST 12 MONTHS (C6A=1)
C6B And has anyone you’ve recruited in the last 12 months been between the ages of 16 and 18?
IF RECRUITED IN LAST 12 MONTHS (C6A=1)
C6C Has anyone you’ve recruited been between the ages of 19 and 24?
IF UNSURE WHETHER ANY RECRUITED EITHER 16-18 OR 19-24 YEAR OLDS (C6B=X AND C6C=X)
C6D Can I just check if you have recruited anyone under 25 years of age in the last 12 months?
IF RECRUITED IN LAST 12 MONTHS (C6A=1)
C6E And has anyone you’ve recruited in the last 12 months been aged over 50?
DP: Show C6A-C6E on separate screens C6A (Any)
C6B (16-18)
C6C (19-24)
C6D (Under 25)
C6E (Over 50)
Yes 1 1 1 1 1
No 2 2 2 2 2
Don’t know X X X X X
C7 THERE IS NO C7
Critical Significant
Small amount of value
No value
Don’t know
Having a particular level of achievement of academic qualifications (e.g. GCSEs, A levels or a degree)
1 2 3 4 X
Maths and English GCSE to at least level 2
or GCSE A*-C 1 2 3 4 X
Having a relevant vocational qualification 1 2 3 4 X
IF HAVE RECRUITED YOUNG PERSON/PEOPLE (C6B=1 OR C6C=1 OR C6D=1)
The next few questions relate to the last young person you recruited, that is someone under the age of 25.
C8 Firstly, what position or role were they recruited to?
PROMPT FOR FULL DETAILS (E.G. IF MANAGER, WHAT TYPE OF MANAGER?)
WRITE IN
ALLOW DK
C9 THERE IS NO C9
IF HAVE RECRUITED YOUNG PERSON/PEOPLE (C6B=1 OR C6C=1 OR C6D=1) C10 What channels did you use to fill this role?
DO NOT READ OUT; CODE ALL THAT APPLY DP: SHOW ALL PRE-CODES HERE
PUBLIC FREE
EN/SC/WL: Jobcentre Plus services including Universal Jobmatch
NI: Jobcentre/Jobs and Benefits Office (including Employers Online) 1
Government programmes and schemes 2
EN: National Apprenticeship Service (NAS) Apprenticeship Vacancies system 3
EN: National Careers Service 4
WL: Apprenticeship Matching Service 5
PRIVATE PAID FOR
National press 6
Local press 7
Trade press / professional publications 8
Recruitment agencies 9
Paid for Recruitment websites (e.g. Monster, Jobsite or Total Jobs) 10
PRIVATE FREE
School / college / university job fairs or career services 11
Word of mouth / personal recommendation 12
Internal notices (notice boards / intranet) / filled it internally 13
Own website 14
Social media 15
Other free websites (e.g. Gumtree) 16
Notice boards / shop windows 17
Speculative enquiries 18
[INSERT RESPONSE TO ‘Other (SPECIFY)’ AT C4] 19
Other (Please specify) 20
Recruitment of Education Leavers
ASK ALL
C10A Thinking about your establishment’s more historic recruitment processes, in the last
2-3 years has this site taken on anyone to their first job on leaving school, college or university?
Yes 1
No 2
Don’t know X
IF RECRUITED EDUCATION-LEAVERS AND ENGLAND, NI OR WALES (C10A=1 AND COUNTRY=1, 2 OR 4)
C10B Have any of these been…
READ OUT
Yes No Don’t know i) 16 year olds recruited to their first job on leaving school
[IF NECESSARY ADD: Who have undertaken compulsory education but no more]
1 2 3
ii) 17 or 18 year olds recruited to their first job from school 1 2 3
iii) 17 or 18 year olds recruited to their first job from FE
College 1 2 3
iv) Recruited to their first job from University or another
Higher Education institution, regardless of their age 1 2 3
IF RECRUITED DIRECTLY FROM EDUCATION ESTABLISHMENTS LISTED AT C10B (C10B(ANY)=1)
C10C Thinking of those recruited in the last 2-3 years, how well prepared for work have the…
(C10B=1) 16 year old school leavers been?
(C10B=1) 17-18 year olds you recruited to their first job from school been?
(C10B=1) 17-18 year olds you recruited to their first job from FE Colleges been?
(C10B=1) university or higher education leavers been?
READ OUT FOR EACH
Very well prepared 1
Well prepared 2
Poorly prepared 3
Or very poorly prepared 4
DO NOT READ OUT: Don’t know X
ASK IF POORLY OR VERY POORLY PREPARED FOR EACH ITERATION OF C10C (C10C=3-4).
C10D In what ways have they been poorly prepared?
DO NOT READ OUT. PROBE FULLY. CODE ALL THAT APPLY.
Lack required skills or competencies (e.g. technical or job specific skills, IT skills,
problem solving skills, team working skills) 1
Literacy/numeracy skills 2
Poor education 3
Lack of common sense 4
Poor attitude / personality or lack of motivation (e.g. poor work ethic, punctuality,
appearance, manners) 5
Lack of working world / life experience or maturity (including general knowledge) 6
Other (WRITE IN) 7
Don’t know (ALLOW SINGLE CODE ONLY) X
IF RECRUITED EDUCATION-LEAVERS AND SCOTLAND (F1=1 AND COUNTRY=3) ASK C10E TO C10G IN A LOOP
C10E Have any of these been recruited to their first job from…
READ OUT
Yes No Don’t know
i) A Scottish secondary school 1 2 3
ii) A Scottish FE College 1 2 3
iii) A Scottish University 1 2 3
IF RECRUITED DIRECTLY FROM EDUCATION ESTABLISHMENTS LISTED AT C10E (C10E(ANY)=1)
C10F Thinking of those recruited in the last 2-3 years to their first job on leaving
(C10Ei=1) a Scottish secondary school,
(C10Eii=1) a Scottish FE college,
(C10Eiii=1) a Scottish University,
...in relation to their preparedness for work would you say that they were…?
READ OUT FOR EACH
Very well prepared 1
Well prepared 2
Poorly prepared 3
Or very poorly prepared 4
DO NOT READ OUT: Don’t know X
ASK IF POORLY OR VERY POORLY PREPARED FOR EACH ITERATION OF C10F (C10F=3-4).
C10G In what ways have they been poorly prepared?
DO NOT READ OUT. PROBE FULLY. CODE ALL THAT APPLY.
Lack required skills or competencies (e.g. technical or job specific skills, IT skills,
problem solving skills, team working skills) 1
Literacy/numeracy skills 2
Poor education 3
Lack of common sense 4
Poor attitude / personality or lack of motivation (e.g. poor work ethic, punctuality,
appearance, manners) 5
Lack of working world / life experience or maturity (including general knowledge) 6
Other (WRITE IN) 7
Don’t know (ALLOW SINGLE CODE ONLY) X
C11-16 THERE IS NO C11 - C16
Work experience and traineeships
ASK ALL
C17 I'd now like to return to your establishment's activities in the past year. Thinking about people of all ages, in the last 12 months have you had anyone in on: [C17 ITERATION TEXT]?
READ OUT
Yes No Don’t know
a. Placements for people at school 1 2 3
b. Placements for people at Further Education or sixth form college 1 2 3
c. Placements for people at university 1 2 3
d. Internships, either paid or unpaid 1 2 3
EN only:
e. Traineeships, under a government scheme introduced in 2013 to give work experience to people not in work who need additional skills to get a job or an apprenticeship
1 2 3
f.[EN: Other placements; NI/SC/WL: Placements] specifically targeted at giving work experience to the unemployed (such as through Jobcentre
Plus’ Work Programme scheme or Work Experience schemes [EN/SC:
and Sector-Based Work Academies)] [NI: and the Steps to Work or Youth Employment Scheme])
1 2 3
g. Work trials for potential new recruits 1 2 3
h. Any other type of placement? (SPECIFY)
INTERVIEWER NOTE: If apprenticeships mentioned under ‘other’ please inform respondent that this will be covered explicitly later in the survey. Do not code them as ‘yes’ here.
C18-C19C: ASK IN A LOOP C17a . P lac em en ts f or pe op le at s c ho o l b. P lac e me nts f or pe op le a t F urther E du c at ion or s ix th form c ol le ge c . P lac e me nts fo r p eo p le at un iv ers ity d. Int erns hi ps e. T rai ne es h ips f. P lac em en ts ] s p ec ifi c a lly targete d a t gi v ing work ex pe ri e nc e t o th e un em pl oy ed g. W ork tria ls fo r po ten ti a l ne w r ec rui ts h. [i ns ert C1 7h a ns wer ]
FOR EACH “YES” AT C17
C18
You said you had had people on [C17 ITERATION]. In the last 12 months, how many people have you had on [C17 ITERATION]?
DP: MINIMUM OF ‘1’ ALLOWED ENTER NUMBER
(or DK)
FOR EACH “YES” AT C17 ON ITERATIONS 2 – 4 and 6 - 8
C19 And how old have the people on these placements in the last 12 months been? IF NEEDED: [INSERT ITERATION TEXT]
READ OUT; CODE ALL THAT APPLY
Under 25 1 1 1 1 1 1
25 or over 2 2 2 2 2 2
Don’t know 3 3 3 3 3 3
FOR EACH “YES” AT C17:
C19A Typically, how long did these placements last?
ADD IF NECESSARY: Please consider the length of time of your most recent or common placements.
PROMPT IF NECESSARY; CODE ONE ONLY
A week or less 1 1 1 1 1 1 1 1
Two to three weeks 2 2 2 2 2 2 2 2
Around a month 3 3 3 3 3 3 3 3
Two to three
months 4 4 4 4 4 4 4 4
Four to six months 5 5 5 5 5 5 5 5
Seven to 12 months 6 6 6 6 6 6 6 6
Over a year 7 7 7 7 7 7 7 7
Don’t know 8 8 8 8 8 8 8 8
FOR EACH “YES” AT C17:
C19C In the last 12 months has your establishment taken on anyone who has been on this kind of placement with you into a permanent or long-term paid role?
IF NEEDED: [INSERT ITERATION TEXT]
READ OUT; CODE ALL THAT APPLY Yes – at the end of
their placement 1 1 1 1 1 1 1 1
Yes – after they finished their education / course / degree
2 2 2 2 2 2 2 2
No (ALLOW SINGLE CODE ONLY)
3 3 3 3 3 3 3 3
DO NOT READ OUT: Don’t know (ALLOW SINGLE CODE ONLY)
IF HAVE OFFERED PLACEMENTS (ANY C17=1)
C20 What are the main reasons you offer work experience placements or internships? DO NOT READ OUT; CODE ALL THAT APPLY
Part of formal Social responsibility / CSR policy 1 Moral reasons / benefits to young people / doing our “bit” 2
Do not need to pay them 3
Gives them experience 4
Raises our profile in the recruitment market 5
Helps us with recruitment / use it as a trial period 6
Other (SPECIFY) 7
DO NOT READ OUT: Don’t know (ALLOW SINGLE CODE ONLY) 8
C21 THERE IS NO C21
ASK IF ENGLAND EMPLOYER AND NOT OFFERED TRAINEESHIPS (COUNTRY=1 AND C17e=2/3)
C22 I’d now like to ask you about your awareness of Traineeships, a Government programme introduced in August 2013.
These offer 16 to 23 year olds who are not in work and looking to get a paid job the opportunity to undertake substantial work placements alongside support with basic skills such as Maths and English to help them progress onto an apprenticeship or secure other employment.
ADD IF NECESSARY: from August 2014 Traineeships will be available for those aged 16 to 24 who are not in work and looking to get a paid job.
Which of these best describes your awareness of Traineeships? Would you say… READ OUT. CODE ONE ONLY
You have not heard of Traineeships 1
You are aware of them but do not know what they are 2
You are aware of them and have some knowledge of what they involve 3
You have a good knowledge of them and what they involve 4
DO NOT READ OUT: Don’t know 5
ASK ALL ENGLAND EMPLOYERS WHO HAVE HAD, OR ARE AWARE OF, TRAINEESHIPS (COUNTRY=1 AND (C17e=1 OR C22=3/4)
C22A Does your establishment plan to offer Traineeships in the future?
Yes 1
No 2
ASK ALL
C23 I’d now like to move on to your establishment’s involvement with educational institutions such as schools, colleges and universities, where you might have
provided other forms of work-related experience to their students, outside of what we have just been discussing.
So, during the past 12 months has your establishment…?
IF EDUCATION SECTOR (SECTOR15=13): ADD IF RESPONDENT BELONGS TO EDUCATIONAL INSTITUTION OR TRAINING PROVIDER: Please focus on your establishment’s engagement with students external to your organisation.
INTERVIEWER NOTE: PLEASE ENSURE YOU ONLY CAPTURE ACTIVITY ADDITIONAL TO THAT DISCUSSED AT C17.
READ OUT; CODE ALL THAT APPLY.
Yes No Don’t know i. Sponsored, supported or participated in any enterprise
competitions 1 2 X
ii. Provided one to one mentoring support, either face to face
or online to students 1 2 X
iii. Conducted mock interviews with students 1 2 X
iv. Held site visits at your establishment for students 1 2 X
v. Been into schools, colleges or universities to talk to
students about careers in your organisation or sector 1 2 X
vi. Helped design and/or set coursework for students 1 2 X
ASK IF HAD ANY ENGAGEMENT IN THIS WAY (ANY C23=1)
C24 And thinking about these particular areas we have just discussed, with which of the following educational institutions did you have this involvement in the last 12 months?
READ OUT.
YES NO DK
_1 Schools 1 2 3
_2 Further Education or sixth form colleges 1 2 3
_3 Universities 1 2 3
DP: ASK C25-C25A SEQUENTIALLY FOR EACH ITERATION WHERE C24=1
ASK FOR EACH INSTITUTION WHERE HAD ENGAGEMENT IN THIS WAY (ANY C24=1)
C25 When providing these work-related experiences to students, has your establishment
encountered any difficulties when engaging with: C24 ITERATION
Yes 1
No 2
ASK IF ENCOUNTERED ANY DIFFICULTIES ENGAGING WITH EACH INSTITUTION (C25=1)
C25a And what difficulties has your establishment encountered when engaging with: C24 ITERATION
WRITE IN
Don’t know 1
ASK FOR EACH INSTITUTION WHERE NOT HAD ANY ENGAGEMENT IN THIS WAY (ANY C24=2)
C26 What would you say were the main reasons for not engaging with [c24=2 iteration] to provide work-related experiences to their students?
ADD IF NECESSARY: Is there anything in particular about these institutions or their students which has discouraged you from engaging with them?
DO NOT READ OUT. CODE ALL THAT APPLY
Very few institutions in the local area 1
Not been approached by these institutions 2
Difficulties communicating with these institutions 3
These institutions are not interested in engaging with our
organisation / industry 4
Their students are too advanced for the type of work we
do 5
Their students are not advanced enough for the type of
work we do 6
Don’t have the time or resource to engage with these
institutions 7
Legal requirements (e.g. age requirements / need for
qualifications) 8
Too much bureaucracy / red tape 9
IF MULTISITE (A2=2): Head Office decision 10
Other (SPECIFY) 11
SINGLE CODE: No particular reason 12
ASK IF NOT HAD ANYONE IN ON WORK PLACEMENTS OR CONDUCTED WORK INSPIRATION (ALL C17=2/3 AND ALL C23=2/3)
C27 You mentioned that you have not had any work placements or internships in the last 12 months, or engaged with educational institutions to provide other forms of work-related experience to their students. What would you say are the main reasons for not doing so?
DO NOT READ OUT; CODE ALL THAT APPLY
We have no suitable roles 1
Do not have the time / resource to manage it 2
Does not offer us any business benefits / Benefits not worth cost 3
Would like to but don’t know how to organise 4
Never thought about it 5
No one has approached us 6
Recruitment freeze 7
Schools are difficult to engage with 8
Further Education / 6th form colleges are difficult to engage with 9
Universities are difficult to engage with 10
Company policy / Head Office decision 11
Other (SPECIFY) 12
DO NOT READ OUT: Don’t know (ALLOW SINGLE CODE ONLY) X
ASK IF NOT HAD ANYONE IN ON WORK PLACEMENTS OR CONDUCTED WORK INSPIRATION (ALL C17=2/3 AND ALL C23=2/3)
C28 What, if anything, could be done to encourage employers such as you to offer work experience placements, or engage with educational institutions in future?
DO NOT READ OUT; CODE ALL THAT APPLY
Less bureaucracy (for example around employment law, health and safety, child protection etc.) 1
Better quality of placement candidates 2
Financial incentives to compensate for the resource used 3
Practical assistance managing the placements 4
Pro-active approaches from schools/colleges/universities 5
Help or advice on finding candidates 6
Other (WRITE IN) 7
Nothing 8
Section D – People Development
Sources of information and advice
ASK ALL
D1 I would now like to talk about the support that is available to businesses and organisations like yours to develop the skills of your employees.
In the past 12 months, as far as you know, has anyone at this establishment sought or received information, advice or more practical help on skills or training-related issues from people external to your organisation?
Yes 1
No 2
Don’t know 3
ASK IF HAVE NOT SOUGHT OR RECEIVED INFO ON SKILLS OR UNSURE (D1=2/3) D1A And has your establishment experienced any skills or training-related issues in the
last 12 months where you might have needed information, help or advice?
Yes 1
No 2
Don’t know 3
ASK IF HAD SKILLS ISSUES IN LAST 12 MONTHS AND NOT SOUGHT HELP (D1A=1 AND D1=2)
D1B Which of the following were reasons for not seeking help on skills or training-related issues from an external organisation?
READ OUT; CODE ALL THAT APPLY.
You were able to deal with these issues in-house 1
There were no external organisations you felt you could trust with these
issues 2
You did not know where you could go to find help 3
The issue was too specific for an external organisation to help 4
IF MULTISITE (A2=2)
Another part of the organisation deals with these issues 5
Any other reason (Please specify) 6
DO NOT READ OUT: No particular reason 7
ASK IF HAVE RECEIVED ADVICE (D1=1)
D1C What prompted your establishment to decide to seek advice or help on skills and training related issues?
ADD IF NECESSARY: Was there perhaps anything you saw or attende