Changes through Primary B-Cell Outgrowth Reveals Delayed Kinetics
of Latent Membrane Protein 1-Mediated NF-
B Activation
Alexander M. Price,aJason P. Tourigny,aEleonora Forte,a* Raul E. Salinas,aSandeep S. Dave,band Micah A. Luftiga
Department of Molecular Genetics and Microbiology, Center for Virology, Duke University Medical Center, Durham, North Carolina, USA,a
and Institute for Genome Sciences and Policy, Duke University, Durham, North Carolina, USAb
Epstein-Barr virus (EBV) is an oncogenic human herpesvirus that dramatically reorganizes host gene expression to immortalize primary B cells. In this study, we analyzed EBV-regulated host gene expression changes following primary B-cell infection, both during initial proliferation and through transformation into lymphoblastoid cell lines (LCLs). While most EBV-regulated mRNAs were changed during the transition from resting, uninfected B cells through initial B-cell proliferation, a substantial number of mRNAs changed uniquely from early proliferation through LCL outgrowth. We identified constitutively and dynami-cally EBV-regulated biological processes, protein classes, and targets of specific transcription factors. Early after infection, genes associated with proliferation, stress responses, and the p53 pathway were highly enriched. However, the transition from early to long-term outgrowth was characterized by genes involved in the inhibition of apoptosis, the actin cytoskeleton, and NF-B ac-tivity. It was previously thought that the major viral protein responsible for NF-B activation, latent membrane protein 1 (LMP1), is expressed within 2 days after infection. Our data indicate that while this is true, LCL-level LMP1 expression and NF-B activity are not evident until 3 weeks after primary B-cell infection. Furthermore, heterologous NF-B activation during the first week after infection increased the transformation efficiency, while early NF-B inhibition had no effect on transforma-tion. Rather, inhibition of NF-B was not toxic to EBV-infected cells until LMP1 levels and NF-B activity were high. These data collectively highlight the dynamic nature of EBV-regulated host gene expression and support the notion that early EBV-infected proliferating B cells have a fundamentally distinct growth and survival phenotype from that of LCLs.
E
pstein-Barr virus (EBV) infection of primary resting human B cells transforms them into lymphoblastoid cell lines (LCLs). EBV-mediated growth transformation depends on the expression of a set of viral genes collectively called the latency III gene expres-sion program. Initially after B-cell infection, EBV genomes enter the nucleus, circularize, and are chromatinized (24). The earliest latent genes are expressed from the viral W promoter (Wp) and encode the EBNA-LP and EBNA2 proteins (1,59). EBNA2 acts as a potent transcriptionaltrans-activator and is complemented by EBNA-LP to induce viral genes, through the upstream C pro-moter (Cp), as well as cellular genes that control entry into the cell cycle (47,58,59). Cp-driven mRNAs accumulate through the first several cell divisions following infection, leading to increased pro-duction of the EBNA3 family of proteins (EBNA3A, -3B, and -3C), EBNA1, and the viral BHRF1 microRNAs (miRNAs) (1,61). Cp-driven gene expression attenuates Wp usage initially (59), and ultimately, Wp is silenced through DNA methylation (53). The viral latent membrane proteins (LMPs) 1, 2A, and 2B also accu-mulate following EBNA2-mediated activation of their divergent promoters (19, 44, 54, 56). Additionally, an increasing body of literature indicates that a set of lytic cycle genes are expressed transiently early after B-cell infection, although no virion DNA synthesis occurs, no late gene products are made, and no virions are produced (22). Despite our understanding of the kinetic order of viral gene expression during early B-cell infection, little is un-derstood regarding the cellular genes that are regulated during these early times after infection as B cells begin to proliferate.Previous studies of early events following B-cell infection have identified a relatively small set of B-cell activation-, cell cycle-, and apoptosis-associated genes (8,15, 18, 43,47). In these studies,
cyclin D2 and cyclin E1 were found to be induced concomitant with phosphorylation of Rb family members and E2F1 gene ex-pression, at approximately 3 days postinfection (47). These changes are consistent with the initiation of EBV-driven B-cell proliferation. Furthermore, we recently identified the DNA dam-age response (DDR) as a potent restrictor of EBV-mediated B-cell immortalization (35). The DDR is activated during a period of hyperproliferation, 4 to 8 days following primary B-cell infection, in which cells divide once per 8 to 12 h. After the first 4 or 5 cell divisions, EBV-infected B cells attenuate this proliferation rate such that they divide once per⬃24 h, similar to LCLs (35). Genes associated with an activated DDR and proliferation follow a sim-ilar pattern of high expression early after infection and then atten-uated expression in LCLs. A more comprehensive analysis of EBV-regulated host gene expression during the transition from early hyperproliferating cells to LCLs is lacking.
Several studies have been performed to analyze EBV-regulated gene expression uponde novoinfection of Burkitt’s lymphoma (BL) cells as well as to compare EBV-positive to EBV-negative cell
Received30 April 2012Accepted25 July 2012
Published ahead of print1 August 2012
Address correspondence to Micah A. Luftig, [email protected].
* Present address: Eleonora Forte, Department of Microbiology-Immunology, Northwestern University, Feinberg School of Medicine, Chicago, Illinois, USA.
A.M.P. and J.P.T. contributed equally to this article.
Copyright © 2012, American Society for Microbiology. All Rights Reserved.
doi:10.1128/JVI.01069-12
on November 7, 2019 by guest
http://jvi.asm.org/
lines and tumors (7). These studies collectively indicate that the core gene regulatory activities in an EBV-immortalized LCL in-clude (i) EBNA2-driven, RBP-J/CBF1/CSL-dependent activa-tion of cell cycle regulatory and B-cell activaactiva-tion genes (31,50,63); and (ii) LMP1-mediated, constitutive, antiapoptotic NF-B, AP1 (c-Fos/c-Jun), and ATF2 activities (6, 11). Other viral latency genes can also impact the LCL transcriptome, including the genes encoding EBNA1 (3), the EBNA3 proteins (57, 62), and viral miRNAs (46). In particular, the EBNA3 proteins impinge on host gene expression through recruitment of histone deacetylases and other chromatin modifying proteins that epigenetically modify the promoter regions of cyclin-dependent kinase inhibitor genes such as the p16(INK4a) gene (32,45) and of apoptotic genes such as the Bim gene (4).
EBNA2 targets cellular genes primarily through its association with RBP-J, in essence mimicking downstream Notch signaling (14,17). In fact, canonical Notch targets such as Hes1 and Hey1 are also EBNA2 targets (31,50). Furthermore, several studies have identified direct EBNA2 targets, including the transcription fac-tors c-Myc, Ets1, and Runx3, as well as indirect EBNA2 targets, such as cyclin D2 and E2F1 (21,48,49,63). A recent study of genome-wide EBNA2 targets indicates that in addition to RBP-J sites, EBNA2 is also directed to cellular genes by early B-cell factor (EBF), RUNX, ETS, NF-B, and PU.1 motifs (64). Thus, the com-plexity and integrative nature of EBNA2-mediated gene regula-tion are likely more sophisticated than was previously appreci-ated.
EBV latency III conversion of BL41 cells is known to alter the expression of several hundred host genes, and most of these changes are also regulated by heterologous LMP1 expression in BL41 cells (6). These data suggest an important role for the NF-B signaling pathway as a primary mediator of EBV latency III-regu-lated host gene expression. In fact, the importance of these changes has been well validated by genetic and pharmacological approaches, indicating a requirement for NF-B in the survival of LCLs (6,23). The role of NF-B signaling during the earliest stages of B-cell immortalization has not been studied extensively.
In this report, we comprehensively describe the dynamic changes in host gene expression during primary B-cell infection by EBV. We have identified gene ontology (GO) groups that are constitutively altered following B-cell infection and through im-mortalization and also those that are uniquely changed from early to late times after infection. Surprisingly, the major genes regu-lated from approximately 1 to 2 weeks after B-cell infection are the NF-B-regulated genes. We further characterized and substanti-ated this finding with complementary experiments assessing LMP1-induced NF-B activity and its role at different times dur-ing B-cell outgrowth.
MATERIALS AND METHODS
Cell lines and culture conditions.Human peripheral blood mononuclear cells (PBMCs) were obtained by Ficoll purification (Histopaque-1077 col-umn; Sigma) of buffy coats from healthy donors (Carolina Red Cross) and were kept in RPMI 1640 medium (Invitrogen) supplemented with 15% fetal bovine serum (Gemini Bio Products), 100 U/ml penicillin, and 2 mM L-glutamine (Invitrogen). B cells were separated using human B-lympho-cyte enrichment set DM (IMag; BD) as recommended by the manufac-turer. PBMCs were infected with limiting amounts of B95-8 virus (0.4 to 12l EBV B95-8 Z-HT supernatant/1⫻106PBMCs) in the presence of
cyclosporine (0.5g/ml) for 1 h at 37°C. The cells were washed once in phosphate-buffered saline (PBS) and then resuspended in fresh medium.
For each infection condition, 105cells were plated in a 96-well plate (10
wells in total) to grow as LCLs. Microarray samples were generated from monoclonal LCLs produced from the smallest amount of virus used. For the purification of EBV-positive and proliferating B cells, 1.5 ⫻108
PBMCs were stained with 4M 6-carboxyfluorescein succinimidyl ester (CFSE) for 3 min and then washed three times in washing buffer (PBS plus 5% fetal bovine serum). Stained PBMCs (106/ml) were infected with 25 l/1⫻106PBMCs of B95-8 virus as already described. The cells were
washed once in PBS and then resuspended in fresh medium. At 6 days postinfection, CFSE-labeled PBMCs were washed in washing buffer and stained with allophycocyanin (APC)-labeled anti-CD19 (BD Biosciences) (2l/3⫻105PBMCs) for 30 min on ice. After 3 washes in washing buffer,
CD19⫹CFSElowcells were sorted on a FACSVantage flow cytometer.
Sorted B cells were analyzed for the presence of the EBV genome by fluo-rescencein situhybridization and for EBNA-LP by immunofluorescence assay (35).
Antibodies.Primary antibodies to RelA, RelB, IB␣, and NF-B2/p52 were purchased from Cell Signaling. Phospho-specific antibodies to Ser176/180 or Ser177/181 of IB kinase␣/(IKK␣/), Ser32 of IB␣, and Ser536 of p65 were also purchased from Cell Signaling. Primary antibod-ies to TRAF1,␣-tubulin, and MAGOH were purchased from Santa Cruz Biotechnology. Horseradish peroxidase (HRP)-conjugated anti-rabbit and anti-mouse secondary antibodies were purchased from Cell Signal-ing. Mouse anti-human CD19 antibody was purified from the superna-tant of the 33-6-6 hybridoma cell line (a kind gift of T. Tedder, Duke University Medical Center) and conjugated to either phycoerythrin (PE) or APC for use as a surface B-cell marker in flow cytometry. An agonistic anti-CD40 antibody was purified from the supernatant of the G28-5 hy-bridoma cell line (a kind gift of E. Kieff, Harvard Medical School).
Compounds.IKKwas inhibited using the Calbiochem IKK-2 inhib-itor IV. Cell proliferation was measured by staining PBMCs with CFSE (Sigma) or CellTrace violet (Invitrogen).
Microarray analysis and gene enrichment.Total mRNAs from four healthy donors were prepared under three conditions: (i) uninfected pu-rified CD19⫹B cells; (ii) infected PBMCs, sorted at 6 days postinfection for population doubling 1 to population doubling 4 (PD1-4; Prolif cells); and (iii) monoclonal LCLs derived by limiting virus dilution on PBMCs. cDNA preparation, labeling, and fragmentation were performed using a GeneChip wild-type cDNA synthesis and amplification kit (Affymetrix) and Exon array labeling kits (Affymetrix). Twelve samples (four for each condition) were hybridized to HuEx 1.0ST Exon arrays (Affymetrix), and the chips were scanned at the Duke Microarray Facility. The resultant CEL files were RMA normalized, and the data were analyzed with GenePattern (36) and GSEA v2 (52) to analyze c3 transcription factor sets. Differential expression of genes was evaluated by applying 2-way analysis of variance (ANOVA) or significance analysis of microarrays (SAM) (55). Gene on-tology categories were assessed using the PANTHER algorithm (34). K-means clustering of genes (2-way ANOVAP value of ⬍0.01; 2-fold change) with 8 nodes was performed using GenePattern (36).
B-cell proliferation assays.Human PBMCs were stained with Cell-Trace violet and then infected in bulk by incubation with supernatant from B95-8 Z-HT cells. IKK-2 inhibitor IV (1M) or the agonistic CD40 antibody G28-5 (1g/ml) was added to the cells at the various time points described. The inhibitor or agonistic antibody was washed out of the medium every 7 days and added back or not, depending on the time. After 21 days, the PBMCs were washed with PBS, stained with CD19-PE anti-body and 7-aminoactinomycin D (7-AAD), and analyzed by flow cytom-etry in the presence of 10,000 Sepharose AccuCount blank particles (Spherotech). Live proliferated B cells (CD19⫹ CellTrace violetlow
7-AADlow) were counted and normalized to the bead count. The
experi-ment was replicated for eight healthy human PBMC donors.
Transformation assays.Infection of human PBMCs by EBV B95-8 was performed in the presence of 0.1% dimethyl sulfoxide (DMSO), 1M IKK-2 inhibitor IV, or 1g/ml of agonistic CD40 antibody (G28-5), added at different times postinfection. B95-8 Z-HT supernatant was
on November 7, 2019 by guest
http://jvi.asm.org/
titrated from 1 ml/107PBMCs to 30l/107PBMCs. A total of 2.5⫻106
infected PBMCs were seeded in 24 wells of a 96-well plate for each infec-tion point. The percentage of wells positive for B-cell outgrowth (LCLs) at 5 weeks postinfection was plotted relative to the amount of virus used per well. The efficiency of transformation was determined as published pre-viously (16), with the amount of B95-8 virus necessary to yield 62.5% positive wells considered 1 transforming unit (TU) per well.
Western blotting.Samples were lysed in a 1% Triton X-100-contain-ing buffer (20 mM Tris, pH 7.5, 100 mM NaCl, 10% glycerol, 1% Triton X-100, 1 mM EDTA, 1 mM dithiothreitol [DTT], 20 mM NaF, 10 mM sodium pyrophosphate, and Complete protease inhibitors without EDTA) and normalized to total protein content by the Bradford assay (Bio-Rad). All samples were run in Novex 4 to 12% Bis-Tris gels and blotted using standard procedures. The antibodies used are described above.
RNA extraction and quantitative RT-PCR (qRT-PCR).RNA was ex-tracted from purified primary B cells by use of a Qiagen RNeasy kit. Re-verse transcription (RT) to generate cDNA was performed with a High Capacity cDNA kit (Applied Biosystems). Real-time PCR was performed using either SYBR green (Quanta Biosciences) or specific TaqMan probes in an Applied Biosystems Step One Plus instrument. A20 and TRAF1 were detected using the exon-spanning TaqMan probes Hs00560402 and Hs00194639, respectively (Applied Biosystems). ICAM1, c-FLIP, and LMP1 were detected using exon-spanning probes purchased from Inte-grated DNA Technologies, along with SYBR green.
Microarray data accession number.Exon array data have been de-posited in the Gene Expression Omnibus (GEO) under accession number GSE20200.
RESULTS
EBV dynamically regulates mRNA transcript levels during pri-mary B-cell outgrowth following infection.The global host gene expression profile in primary B cells at early times after EBV in-fection is poorly characterized. Therefore, we performed gene
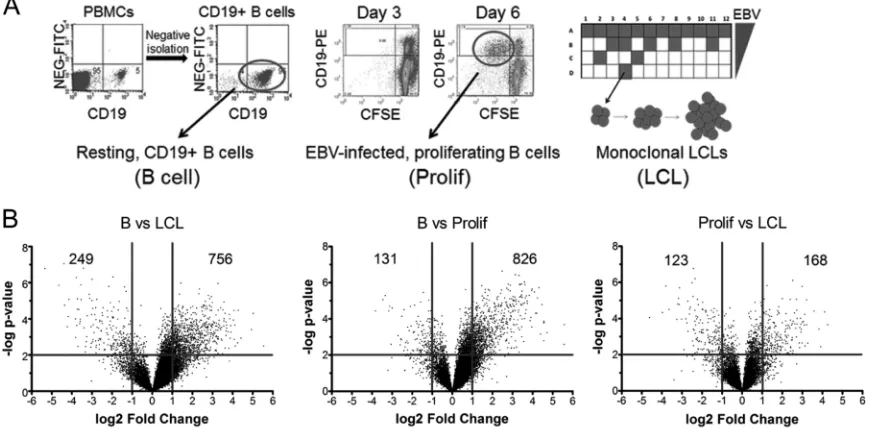
ex-pression analysis using Affymetrix Human Exon 1.0 ST (HuEx) microarrays and mRNAs from 4 biological replicates of (i) puri-fied adult human CD19⫹peripheral blood B cells, (ii) EBV-in-fected and sorted proliferating B blasts at 6 days postinfection (Prolif cells), and (iii) monoclonal LCLs (Fig. 1A). More than 90% of the sorted proliferating B cells were infected with EBV, as de-termined by fluorescencein situhybridization of the EBV genome and immunofluorescence assay of EBNA-LP (35). Hybridization data were RMA normalized, and significant gene expression changes were visualized using volcano plots of the transitions from B cells to Prolif cells, Prolif cells to LCLs, and B cells to LCLs
(Fig. 1B). EBV more strongly increased than decreased mRNA
levels upon initial B-cell proliferation, as 826 genes were signifi-cantly induced (⬎2-fold;P⬍0.01), while only 131 genes were significantly repressed (⬎2-fold). However, mRNA levels changed more evenly during the transition from Prolif cells to LCLs, where 168 mRNAs were increased⬎2-fold and 123 mRNAs were reduced⬎2-fold. Overall, from resting B cells to LCLs, 756 mRNAs were increased⬎2-fold, while 249 mRNAs were reduced ⬎2-fold.
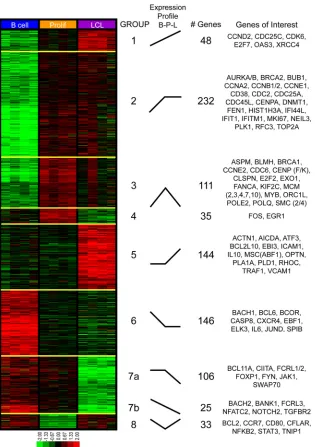
Genes exhibiting significant (2-way ANOVA P value of ⬍0.01) and robust (2-fold) expression changes across any of the three temporal states generated a universe of 874 tran-scripts that we analyzed further to assess dynamic gene expres-sion changes and gene ontology. We performed K-means clus-tering on these mRNAs, using 8 groups to represent all possible changes between the three temporal states. This analysis clearly revealed that early proliferating cells are distinct from both resting B cells and LCLs and that transcriptomic changes in-duced by EBV are diverse and temporally complex (Fig. 2). Groups 1 and 2 contain genes induced in the transition from B
FIG 1EBV regulates host gene expression throughout B-cell outgrowth. (A) Schematic of samples used for HuEX microarray analysis. (Left) CD19⫹B cells were purified from PBMCs (Carolina Red Cross) by negative isolation. Dot plots show CD19-PE staining on thexaxis and the nonspecific fluorescein isothiocyanate (FITC) channel on theyaxis for PBMCs (left) or negatively isolated cells (right). (Middle) Dot plots of CD19-PE (yaxis) versus CFSE (xaxis) indicate B cells proliferating after EBV infection. The left panel shows cells at 3 days postinfection, when few cells are dividing (i.e., CD19⫹CFSElow), while by 6 days
postinfection, proliferating B cells are readily visible (right). The circle indicates the population of cells that was sorted for each donor. (Right) Schematic diagram of a plate in which EBV infection of PBMCs leads to monoclonal LCL outgrowth. (B) Volcano plots showing gene expression changes between time points. The
yaxis depicts the negative log of thePvalue, and thexaxis depicts the log2value for the observed fold change. Vertical lines indicate a 2-fold span (Pvalue of 0.01).
on November 7, 2019 by guest
http://jvi.asm.org/
[image:3.585.75.511.70.284.2]cells to LCLs, most of which were induced primarily during the B-cell-to-Prolif-cell transition. Groups 3 and 4 contain genes that were highly induced in the transition from B cells to Prolif cells and then repressed to different extents through LCL out-growth. Group 5 contains genes that were statistically un-changed in the transition from B cells to Prolif cells but were induced in the transition from Prolif cells to LCLs. Group 6 genes were repressed early and remained low during LCL out-growth, while groups 7a and 7b were repressed at the late tran-sition from Prolif cells to LCLs. Finally, group 8 represents genes that were repressed early after infection and strongly induced during the transition from Prolif cells to LCLs.
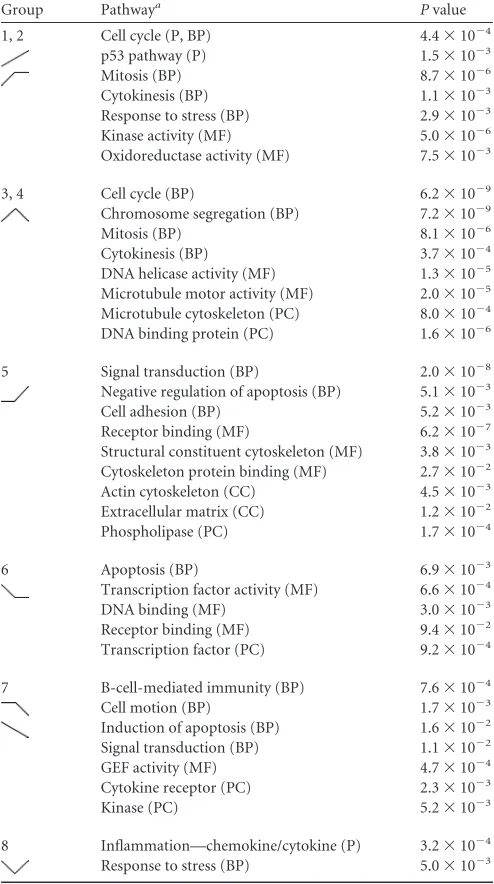
Functional annotation of EBV-regulated temporal gene ex-pression profiles.We next characterized the GO categories of the EBV-regulated genes during early versus late stages of B-cell growth transformation, using PANTHER analysis of the K-means-clustered groups (34). PANTHER allows for GO analy-sis of the following components: (i) pathways, (ii) biological pro-cesses, (iii) molecular functions, (iv) cellular components, and (v) protein classes. Importantly, PANTHER determines whether the observed number of genes from a given GO group is enriched or depleted relative to that predicted based on a reference list, which in our case was the universe of genes expressed above background at any of the three sample points.
FIG 2K-means clustering reveals distinct patterns of EBV-induced transcriptomic changes throughout outgrowth. Four biological replicates of negatively isolated resting B cells, sorted early proliferating CD19⫹CFSElowcells (Prolif), and monoclonal LCLs were isolated as described in the legend toFig. 1Aand then
subjected to microarray analysis. Genes exhibiting significant (two-way ANOVAPvalue of⬍0.01) and robust (⬎2-fold) gene expression changes were subjected to K-means clustering analysis. The gene expression level is represented by a two-tone color scale with log2values (shown at the bottom). Eight groups (groups
1 to 8) categorize the EBV-induced expression changes during B-cell outgrowth, and their relative expression changes are depicted schematically under “expression profile.” Each cluster contains a distinct number of genes, and representative genes from each cluster are listed to the right.
on November 7, 2019 by guest
http://jvi.asm.org/
[image:4.585.137.452.64.511.2]PANTHER analysis revealed expected and also novel changes in GO classes during transformation (Table 1). K-means groups 1 and 2, describing the early induction of B-cell proliferation, were characterized by robust increases in genes associated with the cell cycle, mitosis, p53 pathway signaling, and responses to stress. Sim-ilarly, the genes that were induced initially and repressed later in transformation (groups 3 and 4) included those associated with the cell cycle, microtubule function, and DNA helicase and DNA binding activities. These findings are consistent with those re-ported previously by our group indicating an early phase of cellu-lar hyperproliferation characterized by an activated DNA damage response, which was attenuated from the early to late stages of transformation (35).
Unexpected changes were observed in group 5, where GO groups associated with signal transduction, cell adhesion, negative
regulation of apoptosis, the actin cytoskeleton, and cytoskeleton protein binding were enriched in genes upregulated uniquely in the transition from early proliferating cells to LCLs. These changes are consistent with known activities associated with LMP1 and NF-B signaling (6). In fact, a simple analysis of the genes in-cluded in this group revealed many known NF-B targets, includ-ing TRAF1, EBI3, and ICAM1, among others (Fig. 2).
K-means groups 6, 7, and 8 comprise genes that were repressed upon EBV infection and are characterized by a diverse set of GO classes. K-means group 6 genes were repressed upon early prolif-eration and were enriched for genes encoding DNA binding pro-teins, specifically transcription factors, including both repressors such as BCL6, BCOR, and BACH1 and activators such as JUND, EBF1, and ELK3. Furthermore, chemokine receptor genes were enriched in this group, including the most EBV-downregulated gene in our analysis, the CXCR4 gene. K-means group 7 was char-acterized by genes that were repressed uniquely late during the transition from early proliferating B cells to LCLs. This group was enriched for genes associated with B-cell immunity, cell motion, the induction of apoptosis, and cytokine receptors. The genes in these groups included those encoding TGFBR2, NOTCH2, and FCRL1, -2, and -3. K-means group 8 included genes that were initially repressed and then induced from proliferating cells to LCLs. Interestingly, these genes were highly enriched for those involved in inflammation due to chemokines and cytokines. Fur-thermore, among the genes present in this group were those for NFKB2 and STAT3, which regulate chemokine and cytokine ex-pression and signaling.
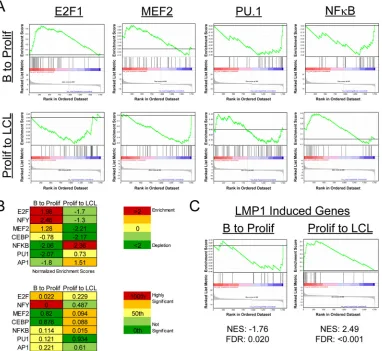
Transcriptional regulation during EBV immortalization. We next sought to define the transcriptional regulatory elements that controlled the dynamic mRNA expression changes that we observed from early EBV-induced proliferation through immor-talization. Therefore, we used gene set enrichment analysis (GSEA) to define the transcription factor binding sites that were enriched or depleted in the upstream regions of genes changing through EBV-driven B-cell outgrowth. Enrichment or depletion is shown by a normalized enrichment score (NES), which is cal-culated by the degree to which a gene set is overrepresented at the extremes of a ranked list of genes and then normalized to the gene set size (52). NES are also reported with false discovery rate (FDR) values that represent the possibility that a given NES is a false-positive finding (52). Considering first the transition from resting B cells to early proliferating cells (B to Prolif), we observed a strong enrichment in S-phase-inducing transcription factors such as E2F1 (Fig. 3AandB). Upregulated genes containing binding sites for NF-Y were also significantly enriched in the B-to-Prolif tran-sition set. Concurrently, a significant depletion of genes contain-ing consensus upstream NF-B, PU.1, and AP1 elements was ob-served in the B-to-Prolif data set (Fig. 3AandB).
Genes changing in the transition from Prolif cells to LCLs were regulated differently from those from the B-to-Prolif transition. For example, genes containing targets of the lytic gene Zta-induc-ing transcription factors CEBP and MEF2 were strongly and sig-nificantly depleted from the Prolif-to-LCL transition (Fig. 3Aand
B). Consistent with attenuation of the B-cell proliferation rate (35), E2F1 targets were strongly downregulated from the Prolif-to-LCL data set. Finally, consistent with our GO analysis of K-means clustering data, NF-B targets were robustly and signifi-cantly upregulated in this later phase of transformation. Furthermore, GSEA analysis indicated that a known set of
LMP1-TABLE 1Summary of gene ontology analysis results
Group Pathwaya Pvalue
1, 2 Cell cycle (P, BP) 4.4⫻10⫺4
p53 pathway (P) 1.5⫻10⫺3
Mitosis (BP) 8.7⫻10⫺6
Cytokinesis (BP) 1.1⫻10⫺3
Response to stress (BP) 2.9⫻10⫺3
Kinase activity (MF) 5.0⫻10⫺6
Oxidoreductase activity (MF) 7.5⫻10⫺3
3, 4 Cell cycle (BP) 6.2⫻10⫺9
Chromosome segregation (BP) 7.2⫻10⫺9
Mitosis (BP) 8.1⫻10⫺6
Cytokinesis (BP) 3.7⫻10⫺4
DNA helicase activity (MF) 1.3⫻10⫺5
Microtubule motor activity (MF) 2.0⫻10⫺5
Microtubule cytoskeleton (PC) 8.0⫻10⫺4
DNA binding protein (PC) 1.6⫻10⫺6
5 Signal transduction (BP) 2.0⫻10⫺8
Negative regulation of apoptosis (BP) 5.1⫻10⫺3
Cell adhesion (BP) 5.2⫻10⫺3
Receptor binding (MF) 6.2⫻10⫺7
Structural constituent cytoskeleton (MF) 3.8⫻10⫺3
Cytoskeleton protein binding (MF) 2.7⫻10⫺2
Actin cytoskeleton (CC) 4.5⫻10⫺3
Extracellular matrix (CC) 1.2⫻10⫺2
Phospholipase (PC) 1.7⫻10⫺4
6 Apoptosis (BP) 6.9⫻10⫺3
Transcription factor activity (MF) 6.6⫻10⫺4
DNA binding (MF) 3.0⫻10⫺3
Receptor binding (MF) 9.4⫻10⫺2
Transcription factor (PC) 9.2⫻10⫺4
7 B-cell-mediated immunity (BP) 7.6⫻10⫺4
Cell motion (BP) 1.7⫻10⫺3
Induction of apoptosis (BP) 1.6⫻10⫺2
Signal transduction (BP) 1.1⫻10⫺2
GEF activity (MF) 4.7⫻10⫺4
Cytokine receptor (PC) 2.3⫻10⫺3
Kinase (PC) 5.2⫻10⫺3
8 Inflammation—chemokine/cytokine (P) 3.2⫻10⫺4
Response to stress (BP) 5.0⫻10⫺3
aP, pathways; BP, biological processes; MF, molecular functions; CC, cellular
component; PC, protein class.
on November 7, 2019 by guest
http://jvi.asm.org/
[image:5.585.40.287.80.522.2]induced genes (6) was also initially depleted and then significantly enriched from Prolif cells to LCLs (Fig. 3C).
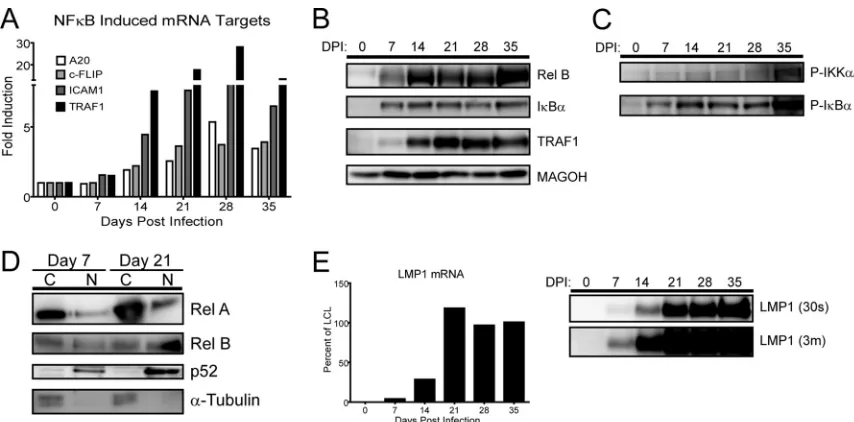
NF-B targets are not induced until high levels of LMP1 mRNA and protein are detected in infected lymphoblasts.The induction of NF-B- and LMP1-regulated genes at late times dur-ing EBV-driven B-cell outgrowth was unexpected. Therefore, we validated our microarray results by using quantitative RT-PCR, Western blotting, and activation analysis of the NF-B pathway during a time course experiment following primary B-cell infec-tion with EBV. First, we confirmed that mRNA inducinfec-tion of the NF-B targets A20, c-FLIP, ICAM1, and TRAF1 occurred after the first week following EBV infection (Fig. 4A). Western analysis of RelB, IB␣, and TRAF1 corroborated the delayed NF-B mRNA target induction (Fig. 4B).
NF-B target gene activation in LCLs is dependent on LMP1 signaling and proceeds through activation of the IB kinase com-plex, phosphorylation and ubiquitin-dependent degradation of IB family members, and NF-B nuclear translocation (6,30). To corroborate the gene expression changes we observed at late times
following infection, we analyzed the activating phosphorylation of IKK␣/, degradation-inducing phosphorylation of IB␣, and nu-clear translocation of p65/RelA, RelB, and processed NF-B2/p52. Consistent with our gene expression data, each of these activities increased significantly from day 7 postinfection to day 21 postin-fection (Fig. 4CandD). Finally, we observed that the steady-state LMP1 mRNA and protein levels were induced to near LCL levels only after approximately 14 to 21 days postinfection (Fig. 4E). These data suggest that the delay in NF-B activation was likely due to the delay in LMP1 protein expression following primary B-cell infection.
Rescuing NF-B activity specifically favors growth of early proliferating cells.The lag in NF-B activity in early EBV-in-fected proliferating B cells prompted us to ask whether heterolo-gous activation of NF-B would rescue EBV-induced prolifera-tion or transformaprolifera-tion efficiency. It is anecdotally known that EBV-infected B cells grow out at a higher frequency in the pres-ence of CD40 ligand (CD40L)-expressing feeder cells. However, we wondered whether this result was strictly dependent on the
FIG 3Gene set enrichment analysis reveals differential transcription factor usage between early and late times postinfection. (A) GSEA of transcription factor usage (MSigDB c3) was performed on our set of genes that changed significantly (⬎2-fold) in the transitions from resting B cells to early proliferating cells (B to Prolif) and from proliferating B cells to monoclonal LCLs (Prolif to LCL). Enrichment plots for E2F1, MEF2, PU.1, and the GGGNNTTTCC consensus site for NF-B are shown. (B) (Top) NES for each transcription factor for B to Prolif as well as Prolif to LCL. (Bottom) False discovery rateQvalues (FDRQvalues) for the plots. (C) A set of LMP1-induced genes was constructed based on previously published data (6), and GSEA was performed on the previously mentioned gene sets. LMP1-induced genes were repressed early after infection (B to Prolif) and enriched later (Prolif to LCL). NES and FDRQvalues are shown beneath the plots.
on November 7, 2019 by guest
http://jvi.asm.org/
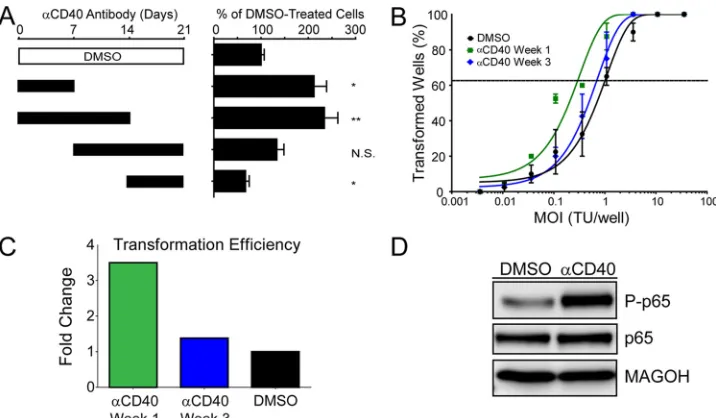
[image:6.585.105.487.68.419.2]time frame within which the EBV-infected blasts must be exposed to this heterologous NF-B activating signal. We specifically asked whether EBV-induced B-cell outgrowth would be affected by CD40 activation by using the agonistic antibody G28-5 during 1-or 2-week intervals following EBV infection of primary B cells. As shown inFig. 5A, when the G28-5 CD40 antibody was present only during the first week after EBV infection, the number of proliferating B cells at 21 days was double that if the antibody was not present. A similar result was obtained if the antibody was pres-ent during the first 2 weeks. However, if the antibody was prespres-ent only during the third week or during the second and third weeks following B-cell infection, then no increase in EBV-driven B-cell proliferation was observed (Fig. 5A). Since the proliferation assay was performed at 21 days postinfection, close to the time point of the late G28-5 additions, we also performed transformation assays (5-week outgrowth with a limiting dilution of virus). Indeed, the efficiency of B-cell transformation was increased approximately 4-fold if G28-5 was present during the first week after infection, whereas no increase was observed if G28-5 was present during the third week after infection (Fig. 5BandC). Importantly, the G28-5 antibody activated the NF-B pathway in LCLs, as indicated by the IKK-dependent phosphorylation of the NF-B transcription factor subunit p65 at serine 536 (Fig. 5D) (33,39).
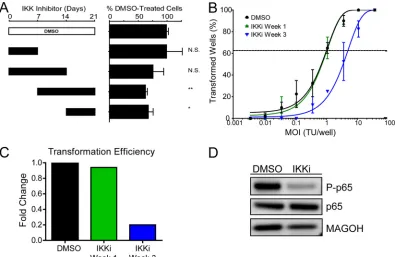
Early EBV-infected proliferating cells are less NF-B depen-dent than later proliferating cells and LCLs.The dependence of EBV-transformed cells on NF-B for survival is firmly established (6,23). However, the point after EBV infection when B cells be-come sensitive to NF-B inhibition has not been established. Given our gene expression data, we hypothesized that early pro-liferating B cells during the first week following infection would be
significantly less sensitive to NF-B inhibition than infected cells at 3 weeks postinfection, when LMP1 is expressed at high levels, along with many NF-B targets. Therefore, we performed exper-iments similar to those described above for CD40 agonism, but using a specific inhibitor of the IKKsubunit of the IKK complex. EBV-induced B-cell proliferation at 21 days postinfection was un-changed upon IKK inhibition during week 1 after infection only
(Fig. 6A). In contrast, cells inhibited at weeks 2 and 3 or only
during week 3 showed significantly impaired outgrowth. Consis-tently, EBV transformation was reduced 5-fold if IKKwas inhib-ited during week 3 only, whereas inhibition during week 1 had no impact on transformation (Fig. 6BandC). Inhibiting the IKK complex in LCLs reduces NF-B activity, as shown by a decrease in the phosphorylated form of the NF-B transcription factor p65
(Fig. 6D). Therefore, the temporal delay in expression of LMP1
and NF-B target genes results in a period during which EBV-infected proliferating B cells are insensitive to IKK inhibition.
DISCUSSION
In this report, we have comprehensively analyzed the changes in cellular mRNA transcript abundance between primary human resting CD19⫹B cells, EBV-infected early hyperproliferating B blasts, and EBV-immortalized LCLs. Early studies of EBV-regu-lated gene expression changes identified the induction of E2F fam-ily members and the phosphorylation of pocket proteins enabling E2F-mediated transcription and S-phase induction within the first few days postinfection (8,18,43,47). The induction of B-cell activation markers at early times after infection has also been re-ported (15,42). Here we extended these studies to transcriptome-wide analysis and found substantially more dynamic regulation of
FIG 4NF-B targets and activity, as well as LMP1, are not induced until late after EBV infection. (A) qRT-PCR analysis of NF-B-targeted genes relative to resting B-cell levels. RNA was isolated from EBV-infected B cells every 7 days for 35 days postinfection. Data are representative of four experiments. (B) Western blot of NF-B-targeted proteins. Protein was isolated from EBV-infected B cells every 7 days for 35 days postinfection. MAGOH is a ubiquitously expressed splicing factor that was used as a loading control because it does not significantly change at the mRNA or protein level during EBV infection of primary B cells. (C) Western blots depict the activity of the NF-B pathway through phospho-specific Western blotting of IB␣and IKK␣/following primary B-cell infection. (D) Western blots depicting the activity of both canonical and noncanonical NF-B pathways by showing nuclear (N) versus cytoplasmic (C) distributions of RelA, RelB, and p52.␣-Tubulin is the loading and fractionation control. (E) LMP1 does not accumulate to LCL levels until 21 days postinfection. (Left) qRT-PCR analysis of the LMP1 mRNA transcript, normalized to the day 35 level as 100% of the LCL level. Data are representative of four experiments. (Right) Western blot showing LMP1 protein levels (S12 antibody, 30-s exposure). An overexposed blot (3m⫽3 min) is provided to show that while the LMP1 protein was detected as early as 7 days postinfection, it was detectable only as a fraction of LCL LMP1 protein levels.
on November 7, 2019 by guest
http://jvi.asm.org/
[image:7.585.76.503.64.275.2]host gene expression from 6 days to 35 days postinfection than was previously appreciated. Genes activated early after infection were enriched for those with E2F1 and NF-Y binding sites in their pro-moters and depleted for those with PU.1, AP1, and NF-B sites. At late times after infection, genes with MEF2 and CEBP sites were depleted, while NF-B targets were strongly enriched. Surpris-ingly, the LMP1-mediated NF-B signaling pathway was not in-duced robustly until approximately 2 weeks postinfection. Con-sistently, early EBV-infected blasts were not sensitive to NF-B inhibition, and heterologous NF-B activation through CD40 agonism increased the transformation efficiency.
Gene ontology categories associated with the dynamic gene expression changes confirmed and extended previous observa-tions. As expected, proliferation- and DNA damage-responsive genes were highly induced early after infection and then attenu-ated during B-cell outgrowth (35). E2F1 and NF-Y targets were robustly induced early, consistent with induction of S phase and with reports that NF-Y contributes to upregulation of the EBV latency C promoter, respectively (5). At later times, the observed repression of MEF2 and CEBP targets is consistent with suppres-sion of the lytic Zta gene promoter and tight control of viral la-tency during B-cell outgrowth (28,60). Finally, and most surpris-ingly, was the delay in LMP1-regulated gene expression that occurred during the transition from early proliferating cells to LCLs. This late transition to LCLs was characterized by an enrich-ment in genes associated with the IB kinase cascade, actin cyto-skeleton dynamics, inhibition of apoptosis, and a strong upregu-lation of NF-B targets.
Several hypotheses may account for the delay in NF-B activ-ity. First, in our GSEA analysis of transcription factors regulated in
the transitions from B cells to Prolif cells and from Prolif cells to LCLs, we identified PU.1/SPI1 targets as being depleted early and then not changing significantly at later times after infection. PU.1 is a critical transcription factor targeted by EBNA2 on the LMP1 promoter (19). Therefore, it is conceivable that genome-wide PU.1 activity is a proxy for LMP1 promoter activity, indicating that the promoter may not be activated sufficiently early after infection to drive LMP1 expression. At later times, other cofactors may be increased in expression or activity, cooperating with PU.1 to drive LMP1 expression.
An alternative to this hypothesis relates to the high-level c-Myc activity found in early hyperproliferating cells (35), which may directly attenuate NF-B activity, and consequently LMP1 levels, through inhibition of an LMP1/NF-B feed-forward loop (10,
20). This would be consistent with work indicating that high-level c-Myc expression inhibits NF-B activity and with the notion that Myc-driven tumors such as Burkitt’s lymphoma are poorly im-munogenic, due to low-level NF-B activity, compared to diffuse large B cell lymphomas (DLBCLs) or LCLs (9,12,25). Therefore, a set of c-Myc targets may be responsible in part for low LMP1 levels.
We recently identified the miRNA expression profiles of rest-ing and early proliferatrest-ing EBV-infected B cells and LCLs (13). The set of miRNAs distinctive for the early hyperproliferating cells included the c-Myc-regulated miRNA clusters miR-17⬃92, miR-106a⬃363, and miR-106b⬃25. Concurrently, in collaboration with Bryan Cullen’s group, we also recently identified the set of mRNAs bound by viral and cellular miRNAs in LCLs (46). In this study, the c-Myc-regulated miR-17 seed family was found to be a suppressor of LMP1 mRNA and protein levels. Therefore, in
FIG 5Rescuing NF-B activity specifically favors growth of early proliferating cells. (A) NF-B was activated via CD40 signaling with 1g/ml of the agonistic antibody G28-5. The antibody was present in the culture for 1- or 2-week increments, as denoted by the solid black bars, and was washed out at either 7, 14, or 21 days postinfection. After 21 days, samples were analyzed by fluorescence-activated cell sorting (FACS), and events were normalized to a known number of Sepharose beads present in the sample. Total CD19⫹CFSElow(proliferating) B cells present after 21 days were normalized to a DMSO vehicle control. Error bars
denote standard errors of the means (SEM) for eight biological replicates. Significance compared to the DMSO vehicle control was calculated by Student’sttest. N.S., not significant; *,P⬍0.01; **,P⬍0.001. (B) Quantification of EBV-induced B-cell outgrowth following PBMC infection in the presence of DMSO vehicle control (black) or the agonistic anti-CD40 antibody G28-5, present in the culture from days 0 to 7 (␣CD40 Week 1; green) or days 14 to 21 (␣CD40 Week 3; blue). Error bars are SEM for two biological replicates. (C) Transformation efficiencies for the␣CD40 Week 1 and␣CD40 Week 3 groups are shown as fold changes over the DMSO control level. (D) LCLs were treated with DMSO vehicle control or 1g/ml G28-5 antibody. Activity of the NF-B pathway is shown by the presence of the phosphorylated form of p65 (P-p65).
on November 7, 2019 by guest
http://jvi.asm.org/
[image:8.585.113.471.65.274.2]LCLs, the equilibrium of this interaction may be such that LMP1 is expressed at a high level, while it is possible that during early outgrowth, when miR-17 levels are highest, the effects on LMP1 are more profound. Therefore, we propose that LMP1 may be suppressed early after infection by the EBNA2-driven, c-Myc-reg-ulated miR-17 miRNA seed family.
It is also important that we performed all of our infections with the B95-8 strain of EBV. While this could have an effect on our overall expression profiling due to the loss of the BART miRNAs, it was recently shown that B95-8 complemented with the deleted BART miRNAs induces normal B-cell proliferation and transfor-mation (41). While it has been reported that some of the deleted BART miRNAs might target LMP1 (29,37), these interactions would have a repressive effect on LMP1 expression, and in their absence, one might expect premature LMP1 expression. Since we characterized a long delay in LMP1 expression and activity follow-ing primary B-cell infection, it is unlikely that these BART miRNA-LMP1 interactions play a significant role in this pheno-type.
One final and complementary hypothesis for the delay in LMP1 levels at early times after B-cell infection is that LMP1 mRNA stability may increase during outgrowth. Previous studies indicate that the LMP1 gene is the most poorly transcribed gene of the viral latent genes in LCLs, but its mRNA is the most abundant transcript (40). Therefore, the LMP1 mRNA is likely stabilized in LCLs, and thetrans-acting factors required for this stability
in-crease through B-cell outgrowth. Perhaps these putative factors are also suppressed by Myc-regulated miRNAs or directly by Myc. Irrespective of the mechanism by which LMP1 expression is attenuated until 2 weeks postinfection, our data raise the question of how these proliferating B cells are able to survive in the absence of high-level NF-B activity. There are two plausible explanations for this that will be intriguing to characterize in the future. First, Altmann and Hammerschmidt found that the EBV Bcl-2 ho-mologs BHRF1 and BALF1 are both required for primary B-cell transformation (2). These genes are both expressed transiently upon primary B-cell infection and are required to suppress apop-tosis. While it is unclear how these genes are regulated throughout B-cell outgrowth, their expression at early times postinfection may be required for survival in the absence of LMP1-mediated NF-B signaling.
A second and complementary hypothesis is that EBNA2-de-pendent mRNA targets may be sufficient for survival during early outgrowth (26,27). Since EBV induces a robust DDR during this early period, it is conceivable that EBNA2-mediated survival is initially more important than LMP1 effects. However, for long-term outgrowth, the trade-offs associated with the growth-sup-pressive effects of the DDR are too great, and LMP1 is then criti-cally important for survival.
The interplay between c-Myc and NF-B is important in the balance between proliferation, survival, and immunogenicity of EBV-infected cells. As described above, c-Myc and NF-B gene
FIG 6Early proliferating cells are less NF-B dependent than later proliferating cells and LCLs. (A) NF-B activity was inhibited via a small-molecule inhibitor of IKK(IKKi) (1M). The inhibitor was present in the culture for 1- or 2-week increments, as denoted by the solid black bars, and was washed out at either 7, 14, or 21 days postinfection. After 21 days, samples were analyzed by FACS, and events were normalized to a known number of Sepharose beads present in the sample. Total CD19⫹CFSElow(proliferating) B cells present after 21 days were normalized to a DMSO vehicle control. Error bars denote SEM for eight biological
replicates. Significance compared to the DMSO vehicle control was calculated by Student’sttest. N.S., not significant; *,P⬍0.05; **,P⬍0.01. (B) Quantification of EBV-induced B-cell outgrowth following PBMC infection in the presence of DMSO vehicle control (black) or the IKKsmall-molecule inhibitor IKKi, present in the culture from days 0 to 7 (IKKi Week 1; green) or days 14 to 21 (IKKi Week 3; blue). Error bars are SEM for two biological replicates. (C) Transformation efficiencies for the IKKi Week 1 and IKKi Week 3 groups are shown as fold changes over the DMSO control level. (D) LCLs were treated with DMSO vehicle control or with 1M IKKi. Activity of the NF-B pathway is shown by the presence of the phosphorylated form of p65 (P-p65).
on November 7, 2019 by guest
http://jvi.asm.org/
[image:9.585.95.490.66.323.2]expression programs are incompatible in B-cell lymphomas (9). One consequence of the c-Myc-driven gene expression program associated with low-level NF-B activation is greatly decreased immunogenicity (38,51). This is best observed in Burkitt’s lym-phoma cells, which display poor immunogenicity due to de-creased expression of major histocompatibility complex (MHC) class I molecules, antigen processing machinery, and proinflam-matory cytokines and chemokines (9). Thus, during primary B-cell infection, EBV may attenuate NF-B activity (dependent or independent of c-Myc) in order to evade the immune system, while generating many progeny latently infected cells through hy-perproliferation. In acute infection, this immune evasion could occur through suppression of proinflammatory cytokine produc-tion, while in the context of naïve B-cell infection following reac-tivation, this could be due to depressed cytotoxic T-lymphocyte (CTL) recognition of early proliferating cells. Studies of CTL re-sponses to early EBV-infected B cells compared to LCLs and of the levels of proinflammatory cytokines produced in these cells will be informative. Such future studies would support an important and novel mechanism by which EBV establishes and maintains latency in the host.
ACKNOWLEDGMENTS
We thank the Duke Cancer Institute Flow Cytometry Core Facility for help on this project (specifically Mike Cook, Nancy Martin, and Lynn Martinek). We thank Elliott Kieff (Harvard Medical School) for the G28-5 (anti-CD40) hybridoma and Thomas Tedder (Duke University) for the 33-6-6 (anti-CD19) hybridoma. Also, we thank Neel Mukherjee as well as members of the Luftig laboratory for their helpful comments and discus-sions.
This work was supported by pilot grants to M.A.L. from Golfers Against Cancer, the American Cancer Society, and the Duke CFAR, an NIH-funded program (5P30 AI064518), as well as by NIH grant 1R01-CA140337. A.M.P. was supported by NIH grant 5T32CA009111, and J.P.T. was supported by a SMART fellowship from the Department of Defense.
REFERENCES
1.Alfieri C, Birkenbach M, Kieff E.1991. Early events in Epstein-Barr virus infection of human B lymphocytes. Virology181:595– 608.
2.Altmann M, Hammerschmidt W.2005. Epstein-Barr virus provides a new paradigm: a requirement for the immediate inhibition of apoptosis. PLoS Biol.3:e404. doi:10.1371/journal.pbio.0030404.
3.Altmann M, et al.2006. Transcriptional activation by EBV nuclear anti-gen 1 is essential for the expression of EBV’s transforming anti-genes. Proc. Natl. Acad. Sci. U. S. A.103:14188 –14193.
4.Anderton E, et al.2008. Two Epstein-Barr virus (EBV) oncoproteins cooperate to repress expression of the proapoptotic tumour-suppressor Bim: clues to the pathogenesis of Burkitt’s lymphoma. Oncogene27:421– 433.
5.Borestrom C, Zetterberg H, Liff K, Rymo L.2003. Functional interac-tion of nuclear factor y and sp1 is required for activainterac-tion of the Epstein-Barr virus C promoter. J. Virol.77:821– 829.
6.Cahir-McFarland ED, et al.2004. Role of NF-kappa B in cell survival and transcription of latent membrane protein 1-expressing or Epstein-Barr virus latency III-infected cells. J. Virol.78:4108 – 4119.
7.Calderwood MA, Johannsen E.2010. Chapter 6: molecular profiles of EBV latently infected cells, p 101–116.InRobertson ES (ed), Epstein-Barr virus: latency and transformation, vol 1. Caister Academic Press, Norwich, Norfolk, United Kingdom.
8.Cannell EJ, Farrell PJ, Sinclair AJ.1996. Epstein-Barr virus exploits the normal cell pathway to regulate Rb activity during the immortalisation of primary B-cells. Oncogene13:1413–1421.
9.Dave SS, et al.2006. Molecular diagnosis of Burkitt’s lymphoma. N. Engl. J. Med.354:2431–2442.
10. Demetriades C, Mosialos G.2009. The LMP1 promoter can be transac-tivated directly by NF-kappaB. J. Virol.83:5269 –5277.
11. Eliopoulos AG, Gallagher NJ, Blake SM, Dawson CW, Young LS.1999. Activation of the p38 mitogen-activated protein kinase pathway by Epstein-Barr virus-encoded latent membrane protein 1 coregulates inter-leukin-6 and interleukin-8 production. J. Biol. Chem.274:16085–16096. 12. Faumont N, et al.2009. c-Myc and Rel/NF-kappaB are the two master transcriptional systems activated in the latency III program of Epstein-Barr virus-immortalized B cells. J. Virol.83:5014 –5027.
13. Forte E, et al.2012. The Epstein-Barr virus (EBV)-induced tumor sup-pressor microRNA MiR-34a is growth promoting in EBV-infected B cells. J. Virol.86:6889 – 6898.
14. Grossman SR, Johannsen E, Tong X, Yalamanchili R, Kieff E.1994. The Epstein-Barr virus nuclear antigen 2 transactivator is directed to response elements by the J kappa recombination signal binding protein. Proc. Natl. Acad. Sci. U. S. A.91:7568 –7572.
15. Halder S, et al.2009. Early events associated with infection of Epstein-Barr virus infection of primary B-cells. PLoS One4:e7214. doi:10.1371/ journal.pone.0007214.
16. Henderson E, Miller G, Robinson J, Heston L. 1977. Efficiency of transformation of lymphocytes by Epstein-Barr virus. Virology76:152– 163.
17. Henkel T, Ling PD, Hayward SD, Peterson MG.1994. Mediation of Epstein-Barr virus EBNA2 transactivation by recombination signal-binding protein J kappa. Science265:92–95.
18. Hollyoake M, Stuhler A, Farrell P, Gordon J, Sinclair A. 1995. The normal cell cycle activation program is exploited during the infection of quiescent B lymphocytes by Epstein-Barr virus. Cancer Res.55:4784 – 4787.
19. Johannsen E, et al.1995. Epstein-Barr virus nuclear protein 2 transacti-vation of the latent membrane protein 1 promoter is mediated by J kappa and PU.1. J. Virol.69:253–262.
20. Johansson P, Jansson A, Ruetschi U, Rymo L.2009. Nuclear factor-kappaB binds to the Epstein-Barr Virus LMP1 promoter and upregulates its expression. J. Virol.83:1393–1401.
21. Kaiser C, et al.1999. The proto-oncogene c-myc is a direct target gene of Epstein-Barr virus nuclear antigen 2. J. Virol.73:4481– 4484.
22. Kalla M, Hammerschmidt W.2012. Human B cells on their route to latent infection— early but transient expression of lytic genes of Epstein-Barr virus. Eur. J. Cell Biol.91:65– 69.
23. Keller SA, Schattner EJ, Cesarman E.2000. Inhibition of NF-kappaB induces apoptosis of KSHV-infected primary effusion lymphoma cells. Blood96:2537–2542.
24. Kieff E, Rickinson A. 2007. Epstein-Barr virus and its replication, p 2603–2654.InKnipe DM, et al (ed), Fields virology, 5th ed. Lippincott Williams & Wilkins, Philadelphia, PA.
25. Klapproth K, Sander S, Marinkovic D, Baumann B, Wirth T.2009. The IKK2/NF-{kappa}B pathway suppresses MYC-induced lymphomagen-esis. Blood114:2448 –2458.
26. Lee JM, et al.2004. EBNA2 is required for protection of latently Epstein-Barr virus-infected B cells against specific apoptotic stimuli. J. Virol.78: 12694 –12697.
27. Lee JM, Lee KH, Weidner M, Osborne BA, Hayward SD.2002. Epstein-Barr virus EBNA2 blocks Nur77-mediated apoptosis. Proc. Natl. Acad. Sci. U. S. A.99:11878 –11883.
28. Liu S, Liu P, Borras A, Chatila T, Speck SH.1997. Cyclosporin A-sen-sitive induction of the Epstein-Barr virus lytic switch is mediated via a novel pathway involving a MEF2 family member. EMBO J.16:143–153. 29. Lo AK, et al.2007. Modulation of LMP1 protein expression by
EBV-encoded microRNAs. Proc. Natl. Acad. Sci. U. S. A.104:16164 –16169. 30. Luftig M, et al. 2003. Epstein-Barr virus latent membrane protein 1
activation of NF-kappaB through IRAK1 and TRAF6. Proc. Natl. Acad. Sci. U. S. A.100:15595–15600.
31. Maier S, et al.2006. Cellular target genes of Epstein-Barr virus nuclear antigen 2. J. Virol.80:9761–9771.
32. Maruo S, et al.2011. Epstein-Barr virus nuclear antigens 3C and 3A maintain lymphoblastoid cell growth by repressing p16INK4A and p14ARF expression. Proc. Natl. Acad. Sci. U. S. A.108:1919 –1924. 33. Mattioli I, et al.2004. Transient and selective NF-kappa B p65 serine 536
phosphorylation induced by T cell costimulation is mediated by I kappa B kinase beta and controls the kinetics of p65 nuclear import. J. Immunol.
172:6336 – 6344.
34. Mi H, Guo N, Kejariwal A, Thomas PD.2007. PANTHER version 6:
on November 7, 2019 by guest
http://jvi.asm.org/
protein sequence and function evolution data with expanded representa-tion of biological pathways. Nucleic Acids Res.35:D247–D252. 35. Nikitin PA, et al. 2010. An ATM/Chk2-mediated DNA
damage-responsive signaling pathway suppresses Epstein-Barr virus transforma-tion of primary human B cells. Cell Host Microbe8:510 –522.
36. Reich M, et al.2006. GenePattern 2.0. Nat. Genet.38:500 –501. 37. Riley KJ, et al.2012. EBV and human microRNAs co-target oncogenic
and apoptotic viral and human genes during latency. EMBO J.31:2207– 2221.
38. Rowe M, et al.1995. Restoration of endogenous antigen processing in Burkitt’s lymphoma cells by Epstein-Barr virus latent membrane pro-tein-1: coordinate up-regulation of peptide transporters and HLA-class I antigen expression. Eur. J. Immunol.25:1374 –1384.
39. Sakurai H, Chiba H, Miyoshi H, Sugita T, Toriumi W.1999. IkappaB kinases phosphorylate NF-kappaB p65 subunit on serine 536 in the trans-activation domain. J. Biol. Chem.274:30353–30356.
40. Sample J, Kieff E.1990. Transcription of the Epstein-Barr virus genome during latency in growth-transformed lymphocytes. J. Virol.64:1667– 1674.
41. Seto E, et al.2010. Micro RNAs of Epstein-Barr virus promote cell cycle progression and prevent apoptosis of primary human B cells. PLoS Pat-hog.6:e1001063. doi:10.1371/journal.ppat.1001063.
42. Shannon-Lowe C, et al.2005. Epstein-Barr virus-induced B-cell trans-formation: quantitating events from virus binding to cell outgrowth. J. Gen. Virol.86:3009 –3019.
43. Sinclair AJ, Palmero I, Peters G, Farrell PJ.1994. EBNA-2 and EBNA-LP cooperate to cause G0 to G1 transition during immortalization of resting human B lymphocytes by Epstein-Barr virus. EMBO J.13:3321–3328. 44. Sjoblom A, Nerstedt A, Jansson A, Rymo L. 1995. Domains of the
Epstein-Barr virus nuclear antigen 2 (EBNA2) involved in the transacti-vation of the latent membrane protein 1 and the EBNA Cp promoters. J. Gen. Virol.76:2669 –2678.
45. Skalska L, White RE, Franz M, Ruhmann M, Allday MJ.2010. Epige-netic repression of p16(INK4A) by latent Epstein-Barr virus requires the interaction of EBNA3A and EBNA3C with CtBP. PLoS Pathog.
6:e1000951. doi:10.1371/journal.ppat.1000951.
46. Skalsky RL, et al.2012. The viral and cellular microRNA targetome in lymphoblastoid cell lines. PLoS Pathog. 8:e1002484. doi:10.1371/ journal.ppat.1002484.
47. Spender LC, et al.1999. Control of cell cycle entry and apoptosis in B lymphocytes infected by Epstein-Barr virus. J. Virol.73:4678 – 4688. 48. Spender LC, Cornish GH, Rowland B, Kempkes B, Farrell PJ.2001.
Direct and indirect regulation of cytokine and cell cycle proteins by EBNA-2 during Epstein-Barr virus infection. J. Virol.75:3537–3546. 49. Spender LC, Cornish GH, Sullivan A, Farrell PJ.2002. Expression of
transcription factor AML-2 (RUNX3, CBF(alpha)-3) is induced by Ep-stein-Barr virus EBNA-2 and correlates with the B-cell activation pheno-type. J. Virol.76:4919 – 4927.
50. Spender LC, et al.2006. Cell target genes of Epstein-Barr virus
transcrip-tion factor EBNA-2: inductranscrip-tion of the p55alpha regulatory subunit of PI3-kinase and its role in survival of EREB2.5 cells. J. Gen. Virol.87:2859 – 2867.
51. Staege MS, et al.2002. MYC overexpression imposes a nonimmunogenic phenotype on Epstein-Barr virus-infected B cells. Proc. Natl. Acad. Sci. U. S. A.99:4550 – 4555.
52. Subramanian A, et al.2005. Gene set enrichment analysis: a knowledge-based approach for interpreting genome-wide expression profiles. Proc. Natl. Acad. Sci. U. S. A.102:15545–15550.
53. Tierney RJ, et al.2000. Methylation of transcription factor binding sites in the Epstein-Barr virus latent cycle promoter Wp coincides with pro-moter down-regulation during virus-induced B-cell transformation. J. Vi-rol.74:10468 –10479.
54. Tsang SF, Wang F, Izumi KM, Kieff E.1991. Delineation of thecis-acting element mediating EBNA-2 transactivation of latent infection membrane protein expression. J. Virol.65:6765– 6771.
55. Tusher VG, Tibshirani R, Chu G.2001. Significance analysis of microar-rays applied to the ionizing radiation response. Proc. Natl. Acad. Sci. U. S. A.98:5116 –5121.
56. Wang F, Tsang SF, Kurilla MG, Cohen JI, Kieff E.1990. Epstein-Barr virus nuclear antigen 2 transactivates latent membrane protein LMP1. J. Virol.64:3407–3416.
57. White RE, et al.2010. Extensive co-operation between the Epstein-Barr virus EBNA3 proteins in the manipulation of host gene expression and epigenetic chromatin modification. PLoS One5:e13979. doi:10.1371/ journal.pone.0013979.
58. Woisetschlaeger M, et al.1991. Role for the Epstein-Barr virus nuclear antigen 2 in viral promoter switching during initial stages of infection. Proc. Natl. Acad. Sci. U. S. A.88:3942–3946.
59. Woisetschlaeger M, Yandava CN, Furmanski LA, Strominger JL, Speck SH.1990. Promoter switching in Epstein-Barr virus during the initial stages of infection of B lymphocytes. Proc. Natl. Acad. Sci. U. S. A.87: 1725–1729.
60. Wu FY, et al.2004. CCAAT/enhancer binding protein alpha binds to the Epstein-Barr virus (EBV) ZTA protein through oligomeric interactions and contributes to cooperative transcriptional activation of the ZTA pro-moter through direct binding to the ZII and ZIIIB motifs during induction of the EBV lytic cycle. J. Virol.78:4847– 4865.
61. Xing L, Kieff E.2007. Epstein-Barr virus BHRF1 micro- and stable RNAs during latency III and after induction of replication. J. Virol.81:9967– 9975.
62. Zhao B, et al.2011. Epstein-Barr virus nuclear antigen 3C regulated genes in lymphoblastoid cell lines. Proc. Natl. Acad. Sci. U. S. A.108:337–342. 63. Zhao B, et al.2006. RNAs induced by Epstein-Barr virus nuclear antigen
2 in lymphoblastoid cell lines. Proc. Natl. Acad. Sci. U. S. A.103:1900 – 1905.
64. Zhao B, et al.2011. Epstein-Barr virus exploits intrinsic B-lymphocyte transcription programs to achieve immortal cell growth. Proc. Natl. Acad. Sci. U. S. A.108:14902–14907.