R E S E A R C H A R T I C L E
Open Access
Time series analysis of demographic and
temporal trends of tuberculosis in Singapore
Win Wah
1†, Sourav Das
1†, Arul Earnest
2, Leo Kang Yang Lim
3, Cynthia Bin Eng Chee
3, Alex Richard Cook
1,
Yee Tang Wang
3, Khin Mar Kyi Win
3, Marcus Eng Hock Ong
4and Li Yang Hsu
1*Abstract
Background:Singapore is an intermediate tuberculosis (TB) incidence country, with a recent rise in TB incidence from 2008, after a fall in incidence since 1998. This study identified population characteristics that were associated with the recent increase in TB cases, and built a predictive model of TB risk in Singapore.
Methods:Retrospective time series analysis was used to study TB notification data collected from 1995 to 2011 from the Singapore Tuberculosis Elimination Program (STEP) registry. A predictive model was developed based on the data collected from 1995 to 2010 and validated using the data collected in 2011.
Results:There was a significant difference in demographic characteristics between resident and non-resident TB cases. TB risk was higher in non-residents than in residents throughout the period. We found no significant association between demographic and macro-economic factors and annual incidence of TB with or without adjusting for the population-at-risk. Despite growing non-resident population, there was a significant decrease in the non-resident TB risk (p< 0.0001). However, there was no evidence of trend in the resident TB risk over this time period, though differences between different demographic groups were apparent with ethnic minorities experiencing higher incidence rates. Conclusion:The study found that despite an increasing size of non-resident population, TB risk among non-residents was decreasing at a rate of about 3% per year. There was an apparent seasonality in the TB reporting.
Keywords:Time-series analysis, Tuberculosis
Background
Tuberculosis (TB) is a leading cause of death globally [1]. Approximately 5% of those infected progress to ac-tive disease within the first two years, but the majority experience a state of prolonged latency with a life-time risk of 10-15% eventually progressing to active disease [2]. The risk of progression is affected by immune status and is much higher among immune-compromised indi-viduals [2]. The situation is complicated further by the spread of multidrug-resistant (MDR) TB [3], a particular problem in South East Asia.
Since the World Health Organization (WHO) declared TB to be a global health emergency in 1993 [4], there has been a substantial progress on many indicators [3].
The most significant achievement was that global TB mortality reduced by 45% in 2012 [3]. However, the rate of decrease of global TB incidence (2% per annum) re-mains quite low [3]. In this context, the study of TB prevalence in Singapore is important for the following two reasons. As an economically developed city state (GDP per capita $52,000) [5], Singapore, lies on an im-portant maritime transit route, is a transit hub for travel in Asia and Asia-Pacific and a significant global destin-ation of investment and labour. However, it is also a part of the region that accounts for 29% of global TB inci-dence [3]. Contrasting the global trends of most devel-oped nations, Singapore has witnessed a resurgence of TB incidence since 2008.
TB incidence rates among Singapore residents declined from 300 (per 100,000 population) in the early 1960s to 106 (per 100,000 population) in the mid-1980s [6,7]. In 1997, the Singapore Tuberculosis Elimination Programme (STEP) was launched to address a decade-long stagnation * Correspondence:[email protected]
†Equal contributors
1Centre for Infectious Disease Epidemiology & Research, Saw Swee Hock
School of Public Health, National University of Singapore and NUHS, Singapore, Singapore
Full list of author information is available at the end of the article
in TB rates at 50–55 (per 100,000 population) between 1987 to 1997. Thereafter, TB incidence rates among Singapore residents declined from 58 (per 100,000 tion) in 1998 to an historic low of 35 (per 100,000 popula-tion) in 2006 and 2007. However, the TB incidence rates began to rise around 39 per 100,000 population since 2008. The reasons for this surge remain unclear since there has been no association study on the influence of the demographic characteristics on TB in Singapore.
In this research, our aim was to assess temporal dy-namics in TB incidence in Singapore at both short (monthly) and large (annual) scales, and to investigate the association of several population level demographic factors with annual TB incidence. For the annual ana-lysis. the primary methodology we used was the standard autoregressive integrated moving average (ARIMA) re-gression model [8]. Additionally, using monthly data from 1995–2011, we assessed whether the burgeoning non-resident population led to an increase in TB risk in Singapore. We proposed using the seasonal autoregres-sive moving average (SARIMA), ARIMA models with periodic components, to predict the temporal trends of the more volatile monthly TB risk among residents and non-residents in Singapore and detect seasonality.
Methods Study setting
Singapore is a city-state in the middle of the Malay ar-chipelago approximately 100 Km from the equator. Its population of 5.3 million (2013) has grown rapidly over the last decade due to the influx of foreigners who now constitute approximately 28% of the total population, comprising 3.8 million residents (citizens and permanent residents) and 1.5 million non-residents (i.e. those who hold long-term visit or work passes) [5]. The proportion of the latter group has increased markedly since 2005, with most migrants coming from South and East Asian countries.
Data
This study retrospectively analyzed all newly laboratory-confirmed TB cases reported to Singapore Tuberculosis Elimination Program (STEP) registry from 1995 to 2011. Laboratory confirmation was based on positiveM.
tuber-culosis culture. Under the Infectious Disease Act in Singapore, all suspected and confirmed TB cases are to be notified to the STEP registry of the TB Control Unit (TBCU) within 72 hours of starting TB treatment and/ or laboratory confirmed results. The TBCU is the na-tional unit for treatment of TB patients, contact investi-gation, preventive therapy, and educational training of health care workers in Singapore.
Population data were obtained from Singapore Depart-ment of Statistics and Ministry of Health [9,10].
Statistics and analysis
Annual TB cases analysis: 1995–2011
We fitted time series (ARIMA) regression models for the yearly time series counts of TB cases to establish whether a relationship exists between population charac-teristics and yearly TB cases over time. We used the standard Box Jenkins approach [11] to fit the ARIMA models, characterized by 3 main parameters: an autore-gressive (AR) term, indicating the strength of
relation-ship between successive years’ incidence, a moving
average (MA) term, that checks for the dependence of yearly incidence on current and past model residuals, and a differencing term, that is usually applied to make the data stationary, when the time series has a long term trend [11]. Further as the annual TB time series exhib-ited change of variance over the time horizon, yearly no-tifications were log transformed, which had the effect of standardizing the scale of the error terms.
Following stand and procedure, sample autocorrelation (ACF) and partial autocorrelation function (PACF) plots were used to identify the order of the MA and AR terms included in the ARIMA model [12,13]. Specifically, if we observe statistically significant autocorrelation in the sample ACF plot at q time lags and significant sample
PACF at plags then, an ARIMA model withp-AR
com-ponents and q-MA components is proposed. The final
model (order) selection is made using a combination of
goodness of fit and Akaike’s Information Criterion
(AIC). Here we the determined the goodness of fit using the residual autocorrelation function to ensure that no additional autocorrelation was present in each fitted model, and models were compared using Akaike’s Infor-mation Criterion (AIC). The model with the lowest value of the AIC was selected to analyze yearly TB cases. We developed separate univariate models, each encompass-ing a different lag period controllencompass-ing the effect of poten-tial predictor (from lag 0, that is the current year, to the immediate preceding 4 years). Population variables in-cluded numbers of visitors’arrivals, the sizes of the eld-erly population, the non-resident population, and the resident population broken down by ethnicity (Chinese, Indian, Malay and Other ethnicity), Gross Domestic Product (GDP) rates, population density and HIV notifi-cation rates. Population density was the mid-year popu-lation estimate divided by the country’s area (square kilometers) which grew during the study period due to land reclamation. We also adjusted for the population-at-risk (resident or non-resident population) as the denomin-ator for demographic variables that did not already account for them, such as GDP, HIV notifications and visi-tor’s arrivals.
of standardization, all age-standardized incidence rates were derived by applying the category-specific incidence rates of each population to the standard world population [14].
Monthly TB risk analysis: 1996–2011
The limitation of the above annual analysis is that the available length of annual time series is small and so the analysis is underpowered we therefore supplement it with a shorter, monthly time step. However we have suf-ficient monthly temporal observations. In this section we describe the method used to investigate monthly temporal risk of TB.
The TB risk among resident or non-resident popula-tion was defined as Yt= (ct/nt) × 100 000, where ct de-notes the monthly count of TB reported cases (residents or non-residents) and ntis assumed to be population-at-risk (number of resident or non-resident population) in montht. This definition takes into account the dynamics of the population size in explaining TB incidence. Popula-tion figures were derived from annual populaPopula-tion data [5].
To investigate the monthly time series of TB risk we use classical time series decomposition [11] that is conceptually,
Response Yð Þ ¼t Trend þ Cyclical Component
þ Seasonal Component
þ Irregular Component:
In our models we have used linear and cosine compo-nents to model the trend and cyclic compocompo-nents while seasonality and irregular components are modelled using SARIMA models (see [12]).
To account for the observed periodicity in the time series, Yt, we introduced a combination of cosine com-ponents. This is a well known approach for addressing deterministic periodic effects in a time series data (see for example [Ch 5, 30] [15]) , and Wiener and Khintch-ine [13] have shown, in a seminal result, that a stationary time series can be completely written as a combination of sine and cosine components and error. From an ap-plication point of view this technique of modelling the trend and cyclical components can be perceived as a regression of the data Yt on periodic covariates, which are functions of time, while the stochastic dependence of the data, on its past including seasonality, is mod-elled by fitting SARIMA models to the residuals of this regression.
Plots of incidence over time showed volatility in the yearly and monthly TB-reporting indicating a possible heteroskedasticity of variance. We converted the raw data to its natural logarithm to stabilize the variance of the time series and improve the estimation.
Explicit formulae for modelling the trend of resident and non-resident monthly TB risk are given below. We
use the subscripts“R”and “NR” to indicate model com-ponents for residents and non-residents respectively.
Resident model
log Yð tRÞ ¼ β0Rþ β1RtþX k
βkRcos 2πt
TkR
þetR
Non-resident model
log Yð tNRÞ ¼ β0NRþβ1NRtþ
X
k
βkNRcos 2πt TkNR
þetNR
In each model β0 is the intercept term and β1 is the long term linear rate of change of TB risk per month. The principal reason for proposing the linear temporal component is to assess if monthly TB risk overall follows an increasing or decreasing trend,βkare the coefficients of thekthtime periodTk. All periods Tkare greater than 1 year. Based on sample autocorrelation and periodo-gram analysis of log(Yt) we proposed periods, Tk. The
corresponding coefficients β are then estimated and
tested for statistical significance, using the method of least squares. Specific details onkand the coefficientsβ for each model are given in the Results section and Table 1. The‘residual’correlated noise,et,were modelled using SARIMA models. Details of SARIMA models are given in Table 2. Initial investigation suggested that the models were both appropriate and parsimonious.
The long latency of TB is frequently observed as a major challenge in constructing epidemiological models for TB [16]. Therefore, we fitted similar linear models for TB risk to adjust for different latent periods of lag 0–4 years by changing the susceptible population nt, denomin-ator ofYt, to be the population size in the appropriately lagged year. For example, to account for a latent period of 1 year, we divided TB count for a particular time point by the population at risk during previous year.
The prediction models were developed using monthly reported TB data between 1996 and 2010 and validated by predicting the data for 2011.
Results
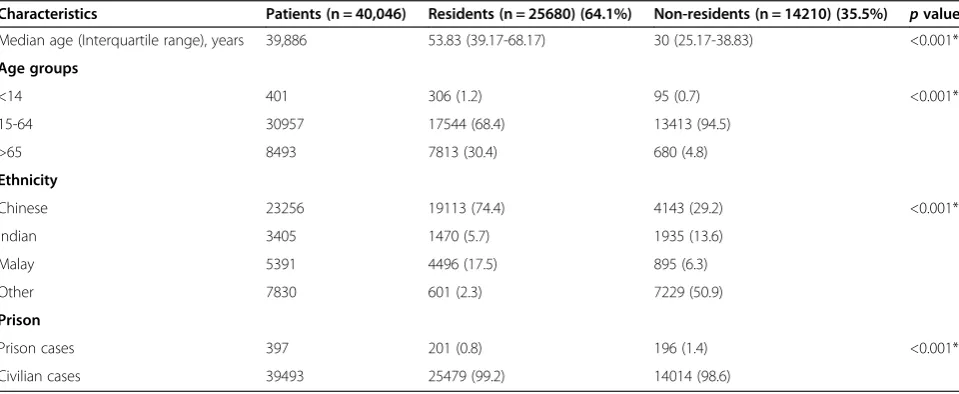
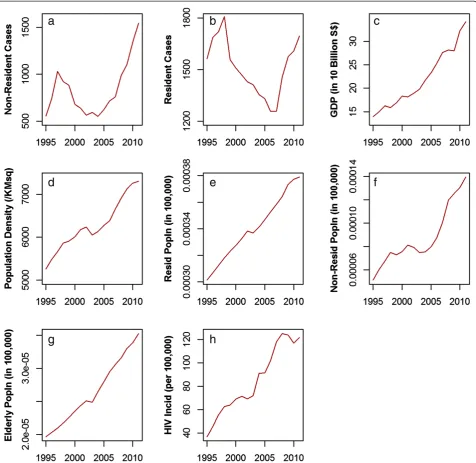
There were 40,046 laboratory-confirmed TB cases re-ported to the STEP registry between 1995 and 2011. Table 3 shows the demographic characteristics of TB cases by residential status. Among both residents and non-residents, most TB cases were aged 15–64 years old. Com-pared to resident TB cases, non-resident cases were more likely to be younger, belong to other (i.e. not belonging to any of the three main ethnic groups in Singapore, Chinese, Indian and Malay) ethnic groups and to be in prison. As residents and non-residents have substantially different demographic features and health issues, we did separate time series analyses for the two groups. Figure 1 shows the increasing trend of resident and non-resident TB cases corresponding to increasing population size and density. The proportion of non-resident TB cases contributing to the total case burden increased from 25.5% in 1995 and 28.9% in 2004 to 47.7% in 2011.
Predictors of annual TB cases
On the basis of parameter estimation and goodness of fit test statistics, plausible ARIMA models were used for time series regression analysis. For residents, an ARIMA (2, 0, 1) model was selected whereas for non-residents, an ARIMA (1, 1, 1) was preferred. We found no signifi-cant association between demographic factors and an-nual incidence of TB with or without adjustment of population-at-risk.
Annual TB risk analysis
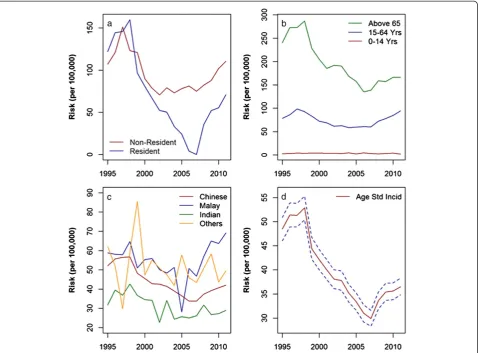
TB incidence rates were consistently higher among non-residents than non-residents over the period studied (Figure 2a). Among residents, the TB incidence rate was higher among those aged≥65 years and who belong to Malay and Other ethnic groups (Figure 2b,c). Age-standardized incidence rates (ASIR) among residents were significantly lower in 2011 (ASIR: 36.5 per 100,000 population, 95% CI = 34.8-Table 1 Linear model coefficient estimates of TB risk among residents and non-residents (1995–2011)
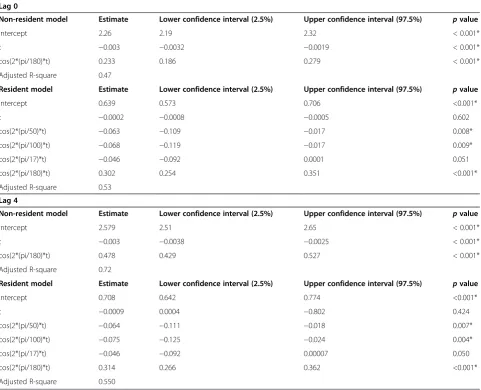
Lag 0
Non-resident model Estimate Lower confidence interval (2.5%) Upper confidence interval (97.5%) pvalue
Intercept 2.26 2.19 2.32 < 0.001*
t −0.003 −0.0032 −0.0019 < 0.001*
cos(2*(pi/180)*t) 0.233 0.186 0.279 < 0.001*
Adjusted R-square 0.47
Resident model Estimate Lower confidence interval (2.5%) Upper confidence interval (97.5%) pvalue
Intercept 0.639 0.573 0.706 <0.001*
t −0.0002 −0.0008 −0.0005 0.602
cos(2*(pi/50)*t) −0.063 −0.109 −0.017 0.008*
cos(2*(pi/100)*t) −0.068 −0.119 −0.017 0.009*
cos(2*(pi/17)*t) −0.046 −0.092 0.0001 0.051
cos(2*(pi/180)*t) 0.302 0.254 0.351 <0.001*
Adjusted R-square 0.53
Lag 4
Non-resident model Estimate Lower confidence interval (2.5%) Upper confidence interval (97.5%) pvalue
Intercept 2.579 2.51 2.65 < 0.001*
t −0.003 −0.0038 −0.0025 < 0.001*
cos(2*(pi/180)*t) 0.478 0.429 0.527 < 0.001*
Adjusted R-square 0.72
Resident model Estimate Lower confidence interval (2.5%) Upper confidence interval (97.5%) pvalue
Intercept 0.708 0.642 0.774 <0.001*
t −0.0009 0.0004 −0.802 0.424
cos(2*(pi/50)*t) −0.064 −0.111 −0.018 0.007*
cos(2*(pi/100)*t) −0.075 −0.125 −0.024 0.004*
cos(2*(pi/17)*t) −0.046 −0.092 0.00007 0.050
cos(2*(pi/180)*t) 0.314 0.266 0.362 <0.001*
Adjusted R-square 0.550
[image:4.595.58.540.101.491.2]38.3 per 100,000 population) by 24% compared with 1995 (ASIR: 48.5 per 100,000 population, 95% CI = 46-50.9 per 100,000 population) (Figure 2d). Despite a drop between 2004 and 2007, the ASIR has been increasing since 2008. Compared with the 2007 ASIR (29.9 per 100,000 popula-tion, 95% CI = 28.3-31.6 per 100,000 population), there was a 22% increase by 2011 (36.5 per 100,000 popula-tion, 95% CI = 34.8-38.3 per 100,000 population). When stratified by ethnic groups among residents, Malay and Other ethnicities had significantly higher ASIR over years (Additional file 1: Figure S1).
Monthly TB risk prediction
We noted that the TB incidence rates continued to be higher among non-residents than residents. The annual
time series analysis also indicated that TB incidence among non-residents continued to grow with an increas-ing population size. However, from a public health per-spective, it is important to assess the dynamics of TB incidence relative to the growth in population size (TB risk).
This study found that TB risk among the non-resident population was significantly linearly decreasing at a rate of 3% per year (monthly linear estimate =−0.3%, 95% CI =−0.3%, -1.9%,p< 0.0001) (Table 1).
However, we found no increasing or decreasing linear trend in the resident TB risk. Both resident and non-resident TB risk time series had significant long-term de-terministic periodicities. We modelled these patterns using standard trigonometric components (detailed in Table 1). For residents we observe that the monthly TB risk time series has periodicities of approximately 18 months, 4 years, 8 years. While for the non-resident group we ob-serve that periodicity coincides with the length of the time series. Additional file 2: Figure S2 shows the fitted curves superimposed on the resident and non-resident TB risk. From a purely epidemiology point of view, we would not wish to ascribe too much importance to the particular values of periodicity beyond its contribution to goodness-of-fit of the model. However the statistical significance of the periodic components underscore that monthly risk (and hence the monthly reported cases) have multiple long term periodicities and further research is needed to under-stand if there are socio-economic factors influencing these periodic effects.
[image:5.595.57.291.111.262.2]The linear models with suspected latent periods of 0– 4 years among residents and non-residents were found to be similar. In particular, for each lagged model, the rate of change of TB risk, Yt, continued to be statistically significantly negative among all lags of latent period. Table 2 Time series model selection criteria for TB risk
residuals
Lag 0 Lag 4
Model (Non-residents) AIC MSPE AIC MSPE
AR(2) −42.79 5.01 −37.6 5.13
MA(2) −42.88 5.06 −36.39 5.09
ARMA(2,2) −46.08 4.5 −35.42 4.8
SARIMA(1,0,0)(2,0,0) [14]* −51.1# 4.54# −46.49# 4.28#
Model (Residents) AIC MSPE AIC MSPE
AR(2) −42.66 0.85 −51.67 1.56
MA(3) −39.05 0.86 −51.35 1.57
ARMA(2,2) −39.17 0.87 −48.36 1.57
SARIMA(1,0,0)(2,0,0) [14]* −49.18# 0.77#
−59.42# 1.48#
AIC; Akaike information criterion, MSPE; Mean squared prediction error, AR; Autoregressive, MA; Moving average, ARMA; Autoregressive moving average, SARIMA; Seasonal Autoregressive Integrated Moving Average,
*; A SARIMA model for residual, with 12 month seasonality, seasonal autoregressive component of order 2 and linear autoregressive component of order 1.
#
; lower AIC and MSPE values indicate better fit of the model.
Table 3 Demographic characteristic of TB cases by resident status
Characteristics Patients (n = 40,046) Residents (n = 25680) (64.1%) Non-residents (n = 14210) (35.5%) pvalue
Median age (Interquartile range), years 39,886 53.83 (39.17-68.17) 30 (25.17-38.83) <0.001*
Age groups
<14 401 306 (1.2) 95 (0.7) <0.001*
15-64 30957 17544 (68.4) 13413 (94.5)
>65 8493 7813 (30.4) 680 (4.8)
Ethnicity
Chinese 23256 19113 (74.4) 4143 (29.2) <0.001*
Indian 3405 1470 (5.7) 1935 (13.6)
Malay 5391 4496 (17.5) 895 (6.3)
Other 7830 601 (2.3) 7229 (50.9)
Prison
Prison cases 397 201 (0.8) 196 (1.4) <0.001*
Civilian cases 39493 25479 (99.2) 14014 (98.6)
[image:5.595.58.538.529.726.2]Due to the similarity of the above lagged linear models, we reported the analyses with lag 0 and 4 (Table 1). Next, we investigated the autocorrelation among monthly resid-uals of the above linear models. The sample autocorrel-ation plots for the residuals of linear models for both resident and non-resident TB risk show a slow decaying periodic nature with significant autocorrelation at lags of multiples of 12 months (Additional file 3: Figure S3 and Additional file 4: Figure S4). On average, for both Resi-dents and Non-ResiResi-dents the peak of TB risk is observed
in the month of July with relatively more cases are re-ported in March, July and October, though we would like to point out that this seasonal difference is not substantial. These observations in a time series warrant the use of SARIMA models [13].
Based on AIC and MSPE values, we selected SARIMA models to be the best fit for monthly TB risk of residents and non-residents (Table 2).
[image:6.595.60.537.89.552.2]autocorrelation of residuals of the final SARIMA models. Sample autocorrelation of residuals are within the bounds of 95% confidence interval with no significant autocorrel-ation between residuals at different lag times, and the models passed the Box-Ljung test (p= 0.63) on auto-correlation of the final residuals and Kolmogorov-Smirnov test for normality (p= 0.58). Thus, we selected an additive combination of a deterministic linear model and a sto-chastic SARIMA for resident and non-resident TB risk. This analysis detected a 12-month stochastic seasonality and a long term deterministic periodicity in the reporting patterns of resident and non-resident TB risk.
Note
Different models and modeling techniques can be used for making inference on the same time series data. The periodic nature of sample autocorrelation function plots for residuals of the trend adjusted time series of TB risk for residents as well as non-residents depicted in
Additional file 3: Figure S3 and Additional file 4: Figure S4 indicate that one could also use Generalized Autore-gressive Moving Average models [18].
Discussion
Although the TB incidence rate in Singapore is lower than most other Asian countries, it is higher than most other developed countries [3]. We observed that TB in-cidence rates were higher among the elderly, Malay, the
[image:7.595.60.539.89.442.2]has clinical and socio-economic vulnerability to TB infec-tion and transmission [19].
Although HIV notification rates have been rising in Singapore, the increasing trend of HIV did not have a significant influence on yearly TB cases. This is possibly because the number of HIV cases is low especially in comparison to the overall TB burden in Singapore [20]. In addition, non-residents applying for work permits in Singapore are screened for HIV on arrival and are deported if they subsequently are diagnosed to be in-fected, limiting the impact of HIV on TB in the non-resident population.
Since around 2005, liberalization of immigration policy resulted in a marked increase in population and eco-nomic growth with a rapid influx of foreign-born immi-grants in Singapore. The non-resident population of Singapore has grown to about 37% of the country’s total labor force in 2012 [21]. Majority of immigrants come from high incidence TB countries such as India and China. An increasing trend of non-resident TB cases contributing to the overall proportion of TB cases over the years could suggest that mass immigration from high TB incidence countries is increasingly contributing to burden of TB in recent years in Singapore, similar to other low-incidence countries such as the US, Canada and the UK [22]. Given plausible interactions between residents and residents, TB infections in the non-resident population might have led to a subsequent transmission to residents, and a recent DNA finger-printing study in Singapore also suggested a cross-transmission between residents and non-residents [23]. Consistent with this hypothesis, the increasing trend of TB incidence among residents since 2008 seemed to fol-low a similar rise among non-residents after 2005. How-ever, our study did not find a direct influence of increasing number of non-resident population on resident TB cases. Importantly, when adjusted for population-at-risk, the TB risk among non-resident population was found to be decreasing at a rate of about 3% per year des-pite the burgeoning size of the non-resident population.
We found both short term seasonal and long term periodic variations in TB reporting. Seasonal variation has been reported in the countries with distinct climatic seasons [24-28], but its presence in Singapore is curious as this city state is located very close to equator and has little climatic variability across the year. This study high-lights a need for further studies to identify the factors explaining the seasonality of TB reporting patterns in Singapore. This study has shown that SARIMA model could be useful in the short-term prediction of TB in Singapore.
Under the implementation of National Tuberculosis Program in Singapore, non-residents can also access free DOTS treatment since 2010 in Singapore [29]. This
could be a plausible factor behind a decreasing trend of TB risk among non-residents. Additionally, it could also be explained due to a much greater influx of employment pass holders (professionals and white collar workers) than work permit holders (manual laborers and domestic workers) in the recent years [30]. Findings from this study may permit better understanding of the underlying time-series dynamics of TB risk among different demographic groups and review TB control measures at the national scale in Singapore. In ongoing research, we have identified that TB even within a city state of Singapore is a heteroge-neous multilevel event influenced by several demographic, socio-economic, spatio-temporal and environmental fac-tors. Thus, strategies for intervention need to be more specific for any demographic group and not based solely on overall incidence.
A clear strength of the current study is the complete-ness and consistency of the data: Singapore, as a city that is also a country, has a clearly demarcated border-line and population catchment, while legislation means that any case of TB has to be notified by the attending clinician to the ministry of health. Over the course of the study period, all such notifications have been shared with the national TB registry that has collated these data consistently. Another strength is the rapidness of changes to the population, which potentially would allow large ef-fects of demographics to be seen.
However there are also limitations. These could be broadly classified as either systemic or epidemiological. A major limitation is that the study period is relatively short for annual analysis. The implication of this is that there is limited power to detect smaller demographic ef-fects, and especially to identify independent effects of demographic changes at an annual level, given that many indicators have risen in tandem with each other. The monthly analysis is an attempt to identify effects at other temporal scales. While this limits the ability to re-late TB incidence to longer scale changes, such as demo-graphic indices for which only yearly data are available, it does permit estimation of secular changes and within-year changes, modelled as linear and sinusoidal terms, respectively. Use of monthly data naturally increases the data size and makes a more powerful analysis than the yearly analysis by itself.
total numbers, as these are not published by the govern-ment. Additionally, non-resident TB cases considerd in this study included both long-stay (dependent pass, work pass, student pass and long term social visit pass) and short-stay (short-term social visit pass with a maximum of 89 days) residents. We expected short-stay residents might have contributed to the overall non-resident TB cases to a small degree and exclusion of these cases might not have affected our results to a large extent. Lastly, as we could only obtain reliable data from 1995, we could not reliably assess the impact of STEP (which was formed in 1997) itself. Since the data are from a passive surveillance system, the possible biases in disease reporting and potential underreporting of TB cases might influence the precision of the analysis. How-ever, laboratory-confirmed tuberculosis is notifiable by law in Singapore, and is moreover notified by both the laboratory and the physician-in-charge. There was also no major difference in data collection and extraction procedures used throughout the study period, hence it is very unlikely that there were significant errors. Nonethe-less, a significant proportion of TB cases are culture-negative, and discarding these cases may have affected the analyses. Additionally, careful assessment of the ac-curacy and comprehensiveness is required when inter-preting the result of the analysis since TB notifications may not be considered as a direct measure of TB inci-dence [31]. Because of the long latency of TB, a longer period of time is required to determine the impact of in-creasing non-resident TB incidence on the resident population. Future molecular epidemiological studies are needed to differentiate recent infection or reactivation of TB between resident and non-resident population over time.
Conclusion
The study found that despite an increasing size of non-resident population, TB risk among non-non-residents was decreasing at a rate of about 3% per year. There was an apparent seasonality in the TB reporting patterns and SARIMA model could be useful in predicting the short-term trend of TB risk.
Additional files
Additional file 1: Figure S1.Age-standardized incidence rate of tuberculosis, stratified by ethnicity.
Additional file 2: Figure S2.Trend model of monthly TB risk (a) residents (b) non-residents.
Additional file 3: Figure S3.Autocorrelation (ACF) and partial autocorrelation (PACF) plots of fitted residuals (Residents).
Additional file 4: Figure S4.Autocorrelation (ACF) and partial autocorrelation (PACF) plots of fitted residuals (Non-residents).
Additional file 5: Figure S5.Autocorrelation and partial autocorrelation of final SARIMA model residuals (Residents).
Additional file 6: Figure S6.Autocorrelation and partial autocorrelation of final SARIMA model residuals (Non-residents).
Abbreviations
TB:Tuberculosis; ARIMA: Autoregressive integrated moving average; STEP: Singapore tuberculosis elimination program; TBCU: TB control unit; GDP: Gross domestic product; ACF: Autocorrelation function; PACF: Partial autocorrelation function; AIC: Akaike information criterion; DOTS: Directly observed treatment short course; MSPE: Mean square prediction error; SARIMA: Seasonal autoregressive integrated moving average; ASIR: Age-standardized incidence rates; AR: Autoregressive; MA: Moving average; D: Differencing.
Competing interests
All the authors have neither commercial nor personal associations or any sources of support that might pose a competing interest in the subject matter or materials discussed in this manuscript.
Authors’contributions
Conceived the study objectives and methodology; HLY, AE, SD, WW. Analyzed and interpreted the data; HLY, AE, SD, ARC, WW. Drafted the manuscript; HLY, AE, SD, CCBE, ARC, WW. All authors revised it critically for important intellectual content and approved and read the final manuscript.
Acknowledgments
The authors appreciate the support of Duke-NUS/SingHealth Academic Medicine Research Institute, the medical editing assistance of Taara Madhavan (Associate, Clinical Sciences, Duke-NUS Graduate Medical School) and the advice of Dr Jeffery Cutter (Director, Communicable Diseases Division, Ministry of Health Singapore).
Financial support for this work was provided by a grant from the Centre for Infectious Disease Epidemiology and Research, Saw Swee Hock School of Public Health, National University of Singapore, Singapore.
Author details
1Centre for Infectious Disease Epidemiology & Research, Saw Swee Hock
School of Public Health, National University of Singapore and NUHS, Singapore, Singapore.2Centre for Quantitative Medicine, Duke NUS Graduate Medical School, Singapore, Singapore.3Singapore Tuberculosis Elimination Programme, Tan Tock Seng Hospital, Novena, Singapore.4Department of Emergency Medicine, Singapore General Hospital, Singapore, Singapore.
Received: 25 June 2014 Accepted: 17 October 2014 Published: 31 October 2014
References
1. Tuberculosis; Fact Sheet.[http://www.who.int/mediacentre/factsheets/ fs104/en/]
2. Maher D:The natural history of Mycobacterium tuberculosis infection in adults.InTuberculosis: A comprehensive clinical reference.Edited by Schaaf HS, Zumla A. UK: Elsevier Health Sciences; 2009:129–132.
3. Global tuberculosis report 2013.[http://apps.who.int/iris/bitstream/10665/ 91355/1/9789241564656_eng.pdf]
4. Tuberculosis Fact Sheet.[http://www.who.int/mediacentre/factsheets/ who104/en/print.html]
5. Key Annual Indicators.[http://www.singstat.gov.sg]
6. Chee C, Wang YT:TB control in Singapore: where do we go from here?
Singapore Med J2012,53:236.
7. Communicable Disease Surveillance Report in Singapore 2010.
[http://www.moh.gov.sg/content/dam/moh_web/Publications/Reports/ 2012/Communicable%20Diseases%20Surveillance%20in%20Singapore% 202011/Full%20Version%20of%20the%20Report%202011.pdf] 8. Permanasari AE, Rambli DRA, Dominic PDD:Performance of univariate
forecasting on seasonal diseases: the case of tuberculosis.InSoftware Tools and Algorithms for Biological Systems.New York: Springer; 2011:171–179. 9. Statistics; Latest Data.[http://www.singstat.gov.sg/statistics/latest_data.
10. Communicable Diseases Surveillance in Singapore 2011.[http://www. moh.gov.sg/content/moh_web/home/Publications/Reports/2012/ _communicable_diseasessurveillanceinsingapore2011.html]
11. Box GEP GMJ:Time series analysis: forecasting and control.San Francisco: Holden Day; 1976:181–218.
12. Brockwell P, Davis R:Time Series: Theory and Methods.InSpringer Series in Statistiscs.New York: Springer Verlag; 1991.
13. Shumway RH, Stoffer DS:Time Series Analysis and its applications.Springer Texts in Statistics; 2011.
14. Doll R, Payne P, Waterhouse J:Cancer Incidence in Five Continents: A Technical Report.InBook Cancer Incidence in Five Continents: A Technical Report.City: Springer Verlag (for UICC); 1966.
15. Davis RA, Dunsmuir WTM, Streett SB:Observation driven models for poisson counts.Biometrika2003,90(4):777–790.
16. Magombedze G, Dowdy D, Mulder N:Latent tuberculosis: models, computational efforts and the pathogen's regulatory mechanisms during dormancy.Front Bioeng Biotechnol2013,1.
17. Hyndman R:R package version 5.4 forecast: Forecasting functions for time series and linear models; [http://cran.r-project.org/web/packages/forecast/ index.html]
18. Benjamin MA, Rigby RA, Stasinopoulos DM:Generalized autoregressive moving average model.J Am Stat Assoc2003,98(461).
19. Lim L, Enarson D, Reid A, Satyanarayana S, Cutter J, Kyi Win K, Chee C, Wang Y:Notified tuberculosis among Singapore residents by ethnicity, 2002–2011.Public Health Action2013,3:311–316.
20. Update on the HIV/AIDS situation in Singapore.2013, [http://www.moh. gov.sg/content/moh_web/home/statistics/infectiousDiseasesStatistics/ HIV_Stats/update-on-the-hiv-aids-situation-in-singapore-20130.html] 21. Labour Force.2013,
[http://stats.mom.gov.sg/Pages/Labour-Force-in-Singapore-2013-Labour-Force.aspx]
22. MacPherson D, Gushulak B:Balancing prevention and screening among international migrants with tuberculosis: population mobility as the major epidemiological influence in low-incidence nations.Public Health 2006,120:712–723.
23. Lim LK, Sng LH, Win W, Chee CB, Hsu LY, Mak E, Earnest A, Ong ME, Cutter J, Wang YT:Molecular epidemiology of mycobacterium tuberculosis complex in Singapore, 2006–2012.PLoS One2013,8:e84487. 24. Li X-X, Wang L-X, Zhang H, Du X, Jiang S-W, Shen T, Zhang Y-P, Zeng G:
Seasonal variations in notification of active tuberculosis cases in China, 2005–2012.PLoS One2013,8:e68102.
25. Douglas A, Strachan D, Maxwell J:Seasonality of tuberculosis: the reverse of other respiratory diseases in the UK.Thorax1996,51:944–946. 26. Kumar V, Singh A, Adhikary M, Daral S, Khokhar A, Singh S:Seasonality of
tuberculosis in Delhi India: a time series analysis.Tuberc Res Treat2014,
2014.
27. Luquero F, Sanchez-Padilla E, Simon-Soria F, Eiros J, Golub J:Trend and seasonality of tuberculosis in Spain, 19962004 [Short Communication].
Int J Tuberc Lung Dis2008,12:221–224.
28. Rios M, Garcia J, Sanchez J, Perez D:A statistical analysis of the seasonality in pulmonary tuberculosis.Eur J Epidemiol2000,16:483–488.
29. Health: News; Free TB treatment.
30. Foreign Workforce Numbers.[http://mom.gov.sg/statistics-publications/ others/statistics/Pages/ForeignWorkforceNumbers.aspx]
31. WHO Western Pacific Region:Western Pacific Surveillance and Response; Using tuberculosis surveillance data for informed programmatic decision-making.[http://www.wpro.who.int/wpsar/volumes/04/1/ 2013_ED_Nishikiori/en/index.html]
doi:10.1186/1471-2458-14-1121
Cite this article as:Wahet al.:Time series analysis of demographic and temporal trends of tuberculosis in Singapore.BMC Public Health 201414:1121.
Submit your next manuscript to BioMed Central and take full advantage of:
• Convenient online submission
• Thorough peer review
• No space constraints or color figure charges
• Immediate publication on acceptance
• Inclusion in PubMed, CAS, Scopus and Google Scholar
• Research which is freely available for redistribution