RESEARCH NOTE
Automated cell cycle and cell size
measurements for single-cell gene expression
studies
Anissa Guillemin
1*, Angélique Richard
1, Sandrine Gonin‑Giraud
1and Olivier Gandrillon
1,2Abstract
Objectives: Recent rise of single‑cell studies revealed the importance of understanding the role of cell‑to‑cell vari‑ ability, especially at the transcriptomic level. One of the numerous sources of cell‑to‑cell variation in gene expression is the heterogeneity in cell proliferation state. In order to identify how cell cycle and cell size influences gene expres‑ sion variability at the single‑cell level, we provide an universal and automatic toxic‑free label method, compatible with single‑cell high‑throughput RT‑qPCR. The method consists of isolating cells after a double‑stained, analyzing their morphological parameters and performing a transcriptomic analysis on the same identified cells.
Results: This led to an unbiased gene expression analysis and could be also used for improving single‑cell tracking and imaging when combined with cell isolation. As an application for this technique, we showed that cell‑to‑cell vari‑ ability in chicken erythroid progenitors was negligibly influenced by cell size nor cell cycle.
Keywords: Cell size, Cell cycle, Gene expression, Single‑cell transcriptomic
© The Author(s) 2018. This article is distributed under the terms of the Creative Commons Attribution 4.0 International License (http://creativecommons.org/licenses/by/4.0/), which permits unrestricted use, distribution, and reproduction in any medium, provided you give appropriate credit to the original author(s) and the source, provide a link to the Creative Commons license, and indicate if changes were made. The Creative Commons Public Domain Dedication waiver (http://creativecommons.org/ publicdomain/zero/1.0/) applies to the data made available in this article, unless otherwise stated.
Introduction
It has been known for decades that isogenic cells can differ from each other in their molecular composition [1, 2]. The refinement of molecular techniques together with computational approaches has recently allowed to get a quantitative view on this cell-to-cell variability. This strongly highlighted the importance of understanding the causes in such variations, leading to a recent turning point in single-cell studies [3–6].
A leading source of cell-to-cell variability can be attrib-uted to stochastic gene expression [7–9]. Numerous fac-tors contribute to cell-to-cell variability such as reactions involving a low-copy number of molecules especially during transcription processes [5, 7, 10, 11] or differ-ences in the internal states of a cell population such as cellular age or cell cycle stage. In litterature, we can find
contradictory results regarding the influence of cell cycle and cell size on gene expression. Some studies argued that both of these morphological parameters affect gene expression variation [7, 12–17] whereas, others support that this impact is negligible [18–21].
Stochastic gene expression takes various biological meaning [22–24]. In a cell fate context, stochastic gene expression could drive cells into the differentiation pro-cess [25]. It has been shown that during the erythroid differentiation process, we can observe an increase in cell-to-cell variability among genes expression that may participate to the decision making process within differ-entiation [21].
Together, these information highlight the importance to precisely identify the sources of gene expression vari-ability involved in these phenomena in order to under-stand their role, and to discard potential confounding effects.
Cell cycle variability can be identified and suppressed by fluorescent-labeling of cell cycle-specific genes, how-ever this method requires genetical alteration of the investigated cells [26]. Other studies, based on compu-tational approach, deconvolute the cell cycle variables in
Open Access
*Correspondence: anissa.guillemin@ens‑lyon.fr
1 Laboratoire de biologie et modélisation de la cellule. LBMC‑Ecole
Normale Supérieure‑Lyon, Université Claude Bernard Lyon 1, Institut National de la Santé et de la Recherche Médicale: U1210‑Ecole Normale Supérieure de Lyon, Centre National de la Recherche Scientifique: UMR5239, 46 Allée d’Italie, 69007 Lyon, France
order to normalize their single-cell gene expression data. Most of them use cell cycle marker genes to train algo-rithms that can predict cell cycle stage of individual cells [14, 27, 28]. However, these genes have different function or timing according to cell type, even in a same organism [29].
In this article, we propose a more direct approach that consists in measuring morphological parameters in a high-throughput single-cell RT-qPCR study. Using a non-cytotoxic double-staining technique we measured auto-matically cell cycle phase and cell size of every single-cell isolated from T2EC, a primary chicken erythroid progen-itor cells [30]. We demonstrated that the labelling had no detectable effects at the single-cell transcriptomic level in those primary progenitors, suggesting that this technique could be an useful tool for molecular single-cell based studies.
We finally showed that in our cellular system neither cell size nor cell cycle state could be deemed responsible for the cell-to-cell variation we observed, ruling out their potential confounding effects.
Main text
Methods Cell culture
T2EC were extracted from bone marrow of 19 days-old SPAFAS white leghorn chickens embryos (INRA, Tours, France). The composition of the culture medium has been previously described [21].
Double‑staining
Cells were incubated in their initial medium for 30 min with CFSE (5-(and 6)-carboxyfluorescein diacetate suc-cinimidyl ester, Life Tech.) at 5 μM and Hoechst 33342 (Life Tech.) at 5 μg/mL at 37 °C in a tube protected from light. After 2 washings in phosphate-buffered saline (PBS, Life Tech.), cells were loaded in the C1 system (Fluidigm).
RT‑qPCR at population level
Cell culture were washed with PBS 4 h after the double-staining. Total RNA was extracted using RNeasy Mini Kit (Qiagen).
Reverse transcription assays were performed using the Superscript III First-Strand Synthesis System (Invitrogen) for 500 ng of total RNA.
Real-time PCR was performed with SYBR Green PCR Kit (ClonTech) in the CFX96 real-time PCR system (Bio-rad). Specific primers were used to quantify the expres-sion of genes [21].
RT‑qPCR at single‑cell level
• From cell isolation to pre-amplification Cells were diluted with C1 cell suspension reagent (Fluidigm) at
a concentration of 4 ×10⁵ cells/mL. This step was
followed by a cell filtration in a cellular sieve (50 μm). Cells were loaded in the C1 IFC (5–10 μm trap size, Fluidigm). The C1 system performed the cell isolation and pictures were taken with 2 different lasers (UV laser providing excitation at ∼ 350 nm and another at ∼ 488 nm) using a PALM-STORM NIKON Micro-scope (CIQLE). Then, the microplate was back in the C1 system where lysis, reverse-transcription and amplification was performed. Primers have been pre-viously described [21]. cDNA were loaded in a classic 96 well plate and conserved at − 20 °C until the RT-qPCR.
• Biomark real-time PCR quantification of cDNA were performed using EvaGreen following the Fluidigm user guide available on their website. Each condi-tion was loaded in parallel in the same microfluidic-based chip to avoid chip-to-chip technical variability. An IFC Controller HX performed the load of cDNA samples and primers from the inlets into the chip. The Biomark HD analyzed the chip according to the GE 96 × 96 PCR + Melt v2.pcl program. RNA spikes were used as positive control to validate the RT-qPCR experiment. From this outlet, the analysis software generated cycle of quantification values (Cq) for each reaction.
ImageJ analysis
Each image corresponding at each lasers used were ana-lyzed following a previously described procedure [31]. We visually confirmed the capture for each well and extracted automatically morphological information using ImageJ. After checking that all cells were detected by the software, we run the measurement of cell area (CFSE), nucleus area and intensity (Hoechst). The cell-volume (2) was then calculated from area measurements (1) using these following formulae:
with r the radius of cell, S the area and V the cell volume in µm3.
Analysis of gene expression
For population RT-qPCR analysis, ratios of gene expres-sion variation between conditions were calculated fol-lowing this folfol-lowing formulae [32]. Because of its low variability between all conditions, HnRNP was used as referential gene in these analyses.
(1) r=
S
π
(2)
V =
4
3 ×π×r
For single-cell RT-qPCR, raw Cq data was then
com-puted using R [33] via a specific script that was previously described [21]. Some genes were excluded from analyses due to the quality control during the RTqPCR. The out-put file comprising absolute values of mRNA was used as a template for all following analysis. Statistical non-parametric tests were performed: correlations between gene expression and cell morphological parameters were performed using spearman tests. Wilcoxon tests were used to compare gene expression between stained and unstained conditions. Each time, Bonferroni correction was applied to p-values for the use of multiple tests.
PCA
PCAs were performed using ade4 package [34]. PCA was centered (mean substraction) and normalized (dividing by the standard deviation). PCA was displayed according to PC1 and PC2, which are the first and second axis of the PCA respectively.
Results
Cellular morphological automatic measuring
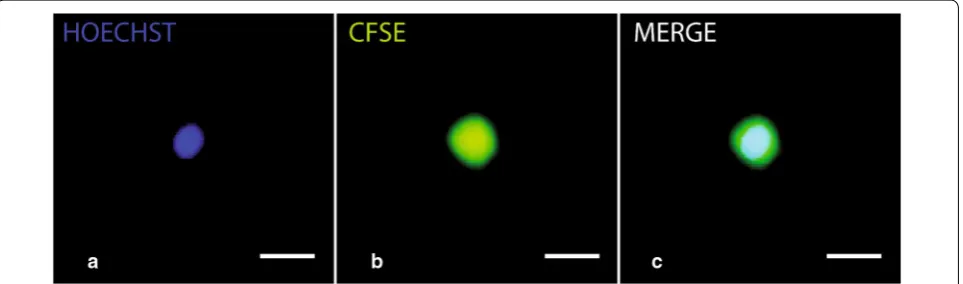
We choose the two low toxic fluorescent dyes, CFSE and Hoechst 33342 that stably incorporates into cells. In this study, CFSE was used as a cell area marker in tan-dem with Hoechst 33342 [35] as a nuclear marker. The use of two different lasers allowed revealing each stain-ing (Fig. 1a, b) merged in Fig. 1c. It allowed us to auto-matically measure morphological cell parameters and inferred volumes.
We can observe that the cell volume is very poorly cor-related with the nucleus volume (Fig. 2a). Therefore cell size by itself does not seem to be a good proxy for deter-mining cell cycle position probably because it integrated other unknown parameters. Both cell and nucleus vol-ume density distributions confirm that cell size spans a
much larger range than the nucleus size which displays the classical 2n/4n distribution (Fig. 2b). Nuclear-volume was clearly more correlated with Hoechst fluorescence intensity than cell-volume (Fig. 2a, c). The nucleus vol-ume can therefore be considered as a good indicator for the position of the cell in the cell cycle. Furthermore it should be noted that volume is a purely geometrical object that is not influenced by the laser bleaching, as Hoechst fluorescence intensity parameter.
We therefore described a double-staining procedure compatible with microscopy associated at the C1 system to measure, for each cell, their size and cell cycle state independently.
Staining effect
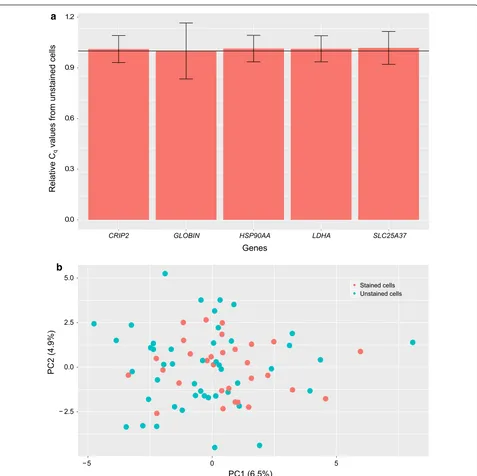
First, we assessed the influence of the double-staining procedure on gene expression at the population level by performing RT-qPCR on 5 selected genes known to be involved in erythroid differentiation or metabolism. The relative value of these gene expressions did not change significantly compared to unstained cells (Fig. 3a). These results suggested that cell and nucleus staining had no major influence on T2EC mean gene expression.
We then needed to discard possible modifications vis-ible only at the individual-cell level. Therefore we per-formed high-throughput RT-qPCR on single cells using 77 genes that cover various functions as metabolism, dif-ferentiation process and proliferation [21]. We compared 30 single stained cells and 47 single unstained cells in the same microchip. Data was analyzed using a PCA-based dimensionality reduction algorithm (Fig. 3b) as well as Wilcoxon signed-rank tests (see Additional file 1: Table S1). The PCA does not show any separation between both conditions (PC1 and PC2 explained less than 12% of the variability), and the statistical analysis shows that no gene was significantly varying between the two
[image:3.595.59.541.546.688.2]conditions. These results therefore show that the staining did not affect the expression of these 77 genes in T2EC even when examined at the single-cell level.
Finally as an application example for our double-staining approach, we investigated the influence of cell cycle and cell size on cell-to-cell variability among our gene expressions using the coupling of labeling and gene expression measurements at the single-cell level.
Cell morphological impact on T2EC gene expression
For each single cell, we measured the size, the posi-tion in the cell cycle and the mRNA amount. Among 69 genes analyzed (retained in this study for technical quality control), none presented a significant spearman correlation between its expression level among single cell volumes or cell cycle: all p-values were above the 5% threshold. These results confirmed that neither cell size nor the position in cell cycle were relevant param-eters in explaining the cell-to-cell variations observed for 69 genes examined. This information is important for stochastic single-cell-based gene expression analy-sis, for which these morphological parameters can be excluded of the potential sources of variability between cells.
Conclusion
We performed a non-cytotoxic CFSE/Hoechst double-staining compatible with the C1 system. This approach allowed automatic identification and measure of mor-phological parameters. It can be used to measure the influence of cell cycle and cell size on single-cell gene expression analysis without any potential mislead-ing cell state effects induced by cell cycle synchroniza-tion methods. It could be also represent an alternative method to avoid artificial cell sorting according to their size or their cell cycle phase, which could be interesting for low amount of cells. This is equivalent to the recently described technique using flow cytometry [36], but appli-cable in the C1 system. As an alternative, it has recently been described that predefined gene combination could be used a posteriori [37]. Unfortunately, the best combi-nations seems to be cell type dependent, making it poten-tially limited [38].
We then used the Biomark system to perform gene expression quantification. We showed that the dou-ble staining did not impact gene expression in our cells. Moreover, by measuring the influence of cell cycle and cell size on the expression level of 69 genes, our results support our previous claim that cell cycle and cell size have a negligible influence on gene expression variabil-ity in certain settings [21]. This is in line with the recent demonstration that the cell cycle explains only a very small amount (5–17%) of gene expression variability [18, 20].
Limitations
In this study, the main limitation was the optimiza-tion of cell capture in the C1 microchip. We obtained a maximum of 65% of capture whereas with other cells, this percent raise up to 95%. Numerous parameters were involved and have to be optimized in order to obtain more individual cells per microchip.
ρs= 0.62
p-value = 4.143 e-5
n=37 a
mµ(
e
mul
ov
ll
e
C
3)
Nucleus volume (µm3)
0 250 500 750 1000 0
500 1000 1500 2000
Nucleus volume
b
Volume (µm3)
0 500 1000 1500 2000 0.0020
0.0015
0.0010
0.0005
0.0000
yti
sn
e
D
ρs= 0.92
p-value = 3.217 e-16
n=37 c
mµ(
e
mul
ov
su
elc
u
N
3)
1e+06 2e+06 3e+06 750
500
250
0 1000
[image:4.595.57.292.84.504.2]0.0 0.3 0.6 0.9 1.2
Genes
CRIP2 GLOBIN HSP90AA LDHA SLC25A37
Relative
Cq
values from unstained cell
s
a
− 2.5 0.0 2.5 5.0
−5 0 5
Unstained cells Stained cells
PC2 (4.9%)
PC1 (6.5%) b
[image:5.595.60.537.84.560.2]Abbreviations
(RT‑q)PCR: reverse transcription quantitative polymerase chain reaction; T2EC: TGF‑α/TGF‑β‑induced erythrocytic cells; (c)DNA: complementary deoxyri‑ bonucleic acid; (m)RNA: messenger ribonucleic acid; CFSE: carboxyfluores‑ cein diacetate succinimidyl ester; PBS: phosphate‑buffered saline; HnRNP: heterogeneous nuclear ribonucleoprotein; GE: gene expression; PCA: Principal Component Analysis; PC1: first principal component; PC2: second principal component.
Authors’ contributions
AG designed and performed experiments and drafted the manuscript. ARd‑ esigned and performed experiments. OG and SGG supervised the study.All the authors reviewed the manuscript. All authors read and approved thefinal manuscript.
Author details
1 Laboratoire de biologie et modélisation de la cellule. LBMC‑Ecole Normale
Supérieure‑Lyon, Université Claude Bernard Lyon 1, Institut National de la Santé et de la Recherche Médicale: U1210‑Ecole Normale Supérieure de Lyon, Centre National de la Recherche Scientifique: UMR5239, 46 Allée d’Italie, 69007 Lyon, France. 2 Inria Dracula, 69100 Villeurbanne, France.
Acknowledgements
We thank ProfileXpert and “Plateforme d’imagerie CIQLE” (Genomique & Microgenomique Unit, Universite Lyon 1, SFR Sante LYON‑EST, UCBL‑INSERM US 7‑CNRS UMS 3453) for the use of C1 system and imagery.
Competing interests
The authors declare that they have no competing interests.
Availability of data and materials
The data set regarding the simultaneous measurement of gene expression,cell volume and nucleus volume is available at: https://osf.io/8x5n7/.
Consent for publication
Not applicable.
Ethics approval and consent to participate
Not applicable.
Funding
This work was supported by funding from the French agency ANR (ICEBERG; ANR‑IABI‑3096) and La Ligue Contre le Cancer (Comite de Haute Savoie).
Publisher’s Note
Springer Nature remains neutral with regard to jurisdictional claims in pub‑ lished maps and institutional affiliations.
Received: 23 November 2017 Accepted: 23 January 2018
References
1. Lyon MF. Gene action in the X‑chromosome of the mouse (Mus musculus L.). Nature. 1961;190:372–3.
2. Spudich JL, Koshland DE. Non‑genetic individuality: chance in the single cell. Nature. 1976;262(5568):467–71.
Additional file
Additional file 1: Table S1. Statistical analysis of gene expression according to the stained or the unstained condition. Statistical tests (Wil‑ coxon) were performed for each gene between their expression in stained and unstained condition. A Bonferroni correction was applied in p‑values for multiple tests.
3. Raj A, Peskin CS, Tranchina D, Vargas DY, Tyagi S. Stochastic mRNA synthe‑ sis in mammalian cells. PLoS Biol. 2006;4(10):309.
4. Coulon A, Gandrillon O, Beslon G. On the spontaneous stochastic dynamics of a single gene: complexity of the molecular interplay at the promoter. BMC Syst Biol. 2010;4(4):2.
5. Gandrillon O, Kolesnik‑Antoine D, Kupiec JJ, Beslon G. Chance at the heart of the cell. Prog Biophys Mol Biol. 2012;110:1–4.
6. Junker JP, van Oudenaarden A. Every cell is special: genome‑wide studies add a new dimension to single‑cell biology. Cell. 2014;157(1):8–11. 7. Swain PS, Elowitz MB, Siggia ED. Intrinsic and extrinsic contribu‑
tions to stochasticity in gene expression. Proc Natl Acad Sci USA. 2002;99(20):12795–800.
8. Elowitz MB, Levine AJ, Siggia ED. Stochastic gene expression in a single cell. Science. 2002;297(5584):1183–6.
9. Raser JM, O’Shea EK. Noise in gene expression: origins, consequences, and control. Science. 2005;309(5743):2010–3.
10. Morelli MJ, Allen RJ, Wolde PR. Effects of macromolecular crowding on genetic networks. Biophys J. 2011;101(12):2882–91.
11. Komorowski M, Miekisz J, Stumpf MP. Decomposing noise in biochemical signaling systems highlights the role of protein degradation. Biophys J. 2013;104(8):1783–93.
12. Singh A. Cell‑cycle control of developmentally regulated transcription factors accounts for heterogeneity in human pluripotent cells. Stem Cell Rep. 2013;1:532–44.
13. Padovan‑Merhar O, Nair GP, Biaesch AG, Mayer A, Scarfone S, Foley SW, Wu AR, Churchman LS, Singh A, Raj A. Single mammalian cells compensate for differences in cellular volume and dna copy number through independent global transcriptional mechanisms. Mol Cell. 2015;58(2):339–52. https://doi.org/10.1016/j.molcel.2015.03.005.p40. 14. Buettner F, Natarajan KN, Casale FP, Proserpio V, Scialdone A, Theis FJ, Teichmann SA, Marioni JC, Stegle O. Computational analysis of cell‑to‑ cell heterogeneity in single‑cell RNA‑sequencing data reveals hidden subpopulations of cells. Nat Biotechnol. 2015;33(2):155–60. https://doi. org/10.1038/nbt.3102.p40.
15. Kimmerling RJ, Lee Szeto G, Li JW, Genshaft AS, Kazer SW, Payer KR, de Riba Borrajo J, Blainey PC, Irvine DJ, Shalek AK, Manalis SR. A microfluidic platform enabling single‑cell RNA‑seq of multigenerational lineages. Nat Commun. 2016;7:10220.
16. Newman JR, Ghaemmaghami S, Ihmels J, Breslow DK, Noble M, DeRisi JL, Weissman JS. Single‑cell proteomic analysis of S. cerevisiae reveals the architecture of biological noise. Nature. 2006;441(7095):840–6. 17. Loewer A, Lahav G. We are all individuals: causes and consequences of
non‑genetic heterogeneity in mammalian cells. Curr Opin Genet Dev. 2011;21(6):753–8.
18. McDavid A, Dennis L, Danaher P, Finak G, Krouse M, Wang A, Webster P, Beechem J, Gottardo R. Modeling bi‑modality improves characteriza‑ tion of cell cycle on gene expression in single cells. PLoS Comput Biol. 2014;10(7):1003696.
19. Chang HH, Hemberg M, Barahona M, Ingber DE, Huang S. Transcriptome‑ wide noise controls lineage choice in mammalian progenitor cells. Nature. 2008;453(7194):544–7.
20. Klein AM, Mazutis L, Akartuna I, Tallapragada N, Veres A, Li V, Peshkin L, Weitz DA, Kirschner MW. Droplet barcoding for single‑cell transcriptomics applied to embryonic stem cells. Cell. 2015;161(5):1187–201. https://doi. org/10.1016/j.cell.2015.04.044.p40.
21. Richard A, Boullu L, Herbach U, Bonnafoux A, Morin V, Vallin E, Guillemin A, Papili Gao N, Gunawan R, Cosette J, Arnaud O, Kupiec JJ, Espinasse T, Gonin‑Giraud S, Gandrillon O. Single‑cell‑based analysis highlights a surge in cell‑to‑cell molecular variability preceding irreversible commit‑ ment in a differentiation process. PLoS Biol. 2016;14(12):1002585. 22. Thattai M, van Oudenaarden A. Stochastic gene expression in fluctuating
environments. Genetics. 2004;167(1):523–30. 0016‑6731 (Print) Journal Article Research Support, Non‑U.S. Gov’t Research Support, U.S. Gov’t, Non‑P.H.S.
23. Weinberger LS, Burnett JC, Toettcher JE, Arkin AP, Schaffer DV. Stochastic gene expression in a lentiviral positive‑feedback loop: HIV‑1 tat fluctua‑ tions drive phenotypic diversity. Cell. 2005;122(2):169–82.
• We accept pre-submission inquiries
• Our selector tool helps you to find the most relevant journal
• We provide round the clock customer support
• Convenient online submission
• Thorough peer review
• Inclusion in PubMed and all major indexing services
• Maximum visibility for your research
Submit your manuscript at www.biomedcentral.com/submit
Submit your next manuscript to BioMed Central
and we will help you at every step:
25. Mojtahedi M, Skupin A, Zhou J, Castaño IG, Leong‑Quong RYY, Chang H, Giuliani A, Huang S. Cell fate‑decision as high‑dimensional critical state transition. BioRvix. 2016. https://doi.org/10.1101/041541.
26. Sakaue‑Sawano A, Miyawaki A. Visualizing spatiotemporal dynamics of multicellular cell‑cycle progressions with fucci technology. Cold Spring Harb Protoc. 2014;132(3):487–498. https://doi.org/10.1016/j. cell.2007.12.033.
27. Scialdone A, Natarajan KN, Saraiva LR, Proserpio V, Teichmann SA, Stegle O, Marioni JC, Buettner F. Computational assignment of cell‑cycle stage from single‑cell transcriptome data. Methods. 2015;85:54–61. https://doi. org/10.1016/j.ymeth.2015.06.021.p40.
28. Vallejos CA, Marioni JC, Richardson S. Basics: Bayesian analysis of single‑ cell sequencing data. PLoS Comput Biol. 2015;11(6):1004333. https://doi. org/10.1371/journal.pcbi.1004333.p40.
29. Bruce A, Alexander J, Julian L, Martin R, Keith R, Peter W. Molecular biol‑ ogy of the cell. 4th edn. 2002.
30. Gandrillon O, Schmidt U, Beug H, Samarut J. TGF‑beta cooperates with TGF‑alpha to induce the self‑renewal of normal erythrocytic progenitors: evidence for an autocrine mechanism. Embo J. 1999:18(10):2764–81. 0261‑4189 Journal Article
31. Grishagin IV. Automatic cell counting with ImageJ. Anal Biochem. 2015;473:63–5.
32. Bresson C, Keime C, Faure C, Letrillard Y, Barbado M, Sanfilippo S, Benhra N, Gandrillon O, Gonin‑Giraud S. Large‑scale analysis by SAGE reveals new mechanisms of v‑erbA oncogene action. BMC Genomics. 2007;8:390. 33. Team RDC. R: a language and environment for statistical computing. Vienna, Austria. ISBN 3‑900051‑07‑0, http://www.R‑project.org. 2008. 34. Dray S, Dufour AB. The ade4 package: implementing the duality diagram
for ecologists. J Stat Softw. 2007;22:1–20.
35. Johansson L, Sohn D, Thorberg SO, Jackson DM, Kelder D, Larsson LG, Renyi L, Ross SB, Wallsten C, Eriksson H, Hu PS, Jerning E, Mohell N, Westlind‑Danielsson A. The pharmacological characterization of a novel selective 5‑hydroxytryptamine1a receptor antagonist, NAD‑299. J Phar‑ macol Exp Ther. 1997;283(1):216–25.
36. Blasi T, Hennig H, Summers HD, Theis FJ, Cerveira J, Patterson JO, Davies D, Filby A, Carpenter AE, Rees P. Label‑free cell cycle analysis for high‑ throughput imaging flow cytometry. Nat Commun. 2016;7:10256. 37. Liu Z, Lou H, Xie K, Wang H, Chen N, Aparicio OM, Zhang MQ, Jiang R,
Chen T. Reconstructing cell cycle pseudo time‑series via single‑cell transcriptome data. Nat Commun. 2017;8(1):22.