R E S E A R C H A R T I C L E
Open Access
Japan nosocomial infections surveillance
(JANIS): a model of sustainable national
antimicrobial resistance surveillance based
on hospital diagnostic microbiology
laboratories
Atsuko Tsutsui and Satowa Suzuki
*Abstract
Background:Antimicrobial resistance (AMR) is now recognized as a major threat to public health, and surveillance of AMR is essential for successful containment. In 2000, Japan Nosocomial Infections Surveillance (JANIS) Clinical Laboratory (CL) division has been launched as a voluntary AMR surveillance funded by the Ministry of Health, Labour and Welfare and managed by the National Institute of Infectious Diseases. In this study, we aimed to propose a model of sustainable national AMR surveillance which provides not only national AMR surveillance reports but also benchmarking reports to each hospital to facilitate infection control practices.
Methods:JANIS CL division collects comprehensive specimen-based data complies with JANIS data format from
participating hospitals each month. It had targeted only blood and cerebrospinal fluid samples but was expanded to all types of specimens in 2007 at revision of JANIS. The JANIS system interprets the antimicrobial susceptibility according to the same criteria and conducts removal of duplicates to allow accurate comparison between hospitals. Monthly feedback reports are created automatically within 48 h, while quarterly and annual reports are generated after data validation.
Results:At the beginning, 468 hospitals were enrolled in the JANIS CL division, but the number of hospitals
that submitted data decreased to 210 (45%) in 2006. After surveillance revision in 2007, annual recruitment of hospitals was initiated and as of 2015, 1475 hospitals participated, and 1461 (99%) of them submitted data throughout the year. Nationwide surveillance data collected over the past decade revealed that the prevalence of methicillin-resistantStaphylococcus aureushas decreased since 2008, and that its prevalence is higher in the western part of Japan, where the number of hospitals per capita is higher than in the eastern part.
Conclusions:JANIS CL division serves a model of sustainable national AMR surveillance system. Comprehensive data for all specimens promotes understanding of the sampling frequency and prevalence of AMR. As a well-established system for providing rich information to guide action both locally and nationally, JANIS may also be utilized for sharing AMR data globally.
Keywords:Antimicrobial resistance, Surveillance, Diagnostic microbiology laboratories, Comprehensive data collection
* Correspondence:suzukiss@niid.go.jp
Antimicrobial Resistance Research Center, National Institute of Infectious Diseases, 4-2-1 Aoba-cho, Higashi-Murayama, Tokyo 189-0002, Japan
Background
Antimicrobial resistance (AMR) is now recognized as a major threat to public health that limits patients’ treat-ment options for bacterial infections. In 2015, the 68th World Health Assembly adopted the Global Action Plan on Antimicrobial Resistance [1]. One of the five strategic objectives of the Global Action Plan is to strengthen knowledge through surveillance and research [2].
In Japan, methicillin-resistantStaphylococcus aureus
(MRSA) was one of the first pathogen that made health professionals realize that AMR is a real-world threat. MRSA was prevalent in healthcare settings in Japan in the 1980s, especially in surgical wards, where it causes post-surgery nosocomial infections [3]. Consecu-tively, multidrug-resistant Pseudomonas aeruginosa also emerged and spread in hospitals across Japan. This led the Ministry of Health, Labour and Welfare (MHLW) to es-tablish a surveillance system for nosocomial infections and AMR, the Japan Nosocomial Infections Surveillance (JANIS).
Common types of infectious disease surveillance are usually patient-based, with case definitions consisting of clinical diagnoses based on the symptoms and signs of the patient, often accompanied by diagnostic test re-sults [4]. By contrast, AMR surveillance must focus on the isolated pathogen rather than the patient. Microbio-logical test results of bacterial identification and anti-microbial susceptibility testing (AST) are the primary
components of AMR surveillance [5]. Therefore, many
existing AMR surveillance systems rely on data gener-ated by microbiology laboratories [6–9].
The main AMR surveillance component of JANIS is its Clinical Laboratory (CL) division, which collects data from diagnostic microbiology laboratories of hospitals. How-ever, the outstanding characteristic of the Japanese med-ical system is that it has one of the largest number of hospitals in the world [10]. In 2014, there were 8493 Japa-nese hospitals, by far exceeding 5627 hospitals in the United States [11]. The large number of hospitals results in dispersed healthcare resources, and more than 1000 hospitals run their own microbiology laboratories. There-fore, a practical surveillance system was required to con-tinuously accumulate data from those laboratories to achieve national surveillance. In this study, we aimed to propose a model of sustainable national AMR surveillance which overcame those barriers and creates not only na-tional reports but also benchmarking reports for each hos-pital to facilitate infection control practices.
Methods
Administration and surveillance sites of the JANIS CL division
JANIS is a voluntary surveillance funded by the MHLW and managed by the National Institute of Infectious
Diseases. It consists of five divisions; in addition to the CL division for AMR surveillance, there are divisions re-sponsible for surveillance of health care–associated in-fection. The JANIS steering committee, which makes recommendations for improving the surveillance, con-sists of experts in field of infectious diseases, infection prevention and control, and clinical microbiology. The committee was organized in 2007 when the surveillance was revised.
Surveillance sites of JANIS CL divisions was fixed to 468 hospitals who were enrolled to the project at the time of launching. These sites are hospitals with 200 or more beds that mainly provide acute care and have their own laboratories for diagnostic microbiology testing. After the revision of JANIS in 2007, annual recruitment of large hospitals with 200 or more beds was initiated, and only in 2014, that recruitment of small hospitals with less than 200 beds began. Today, hospitals without their own microbiology laboratories can also participate in JANIS if subscribing commercial laboratories are able to provide surveillance data.
Target data and data collection system
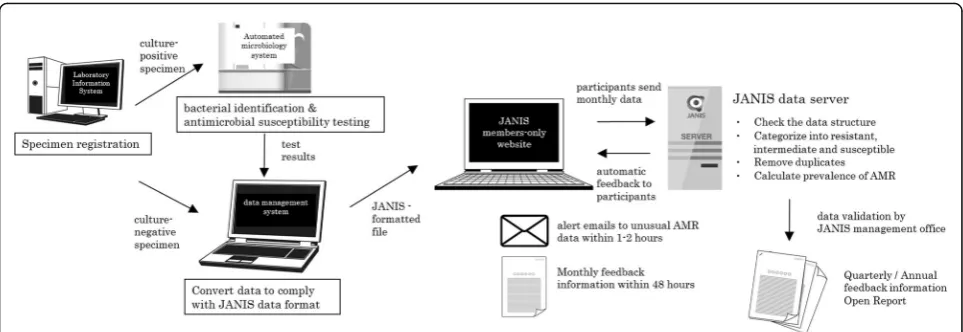
JANIS collects comprehensive specimen-based data from diagnostic microbiology laboratories. The type of target specimen was initially limited to blood and cere-brospinal fluids (CSF), but was subsequently expanded to all types of specimens in 2007. Because JANIS calcu-lates the prevalence of AMR by defining the number of patients with specific resistant bacteria as the numerator, and the number of specimen-submitting patients as the denominator, both positive results and culture-negative results are required. The number of specimen-submitting patients provides information on how fre-quent the samples are obtained from patients for micro-biological investigation in each hospital. It enables to assess the bias on prevalence of AMR due to the vari-ability in the frequency of culture sampling policy in participating hospitals. Specimens from active surveil-lance of hospitalized patients are included, but samples from the environment must be excluded from the sur-veillance data.
Figure1shows the data flow of the JANIS CL division. Isolates from culture-positive specimens are usually tested by the automated microbiology system for bacter-ial identification and AST. Both culture-positive and -negative results must be integrated and converted into JANIS-formatted files.
key elements for AMR surveillance. Manufacturers of la-boratory information systems have cooperated to pro-vide an export function in their systems that complies with the JANIS data format.
Data analysis for antimicrobial resistance
During the revision of the surveillance in 2007, JANIS ac-tivities became completely web-based and announcements from the surveillance are constantly updated on the web-site to provide necessary information for data submission. Each participant hospital submits surveillance data monthly by uploading the formatted file to the JANIS member–restricted website (Fig.1). Submitted files from participating hospitals are automatically processed to check data structure, interpret antimicrobial susceptibility, remove duplicates, and calculate the prevalence of AMR. The files include data of outpatient samples, but data ana-lysis is confined to inpatient samples.
To interpret AST results, minimal inhibitory concentra-tions (MICs) are categorized as resistant, intermediate, or susceptible (RIS) by the JANIS system. Interpretive criteria for antimicrobial susceptibility are mainly based on the Clinical and Laboratory Standards Institute (CLSI) guide-lines, in combination with some of the reporting criteria for drug-resistant bacterial infections defined by the Infectious Diseases Control Law in Japan (Additional file2) [12,13].
Removal of duplicates is conducted to accurately cal-culate the prevalence of AMR. Identical resistant bac-teria reported from the same patient within 30 days, regardless of specimen source, are excluded as dupli-cates. For antibiograms, removal of duplicates within 30 days is conducted based on AST results.
Data validation
Participating hospitals can check for errors in data struc-ture, warnings on ambiguous data, and microbiological
alerts presented on the JANIS member–restricted web-site within a few hours after data submission (Fig. 1). Simultaneously, alert emails are automatically sent to the contact personnel of facilities reporting unusual combinations of bacterial species and antimicrobial sus-ceptibility, defined as Unusual AMR (Additional file 3). Unusual AMR comprises two categories; Category A includes AMR that has never been officially reported in Japan such as vancomycin-resistant Staphylococcus aur-eus, whereas Category B includes AMR that have been re-ported but are still rare such as multidrug-resistant
Acinetobacterspp. and vancomycin-resistant enterococci. To validate quarterly and annual data, suspicious data such as data conversion errors (Additional file4) and re-ports of Unusual AMR are checked by emails, postcards, and phone calls. If no response is obtained, all data from the hospital where the suspicious data originated are ex-cluded from aggregation. Furthermore, a hospital will be expelled from JANIS if its data are excluded from annual reports for two consecutive years.
Data feedback to the public and participating hospitals
Quarterly and annual Open Reports only include fully submitted hospital data. In addition to aggregated data from all hospitals, reports of data stratified by hospital bed counts (large [≥200 beds] and small [< 200 beds]) were generated starting in Annual Open Report 2014. Moreover, reports of data geographically stratified by 47 prefectures were generated starting from Annual Open Report 2015. The Open Reports are available on the JANIS website after data validation [14].
[image:3.595.57.539.87.253.2]chart (Fig. 2), which represents the distribution of the prevalence of AMR of the facilities aggregated for the Open Report. The red dot within the box plot indicates the position of the facility in the whole distribution of its hospital type (large or small). This red dot within the box plot enables benchmarking, allowing hospital to evaluate its prevalence of AMR and infection control performance against those of other facilities. Three types of Feedback Reports are available: monthly, quarterly, and annual. Monthly feedback information is automatic-ally generated within 48 h of data submission in order to be useful to infection control committees in the facil-ities, whose meetings are typically held once a month. For annual Feedback Reports, in addition to the box plot charts on Open Reports stratified by hospital bed counts, data stratified by prefecture are also available. All of the Feedback Reports are available on the member-restrict JANIS web.
Result
Number of participating hospitals and representativeness
At the beginning of the surveillance in 2000, 468 hospi-tals were enrolled in the JANIS CL division, but the number of hospitals that submitted data was only 276 (59%) in 2001, decreasing to 210 (45%) in 2006. After the revision of the surveillance in 2007, due to annual recruitment and expansion of target hospitals, the number of JANIS member hospitals has been increas-ing constantly, reachincreas-ing 928 by the beginnincreas-ing of 2014.
In addition, because participation to JANIS CL division became one of the prerequisites for receiving additional reimbursement for infection control starting in April 2014, the number of member hospitals in 2015 in-creased dramatically, to 1.6 times the number in 2014. As of January 2017, there are 1840 JANIS member hos-pitals, which account for 21.7% of all hospitals through-out the country.
Figure3a shows the proportions of hospitals in Japan categorized by hospital bed count, and Fig.3bshows the proportion of JANIS member hospitals in each category. In Japan, about 70% of hospitals have < 200 beds, and such facilities were not targeted by the JANIS CL div-ision in 2000, when the surveillance was launched.
Therefore, in 2015, about 80% of hospitals with ≥500
beds are covered by JANIS, whereas only 4% of small hospitals (< 200 beds) are covered. Thus JANIS CL div-ision data may over-represent AMR epidemiology of large hospitals in Japan.
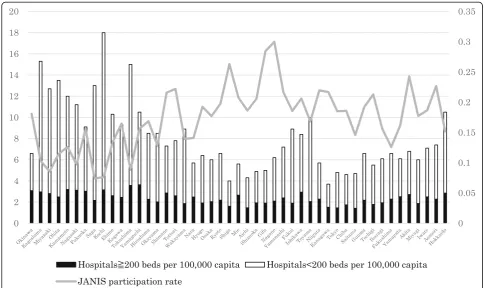
There are also geographical trends in JANIS partici-pation. Figure4 shows the proportion of JANIS partici-pation and the number of hospitals per 100,000 capita by prefecture in 2015, ordered from left (southwestern part of Japan) to right (northeastern part). The propor-tion of JANIS participapropor-tion among all hospitals varies by prefecture from 9.2 to 37.8% (median, 22.2%). Pre-fectures with low participation tend to have a larger number of hospitals per 100,000 capita, mainly consist-ing of small hospitals, and are especially concentrated in the western part of Japan.
[image:4.595.57.541.87.313.2]Data collection and analysis by the JANIS CL division
The number of specimens from which data was collected and analyzed for the Annual Open Report 2015 is shown in Table 1. In 2015, data were aggregated from more than seven million samples from 1435 JANIS member hospitals.
On average, the number of specimens from large hospitals was 1361.6 per 100 beds, 2-fold more than from small hos-pitals (696.8 samples per 100 beds). The most frequent type of sample from large hospitals was blood (32.0%), followed by respiratory samples (28.4%) and others (18.7%). On the
a
b
Fig. 3a) Number and proportions of hospitals, categorized by hospital bed count in Japan, according to Vital Statistics 2015.b) Proportion of JANIS member hospitals by bed counts for Annual Open Report 2015
[image:5.595.59.538.86.311.2] [image:5.595.55.541.427.715.2]other hand, for small hospitals, respiratory samples were most frequent (36.6%) followed by blood (26.5%) and urine (15.8%). The proportion of culture-positive specimens from small hospitals was higher than that from large hospitals.
Data validation
In 2015, among 1475 participating facilities, 1461 (99.1%) submitted data thorough out the year. Approximately 400 alert emails were automatically sent to participants who reported Unusual AMR in 2015.
Among 152 hospitals undergoing validation, data from 26 facilities were excluded from aggregation; 12 hospitals were using only the disk diffusion method for AST, and 14 hospitals either did not correct sus-picious data or did not respond to inquiries from the JANIS management office. Consequently, data from 97.3% (1435/1475) of the participating hospitals was aggregated for annual Open Report 2015.
Prevalence of AMR in open report
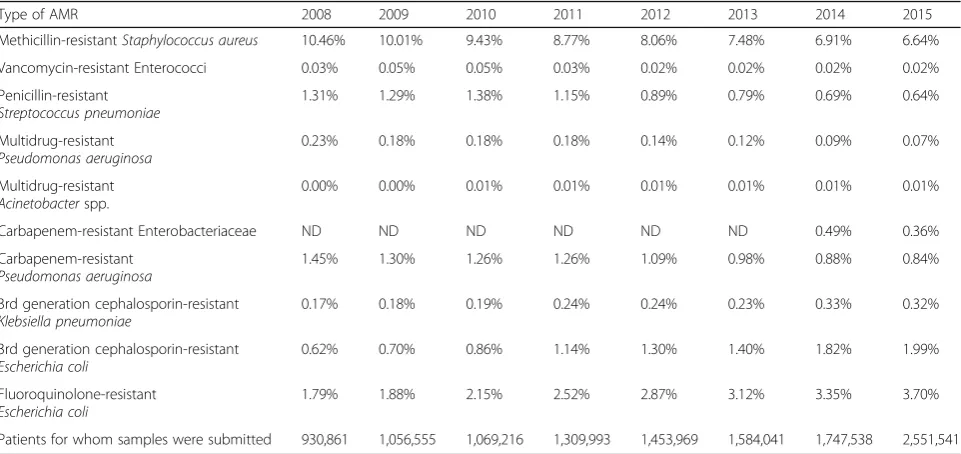
Table 2 shows the trend in AMR prevalence between
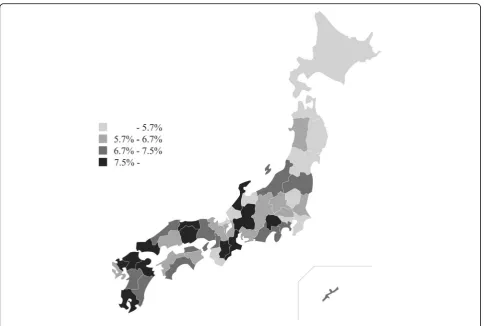
2008 and 2015, according to the JANIS Annual Open Reports. One of the most prevalent AMR bacteria in Japan is MRSA, which was detected in about 10% of clinical samples submitted for microbiological tests in 2008. However, its prevalence decreased constantly, dropping below 7% in 2014. There was also a geograph-ical difference in the prevalence of MRSA, as shown in Fig. 5, indicating higher prevalence in the western part of Japan.
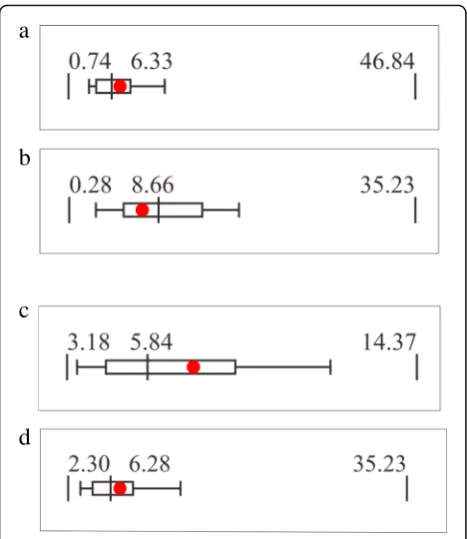
Feedback reports of JANIS
Figure 6a and bshow JANIS box plot charts of MRSA
from 2015 Feedback Reports of two hospitals that had different bed counts but identical prevalence of MRSA
(7.39%). Figure 6a is from a hospital with ≥200 beds
[image:6.595.59.540.99.228.2](large hospital), and Fig.6bis from a hospital with < 200 beds (small hospital). When stratified by hospital bed Table 1Number of specimens in Annual Open Report 2015 by hospital bed counts
Specimen source Hospitals≥200 beds (N= 1177) Hospitals < 200 beds (N= 258)
Number of specimens (%) Proportion of culture-positive specimens
Number of specimens (%) Proportion of culture-positive specimens
Respiratory 1,992,754 (28.4) 62.2% 99,273 (36.6) 70.9%
Urine 859,628 (12.3) 52.3% 42,697 (15.8) 67.6%
Feces 529,360 (7.5) 48.4% 18,950 (7.0) 49.3%
Blood 2,240,064 (31.9) 12.8% 71,851 (26.5) 15.8%
Cerebrospinal fluid 82,111 (1.2) 4.7% 1493 (0.6) 5.8%
Others 1,311,329 (18.7) 46.3% 36,617 (13.5) 48.7%
[image:6.595.58.539.504.731.2]Total 7,015,246 (100.0) 40.5% 270,881 (100.0) 50.9%
Table 2The trend of prevalence of AMR during 2008 to 2015
Type of AMR 2008 2009 2010 2011 2012 2013 2014 2015
Methicillin-resistantStaphylococcus aureus 10.46% 10.01% 9.43% 8.77% 8.06% 7.48% 6.91% 6.64%
Vancomycin-resistant Enterococci 0.03% 0.05% 0.05% 0.03% 0.02% 0.02% 0.02% 0.02%
Penicillin-resistant
Streptococcus pneumoniae
1.31% 1.29% 1.38% 1.15% 0.89% 0.79% 0.69% 0.64%
Multidrug-resistant
Pseudomonas aeruginosa
0.23% 0.18% 0.18% 0.18% 0.14% 0.12% 0.09% 0.07%
Multidrug-resistant
Acinetobacterspp.
0.00% 0.00% 0.01% 0.01% 0.01% 0.01% 0.01% 0.01%
Carbapenem-resistant Enterobacteriaceae ND ND ND ND ND ND 0.49% 0.36%
Carbapenem-resistant
Pseudomonas aeruginosa
1.45% 1.30% 1.26% 1.26% 1.09% 0.98% 0.88% 0.84%
3rd generation cephalosporin-resistant
Klebsiella pneumoniae
0.17% 0.18% 0.19% 0.24% 0.24% 0.23% 0.33% 0.32%
3rd generation cephalosporin-resistant
Escherichia coli
0.62% 0.70% 0.86% 1.14% 1.30% 1.40% 1.82% 1.99%
Fluoroquinolone-resistant
Escherichia coli
1.79% 1.88% 2.15% 2.52% 2.87% 3.12% 3.35% 3.70%
counts, the prevalence of MRSA in small hospitals is higher than that in large hospitals (9.37% vs 6.50%, re-spectively). Therefore, the same prevalence may be inter-preted differently when hospital type is taken into account. A MRSA prevalence of 7.39% is relatively high for a large hospital, and may require interventions for infection control, but the same prevalence in a small hospital can be interpreted as well controlled. The same phenomenon was observed when the data were stratified
by prefecture. Figure 6c and d are Feedback Reports
based on data stratified by 47 prefectures, with hospitals in which the MRSA prevalence was also 7.39% but that were located in different prefectures.
Discussion
From the beginning, JANIS was designed to collect com-prehensive bacterial data from hospital diagnostic micro-biology laboratories even though it was initially limited to blood and CSF samples. This seemed to be a promis-ing approach because both automated microbiology test systems and laboratory information systems became widely used in hospitals during early 2000’s. Hospitals already have the electronic data from their routine
bacteriological tests, which are supposed to be submitted monthly to JANIS.
Data collection focusing on blood and CSF samples minimizes heterogeneity and improves comparability be-tween reporting laboratories but information would be limited to invasive infection [15]. European Antimicro-bial Resistance Surveillance Network (EARS-Net) and Central Asian and Eastern European Surveillance of Antimicrobial Resistance focus on blood and CSF sam-ples [8,16]. In UK, antimicrobial resistance surveillance on routinely generated laboratory results has started in 1989, including the mandatory reporting of MRSA bacteremia to the Public Health England and its prede-cessors [7,17,18]. However, WHO Global Antimicrobial Resistance Surveillance System (GLASS) recommends comprehensive data collection at the national level to in-clude other species and specimen types beyond their pri-ority list [2].
[image:7.595.57.542.85.411.2]12 months after data submission, and limited internet access during that time period.
The revision of JANIS in 2007 was intended to settle these issues, and it was possible partly because most of the hospitals had improved their internet access by the middle of the 2000s. As a result of those systemic revi-sions and annual recruitment of participants, the num-ber of memnum-ber hospitals increased year by year, even though JANIS is a voluntary surveillance system. The in-clusion of participation in the JANIS CL division as a prerequisite for receiving additional reimbursement for infection control demonstrates that JANIS has been established as a sustainable national surveillance system.
Although the number of participating hospitals has been increased, the majority of participants are large hospitals, and only about 4% of small hospitals with less than 200 beds were covered by the JANIS CL division in 2015. Thus, JANIS CL division data may over-represent AMR epidemiology of large hospitals in Japan. This may be because small hospitals usually do not have their own microbiology laboratories and their subscribing commer-cial laboratories may not provide surveillance data. In addition, in the absence of their own microbiology la-boratories, these hospitals are unlikely to employ profes-sionals who can interpret and utilize feedback from the
JANIS CL division. How to collect and analyze surveil-lance data from those small hospitals is an important issue for JANIS to address in the future, and these ques-tions are also critical for AMR surveillance systems in general. The EARS-Net also pointed out the over-repre-sentation of large hospitals, and also noted that tertiary care hospitals are much more likely to participate in this surveillance than smaller hospitals [19].
In addition, even if the coverage of small hospitals were increased, interpretation of surveillance data re-quires careful consideration of the denominator due to variability in the frequency of culture sampling. The So-ciety for Healthcare Epidemiology and the Healthcare Infection Control Practices Advisory Committee sug-gests calculating prevalence of AMR per 100 patients or 1000 patient-days admitted to the hospital [20]. How-ever, because AMR can only be detected by specimen submission, JANIS calculates the prevalence of AMR by defining the denominator as the number of patients for whom specimens were submitted. Moreover, one of the metrics to measure the occurrence of AMR proposed by WHO GLASS is to have the total number of sampled patients per specimen type as the denominator. To our knowledge, JANIS is the only national surveillance that truly collects and analyzes comprehensive data, includ-ing active surveillance testinclud-ing and cultunegative re-sults for all specimens [21]. Data for all specimens can provide information about how samples were submitted from each hospital. These data revealed that the number of samples per 100 beds for small hospitals is half of that of large hospitals, and more sterile samples such as blood cultures are obtained in large hospitals, whereas more easy-to-obtain samples (such as respiratory and urine samples) are collected in small hospitals. Inversely, the proportion of culture-positive specimens of small hospitals is higher than that of large hospitals, indicating minimal bacterial investigation in small hospitals, which may overestimate the prevalence of AMR. The higher prevalence of MRSA in the western part of Japan may partially be explained by that there are more small hos-pitals per 100,000 capita in that region, and the sampling frequency is low in that type of hospital.
Quality assurance of diagnostic microbiology labora-tories and data validation is fundamental to AMR sur-veillance, especially for a system that collects data but not bacterial isolates to be tested in a central reference laboratory. One reason that JANIS CL division initially targeted only large hospitals was to ensure data reli-ability, as those hospitals are expected to employ clin-ical microbiology professionals. The diffusion of automated microbiology test systems among hospital laboratories in Japan guarantees the basic quality of microbiological tests because the manufacturers of those systems provide quality assurance services to the
a
b
c
d
[image:8.595.57.291.86.356.2]custom hospitals. There are a few domestic external quality assessment (EQA) programs in which most of the JANIS member hospitals with in-house laborator-ies may be enrolled. Large commercial laboratorlaborator-ies are also enrolled in internationally approved EQA, but those programs are difficult to afford for hospitals and small commercial laboratories. Accordingly, a national scheme for laboratory quality assurance is required. Data validation for Unusual AMR by the JANIS CL division could play a certain role in quality assurance because it would inform hospitals what type of micro-biology test results requires confirmation.
The accumulation of nationwide surveillance data over a decade enables us to describe the long-term trends in AMR prevalence. There are encouraging findings that AMR of major clinically important bacterial species in Japan is decreasing or maintained at a low level. For in-stance, the prevalence of MRSA and multidrug-resistant
Pseudomonas aeruginosa has been decreasing since 2008, to around half (or less) of the previous levels. It is also notable that multidrug-resistant Acinetobacter spp. (MDRA), which are prevalent in many Asian countries, are still well controlled in Japan [22]. On the other hand, antimicrobial resistance amongEscherichia colikeeps in-creasing as many other countries.
Even though the principal purpose of JANIS is to create national AMR profiles, it was initiated to support infection prevention and control in medical facilities. Feedback Re-ports to each participating hospital are created to raise awareness of infection control practices and to motivate data submission through the box plot chart, which intui-tively benchmarks the prevalence of AMR of each facility against the entire distribution. To enable this benchmark-ing, JANIS collects MIC values rather than interpreted RIS because there are different standards and frequent up-dates for the categorization of RIS. In addition, JANIS ap-plies a unified de-duplication program to exclude repeated isolates from the same patients.
Stratification by hospital bed counts and prefectures re-vealed different distributions of AMR prevalence among hospital types and geographical regions. This indicates that the goals of AMR containment should be set in con-sideration of local factors, and that regional cooperation is essential. In fact, several regional networks share JANIS files to create their local antibiograms.
There are several limitations of the JANIS CL division, suggesting opportunities for improvement. WHO GLASS requires data on AMR combined with patient and micro-biological information. All of them are included as data el-ements in JANIS data format but currently clinical data are rarely reported because of the different data sources. If integration of patient and microbiological information in each facility became more feasible, it may become possible to fulfil GLASS requirement.
Inclusion of data from small hospitals is challenging, but collection of such data has been gradually increas-ing; in 2017, 8.5% of 5800 small hospitals are participat-ing in JANIS, almost double the number from 2015. Population-based AMR surveillance, which captures AMR data from an entire predefined population or a representative sample, is considered to be the gold standard for surveillance [4]. However, laboratory-based surveillance covering a small number of sentinel sites (fewer than 20% of national hospitals) is considered to be sufficient to provide relatively robust estimates of national AMR prevalence, assuming that the sampling is constant and the sample is representative of the tar-get population [15]. Therefore, increasing sampling fre-quency, especially prior to treatment with antibiotics, may increase the representativeness of the JANIS Open Report for small hospitals more effectively than recruit-ing additional hospitals. Moreover, data validation is a challenge for small hospitals without microbiology staff. Accordingly, support of regional hospital networks is required for purposes of education.
Conclusions
JANIS achieved sustainability as a national AMR surveil-lance by initially focusing on large hospitals with diag-nostic microbiology laboratories in order to establish the management scheme of the surveillance. Comprehensive data for all specimens promotes understanding of the sampling frequency and prevalence of AMR. Because JANIS is a well-established system for providing rich in-formation to guide action both locally and nationally, it may also be utilized for sharing AMR data globally.
Additional files
Additional file 1:Data format of JANIS Clinical Laboratory division. -All data fields are fixed-length. If the input data string is shorter than the specified length, the remainder needs to be filled with single-byte spaces (i.e., 0 × 20 or“”). Data requirements:“M”, mandatory;“S”, suggested. (M) and (S) indicate that the field may be left blank if the data are not rele-vant. (DOCX 33 kb)
Additional file 2:Interpretive Criteria for Specific AMR Bacteria. (DOCX 31 kb)
Additional file 3:Definition of Unusual AMR bacteria. Category A: AMR bacteria never reported in Japan. Category B: AMR bacteria rarely reported in Japan. RIS interpretation is based on the CLSI 2012 (M100-S22) criteria.† Criteria are based on the Infectious Diseases Control Law. (DOCX 28 kb) Additional file 4:Data validation criteria for annual Open Report 2015. (DOCX 26 kb)
Abbreviations
Acknowledgements
We are grateful to all the hospitals that have participated and contributed data to JANIS, and to the members of the JANIS steering committee and the JANIS management office at NIID, Japan.
Funding
Research Program on Emerging and Re-emerging Infectious Diseases from the Japan Agency for Medical Research and Development (grant numbers 17fk0108307j0103) and JSPS KAKENHI Grant Number JP 15 K08863.
Availability of data and materials
The datasets analysed during the current study are available in the JANIS official website in Japanese (https://janis.mhlw.go.jp/index.asp) and partly in English (https://janis.mhlw.go.jp/english/index.asp).
Authors’contributions
AT contributed to data analysis, interpretation of the results and drafted the manuscript. SS designed the study and revised the manuscript. Both authors approved the final manuscript.
Ethics approval and consent to participate
Not applicable.
Consent for publication
Not applicable.
Competing interests
The authors declare that they have no competing interests.
Publisher’s Note
Springer Nature remains neutral with regard to jurisdictional claims in published maps and institutional affiliations.
Received: 6 December 2017 Accepted: 3 October 2018
References
1. World Health Organization. Global Action Plan on Antimicrobial Resistance.
http://apps.who.int/iris/bitstream/10665/193736/1/9789241509763_eng. pdf?ua=1.
2. World Health Organization. Global Antimicrobial Resistance Surveillance System.http://www.who.int/drugresistance/surveillance/GLASSmeeting/en/. 3. Morikane K. Infection control in healthcare settings in Japan. J Epidemiol.
2012;22(2):86–90.
4. Van Beneden CA, Olsen SJ, Skoff TH, Lynfield R. Active, population-based surveillance for infectious diseases. In: Infectious diseases Surveillance edn. Massachusetts: Blackwell; 2007. p. 32–43.
5. Stelling JM, O'Brien TF. Surveillance of antimicrobial resistance: the WHONET program. Clin Infect Dis. 1997;24(Suppl 1):S157–68.
6. Vlek AL, Frentz D, Haenen A, Bootsma HJ, Notermans DW, Frakking FN, de Greeff SC, Leenstra T, group I-As. Detection and epidemiology of carbapenemase producing Enterobacteriaceae in the Netherlands in 2013-2014. Eur J Clin Microbiol Infect Dis. 2016;35(7):1089–96.
7. Johnson AP. Surveillance of antibiotic resistance. Philos Trans R Soc Lond Ser B Biol Sci. 2015;370(1670):20140080.
8. European Antimicrobial Resistance Surveillance Network (EARS-Net). Antimicrobial resistance surveillance in Europe 2014.http://ecdc.europa.eu/ en/publications/Publications/antimicrobial-resistance-europe-2014.pdf. 9. Coombs GW, Daley DA, Thin Lee Y, Pearson JC, Robinson JO, Nimmo
GR, Collignon P, Howden BP, Bell JM, Turnidge JD, et al. Australian group on antimicrobial resistance Australian Staphylococcus aureus sepsis outcome Programme annual report, 2014. Commun Dis Intell Q Rep. 2016;40(2):E244–54.
10. OECD.Stat.http://stats.oecd.org/viewhtml.aspx?datasetcode=HEALTH_ REAC&lang=en#.
11. American Hospital Association. Fast Facts on US Hospitals. Fast Facts 2016.
https://www.statista.com/statistics/185843/number-of-all-hospitals-in-the-us-since-2001/.
12. Izumida M, Nagai M, Ohta A, Hashimoto S, Kawado M, Murakami Y, Tada Y, Shigematsu M, Yasui Y, Taniguchi K. Epidemics of drug-resistant bacterial
infections observed in infectious disease surveillance in Japan, 2001-2005. J Epidemiol. 2007;17(Suppl):S42–S47.
13. Clinical and Laboratory Standards Institute. Performance Standards for Antimicrobial Susceptibility Testing; Twenty-Seventh Informational Supplement M100-S27. Wayne: CLSI; 2017.
14. Ministry of Health, Labour and Welfare. Japan Nosocomial Infections Surveillance (JANIS): Annual Open Report 2015.
15. Grundmann H. Towards a global antibiotic resistance surveillance system: a primer for a roadmap. Ups J Med Sci. 2014;119(2):87–95.
16. Central Asian and Eastern European Surveillance of Antimicrobial Resistance (CAESAR). Annual report 2014.http://www.euro.who.int/__data/assets/pdf_ file/0006/285405/CAESAR-Surveillance-Antimicrobial-Resistance2014.pdf. 17. Johnson AP, Davies J, Guy R, Abernethy J, Sheridan E, Pearson A, Duckworth
G. Mandatory surveillance of methicillin-resistant Staphylococcus aureus (MRSA) bacteraemia in England: the first 10 years. J Antimicrob Chemother. 2012;67(4):802–9.
18. Bou-Antoun S, Davies J, Guy R, Johnson AP, Sheridan EA, Hope RJ. Descriptive epidemiology of Escherichia coli bacteraemia in England, April 2012 to march 2014. Euro Surveill. 2016;21(35).
19. de Kraker ME, Stewardson AJ, Harbarth S. Will 10 million people die a year due to antimicrobial resistance by 2050? PLoS Med. 2016;13(11):e1002184. 20. Cohen AL, Calfee D, Fridkin SK, Huang SS, Jernigan JA, Lautenbach E, Oriola
S, Ramsey KM, Salgado CD, Weinstein RA, et al. Recommendations for metrics for multidrug-resistant organisms in healthcare settings: SHEA/ HICPAC position paper. Infect Control Hosp Epidemiol. 2008;29(10):901–13. 21. World Health Organization. Global Antimicrobial Resistance Surveillance
System (GLASS) Report: Early implementation 2016–2017.http://www.who. int/glass/resources/publications/early-implementation-report/en/. 22. Kamolvit W, Sidjabat HE, Paterson DL. Molecular epidemiology and