Theme 2
Economy and finance Series Β
Short-term trends
ISSN 1011-0844
ECU-EMS information
2-3 D 1992
Monthly
SHARP RISE IN ECU BOND ISSUES AFTER THE MAASTRICHT SUMMIT
Taking the date of payment as a reference, ECU 33 600 million was raised on the bond markets (Euro and national issues) in 1991, representing a monthly average of approximately ECU 2 800 million. In January and February 1992, again using the date of payment as a reference, ECU 4 100 million and ECU 5 400 million respectively were raised and new issues are now being announced in rapid succession (see pages 5 and 12). It can be seen that the Kingdom of Denmark has gone ahead with the expected issue of ECU 1 000 million at 8.5% over ten years (+300 million retained to regulate the market, details in the next issue of this bulletin).
On 16 January the Greek authorities issued a new series of three bonds linked to the ecu, with one-, two- and three-year maturities, for a total of ECU 479 million. In addition, on 19 March UBS-P&D issued a variable-rate (Libor + 0.875%) loan of ECU 200 million over four years on behalf of the Bank of Greece.
On 10 March the French Treasury issued a new tranche of ECU 125 million to its 8.5% OAT maturing on 12 May 1997. It will be remembered that this OAT had been the subject of an offer of exchange in April 1991. After this exchange, the total amount of this bond line was only ECU 648 million. On 1 March the French Treasury issued a new tranche of ECU 225 million to this OAT, bringing its current total to ECU 998 million and the overall total of the five French ecu-denominated OATs to some ECU 9 300 million at the end of March.
As regards short-term securities, on 21 February 1992 the Italian Treasury issued a new 369-day ecu-denominated bill for a total of ECU 750 million and the Bank of England continued its programme of issuing one-, three- and six-month bills (detailed figures available from Eurostat on request).
On the futures markets, the Matif contract on long-term interest rates saw considerable volumes of trading in January and February (nearly 5 000 contracts per day compared with just over 2 000 on an average day in 1991) and the number of existing contracts (open interest) at the end of February (11 252) is at its highest level since the contract was launched in October 1990. Moreover, the Finex (New York, USA) futures contract on exchange rates will be traded 24 hours a day from now on.
Caution should be exercised when interpreting the annual average rate of price changes for 1991 (+3.5%, calculated over 12 months in ecus) which was published in this bulletin for the countries participating in the EMS exchange rate mechanism. This figure represents the difference between the annual average indices for 1991 and those for 1990 (1985 = 100), but it must be borne in mind that the United Kingdom, which recorded a very sharp slowdown in price changes for the period 1990-1991, did not feature in this index until October 1990. By way of comparison, for 1991 the annual average rate of change over 12 months for the countries participating in the exchange rate mechanism (including the UK) was 4.6%, which is only 0.1% less than the corresponding index calculated for EUR
12 (see page 7).
Lastly, the first meeting of the Commission Working Party on Ecu Statistics was held on 25 March 1992 in Luxembourg, involving representatives from the twelve Member States and observers from the EFTA countries and the international institutions concerned. The discussions considered various ways of improving ecu statistics. The Commission will continue to calculate reference interest rates for the ecu. Finally, it was agreed that in future certain private-sector organizations could participate in the work of the Working Party when items on the agenda so required.
eurostat
OFICINA ESTADÍSTICA DE LAS COMUNIDADES EUROPEAS DE EUROPÆISKE FÆLLESSKABERS STATISTISKE KONTOR STATISTISCHES AMT DER EUROPÄISCHEN GEMEINSCHAFTEN ΣΤΑΤΙΣΤΙΚΗ ΥΠΗΡΕΣΙΑ ΤΩΝ ΕΥΡΩΠΑΪΚΩΝ ΚΟΙΝΟΤΗΤΩΝ STATISTICAL OFFICE OF THE EUROPEAN COMMUNITIES OFFICE STATISTIQUE DES COMMUNAUTÉS EUROPÉENNES ISTITUTO STATISTICO DELLE COMUNITÀ EUROPEE
BUREAU VOOR DE STATISTIEK DER EUROPESE GEMEENSCHAPPEN SERVIÇO DE ESTATÍSTICA DAS COMUNIDADES EUROPEIAS
L-2920 Luxembourg - Tél. 43011 - Télex: Comeur Lu 3423
B-1049 Bruxelles, bâtiment Berlaymont, rue de la Loi 200 (bureau de liaison) - Tél. 2351111
Note
For any
tel.
Fax
information on
43014785 43013288
43014150
the statistics in this bulletin
T. G.
Mathisse Thouvenin
contact Luxe η bourg:
Contents
I. II. III. IV. V. VI. VII.
A graph of the bilateral fluctuations of the ERM currencies. Yearly and monthly issues of ecu bonds.
EMCF rate, interest rates on ecu deposits and yields on ecu bonds. Last month's ecu bond issues.
Consumer price indices in national currencies. Consumer price indices in ecus.
Yearly, monthly and daily ecu exchange rates.
ECSC-EEC-EAEC, Brussels · Luxembourg, 1992
Reproduction is authorized, except for commercial purposes, provided the source is acknowledged.
TABLE I
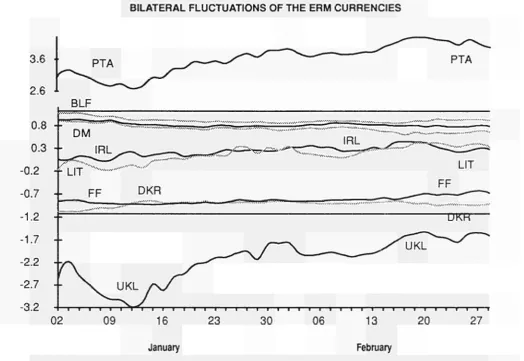
BILATERAL FLUCTUATIONS OF THE ERM CURRENCIES
3.6 ■·
2.6
ABLF
0.8
0.3
-0.2
-0.7
-1.2
--
TJKFT
January February
CENTRAL RATES AND INTERVENTION LIMIT RATES, IN FORCE SINCE 8 OCTOBER 1990, FOR THE CURRENCIES OF COUNTRIES PARTICIPATING IN THE EMS EXCHANGE MECHANISM.
+ 100 BLF =...
+ 100 DKR =...
+ 100 DM =...
+ 100 FF
+ 100 HFL =...
+ 1 IRL =...
+ 1000 LIT «...
+ 100 PTA =...
+ 1 UKL =...
BLF DKR DM FF HFL IRL LIT PTA UKL
18.9143 4.95900 16.6310 5.58700 1.85100 3710.20 334.619 1.74510 100 18.4938 4.84837 16.2608 5.46286 1.80981 3627.64 315.143 1.64352 18.0831 4.74000 15.8990 5.34150 1.76950 3546.90 296.802 1.54790 553.000 26.8100 89.9250 30.2100 10.0087 20062.0 1809.40 9.43610 540.723 100 26.2162 87.9257 29.5389 9.78604 19615.4 1704.05 8.88687 528.700 25.6300 85.9700 28.8825 9.56830 19179.0 1604.90 8.36970 2109.50 390.160 343.050 115.2350 38.1825 76540.0 6901.70 35.9970 2062.55 381.443 100 335.386 112.6730 37.3281 74821.7 6500.00 33.8984 2016.55 373.000 327.920 110.1675 36.4964 73157.0 6121.70 31.9280 628.970 116.320 30.4950 34.3600 11.3830 22817.0 2057.80 10.7320 614.977 113.732 29.8164 100 33.5953 11.1299 22309.1 1938.06 10.1073 601.295 111.200 29.1500 32.8475 10.8825 21813.0 1825.30 9.5191 1872.15 346.240 90.7700 304.440 33.8868 67912.0 6125.30 31.9450 1830.54 338.537 88.7526 297.661 100 33.1293 66405.3 5768.83 30.0853 1789.85 331.020 86.7800 291.040 32.3939 64928.0 5433.10 28.3340 56.5115 10.4511 2.74000 9.18900 3.08700 2050.03 184.892 0.964240 55.2545 10.2186 2.67894 8.98480 3.01848 1 2004.43 174.131 0.908116 54.0250 9.99130 2.61900 8.78500 2.95100 1959.84 163.997 0.855260 28.1930 5.21400 1.36700 4.58450 1.54000 0.510246 92.2400 0.481050 27.5661 5.09803 1.33651 4.48247 1.50590 0.498895 1000 86.8726 0.453053 26.9530 4.98500 1.30650 4.38300 1.47250 0.487799 81.8200 0.426690 33.6930 6.23100 1.63300 5.47850 1.84050 0.609772 1222.30 0.553740 31.7316 5.86837 1.53847 5.15981 1.73345 0.574281 1151.11 100 0.521514 29.8850 5.52600 1.44900 4.85950 1.63250 0.540858 1084.10 0.491160 64.6050 11.9479 3.13200 10.50550 3.52950 1.16920 2343.62 203.600
60.8451 11.2526 2.95000 9.89389 3.32389 1.10118 2207.25 191.750 1 57.3035 10.5976 2.77800 9.31800 3.13050 1.03710 2078.79 180.590
1 F C U = 1 42.4032 7.84195 2.05586 6.89509 2.31643 0.767417 1538.24 133.631 0.696904
[image:3.595.32.557.44.405.2]TABLE II
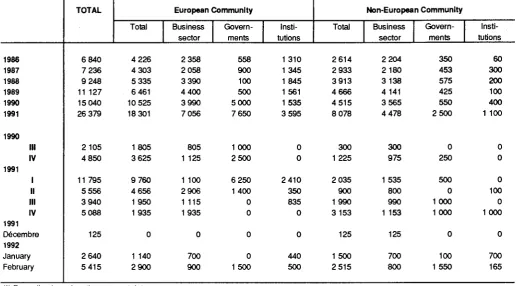
ECU BOND ISSUES (Mio ECU) '
1986 1987 1988 1989 1990 1991 1990
1991
1991 III IV I II III IV Décembre 1992 January February
TOTAL
6 840 7 236 9 248 11 127 15040 26 379
2105 4 850 11 795
5 556 3 940 5088 125 2 640 5 415
European Community Total
4 226 4 303 5 335 6 461 10 525 18 301
1 805 3 625 9 760 4 656 1 950 1 935 0 1 140 2900
Business sector
2358 2 058 3 390 4 400 3990 7 056
805 1 125 1 100 2906 1 115 1935
0 700 900
Govern-ments 558 900 100 500 5000 7 650
1000 2500 6 250 1400 0 0 0 0 1 500
Insti-tutions
1 310 1 345 1 845 1 561 1535 3 595
0 0 2410 350 835 0 0 440 500
Non-European Community Total
2 614 2 933 3913 4666 4 515 8 078
300 1 225 2 035 900 1 990 3 153 125 1 500 2 515
Business sector
2204 2 180 3 138 4 141 3 565 4 478
300 975 1 535 800 990 1 153
125 700 800
Govern-ments
350 453 575 425 550 2500
0 250 500 0 1 000 1 000 0 100 1 550
Insti-tutions
60 300 200 100 400 1 100
0 0 0 100 0 1 000 0 700 165 Recording based on the payment date
TABLE III
OPERATIONS RATES OF THE EMCF (CALCULATION MONTH) AND INTEREST RATES AND YIELDS OF ECU INVESTMENTS (%)
EMCF Deposits
1 month 3 months 6 months 1 year
Bonds
< 5 years 5-7 years > 7 years
1988 1989 1990 1991 1991 February March April May June July August September October November December 1992 January February
6.71 9.25 10.52 10.06
10.75 10.50 10.25 10.00 9.75 10.00 9.75 10.00 9.75 9.75 10.25 10.25 10.25
6.67 9.10 10.07 9.73
10.11 9.62 9.28 9.23 9.67 9.92 9.70 9.64 9.64 9.69 9.69 10.31 10.11
6.88 9.30 10.32 9.80
10.41 9.78 9.30 9.28 9.56 9.89 9.84 9.76 9.66 9.75 9.88 10.26 10.11
7.05 9.41 10.55 9.84
10.48 9.86 9.33 9.33 9.55 9.95 9.94 9.88 9.67 9.81 9.88 10.15 10.09
7.18 9.49 10.69 9.83
10.52 9.94 9.34 9.39 9.46 9.87 9.92 9.91 9.72 9.78 9.88 9.95 9.92
7.70 8.86 10.83 9.73
10.55 10.04 9.70 9.63 9.51 9.64 9.77 9.82 9.56 9.40 9.51 9.30 9.32
7.89 8.70 10.42 9.19
9.99 9.30 9.20 9.07 9.00 9.12 9.24 9.23 9.03 8.99 9.10 8.74 9.65
8.18 8.76 10.37 9.15
TABLE IV
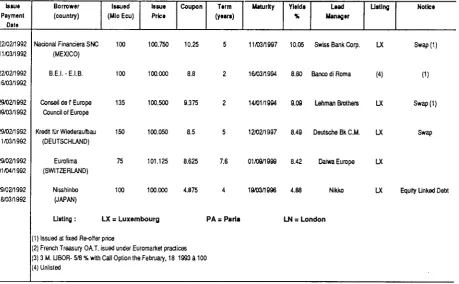
LAST MONTH'S ECU BOND ISSUES
Issue
Payment Date
25/01/1992 12/02/1992
25/01/1992 10/02/1992
25/01/1992 07/02/1992
25/01/1992 31/01/1992
01/02/1992 18/02/1992
01/02/1992 17/02/1992
01/02/1992 12/02/1992
01/02/1992 12/02/1992
01/02/1992 13/02/1992
08/02/1992 20/02/1992
08/02/1992 18/02/1992
.702/1992 04/02/1992
02/02/1992
15/02/1992 17/03/1992
15/02/1992 15/03/1992
15/02/1992 11/03/1992
22/02/1992 12/03/1992
25/01/1992 04/03/1992
Borrower (country)
FRANCE
SOUTH AFRICA
Council of Europe Conseil de l'Europe
C.E.E - E.E.C.
B.E.I.-E.I.B.
FINLAND
City of Gothenburg (SWEDEN)
Kredit für Wiederaufbau (DEUTSCHLAND)
British Gas (UNITED KINGDOM)
Kommuninvest I Orebro Lan AB (SWEDEN)
Council of Europe Conseil de l'Europe
OeKB (AUSTRIA)
Exportfinans A/S (NORWAY)
Credit Foncier de FRANCE
Statens Bostadsfinan-sieringaktiebolag
(SWEDEN)
Eutelsat
C.E.E-E.E.C.
General Electie Corp. (U.S.A.)
Issued (Mio Ecu)
1500
250
65
190
500
500
50
250
150
100
100
50
250
1000
300
200
490
75
Issue Price
98.640
100.000
101.775
101.500
100.000
99.620
103.125
101.585
99.700
101.975
100.490
101.225
99.950
100.350
99.700
99.850
100.650
100.100
Coupon
8.250
10.375
8.380
8.375
(3)
8.375
9.125
8.500
8.375
8.875
9.375
9.000
8.750
8.375
8.625
8.625
8.625
9.250
Term (years)
30
5
2
7
10
7
5
5
5
5
2
2
4
12
5
5
5
2
Maturity
25/04/2022
10/02/1997
14/01/1994
01/02/1999
18/02/2002
19/02/1999
24/01/1997
12/02/1997
13/02/1997
20/02/1997
01/01/1994
04/02/1994
27/02/1996
17/03/2004
03/03/1997
11/03/1997
15/12/1997
04/03/1994
Yields %
8.25
10.38
8.38
8.09
8.45
8.34
8.11
8.45
8.38
91.00
8.31
8.77
8.38
8.70
8.66
8.46
9.19
Lead Manager
Credit Lyonnais
Paribas C.M.
Bankers Trust Int.
Warburg SG
U.B.S. P&D
Yamaiachi Int.
Swiss Bank Corp.
Deutsche Bk CM.
Deutsche Bk CM.
Daiwa Europe
Lehman Brothers
Paribas CM.
Nikko Europe
Paribas CM.
U.B.S. P&D
Credit Lyonnais
Morgan Stanley
U.B.S. P&D
Listing
PA
LX
LX
LX
LX
LX
LX
LX
LN
LX
LX
LX
LN
LXPA
LX
LX
LX
LX
Notice
(D(2)
(D
Swap
FRN
(1)
Swap
Swap(1)
Swap(1)
Swap(1)
Swap
Swap(1]
TABLE V
CONSUMER PRICE INDICES IN NATIONAL CURRENCY
1985=100 B DK D ELL E F IRL I L NL Ρ UK EUR 12 ERM 1970 34.9 26.8 50.4 10.3 13.5 25.3 15.6 14.2 37.0 40.0 6.4 19.6 25.4 29.8
1980 1986
71.2 101.3 68.3 103.6 82.6 99.9 39.1 123.0 56.2 108.8 63.3 102.7 56.1 103.8 52.5 105.8 70.3 100.3 81.8 100.2 35.2 111.7 70.7 103.4 65.3 103.5 66.7 102.3 1987 102.9 107.8 100.1 143.2 114.5 105.9 107.1 110.9 100.2 99.8 122.2 107.7 106.9 104.7 1988 104.1 112.7 101.4 162.5 120.0 108.7 109.4 116.5 101.7 100.6 133.9 113.0 110.7 107.6 1989 107.3 118.1 104.2 184.9 128.2 112.7 113.9 123.7 105.1 101.7 150.8 121.8 116.4 111.9 1990 111.0 121.2 107.0 222.6 136.8 116.3 117.6 131.8 109.0 104.3 170.9 133.3 123.0 116.9 1991 07 114.6 114.9 124.1 124.0 110.7 111.5 264.7 264.1 145.0 145.4 120.0 120.2 121.3 120.6 140.2 140.4 112.4 112.5 108.4 109.0 189.5 190.4 141.1 141.4 129.1 129.4 122.4 122.0 08 115.3 124.2 111.5 263.5 146.0 120.4 122.2 140.9 112.8 109.4 191.7 141.7 129.7 122.8 09 115.2 124.9 111.7 273.8 147.1 120.6 122.2 141.6 113.1 110. t
192.1 142.3 130.3 122.5 1991 10 115.6 125.1 112.0 279.8 148.1 121.1 122.2 142.3 113.4 110.5 193.3 142.8 130.9 124.8 11 115.9 125.7 112.5 284.6 148.3 121.5 123.0 143.3 114.0 110.7 194.3 143.3 131.4 125.2 12 115.7 125.3 112.6 289.1 148.4 121.6 123.0 143.7 114.1 110.6 195.5 143.5 131.6 125.3 1992 01 116.0 125.1 113.1 289.4 150.6 122.0 122.9 144.8 114.5 110.3 197.3 143.3 132.0 125.3
Annual rate of Increase (%)
B DK D ELL E F IRL I L NL Ρ UK EUR 12 ERM
EUR 12
ERM EUR 12 ERM 61-70 3.0 6.0 2.7 2.1 6.1 4.1 4.8 4.0 2.6 4.2 4.5 4.1 3.7 3.3 0.8 0.7 1.7 1.2
71-80 1986
7.4 1.3 9.8 3.6 5.1 -0.2
14.5 23.1 15.4 8.8 9.7 2.7 13.7 3.8 14.1 5.8 6.7 0.3 7.4 0.3 18.7 11.7 13.8 3.4 9.9 3.2 8.4 2.2 3.5 2.8 3.0 1.8 4.8 3.9 3.3 2.5 1987 1.6 4.0 0.2 16.1 5.3 3.1 3.1 4.8 -0.1 -0.2 9.4 4.1 3.4 2.4 1.9 1.8 3.8 2.8 1988 1.2 4.6 1.2 13.5 4.8 2.7 2.1 5.1 1.4 0.9 9.6 4.9 3.6 2.7 1.8 1.4 Dis 2.8 1.9 1989 3.1 4.8 2.8 13.8 6.8 3.7 4.1 6.2 3.3 1.1 12.6 7.8 5.1 4.0 Aver 2.2 1.4 parity be 4.1 2.9 1990 3.4 2.6 2.7 20.4 6.7 3.2 3.2 6.5 3.7 2.5 13.3 9.4 5.7 4.5 age devi 2.7 1.8 tween fr 3.5 2.3 1991 07 3.2 3.8 2.4 2.9 3.5 4.4 18.9 18.3 6.0 6.1 3.2 3.4 3.1 3.1 6.4 6.7 0.1 3.8 3.9 4.7 10.9 11.3 5.9 5.5 5.0 5.3 4.7 5.0
ation around the mea
1.8 1.4 1.4 1.1
e average and therr
TABLE VI
CONSUMER PRICE INDICES IN ECU
1985=100 Β DK D ELL E F IRL ! L NL Ρ UK EUR 12 ERM ECU 1970 30.9 28.0 30.0 34.9 24.5 30.3 25.9 32.2 32.5 27.1 28.3 27.1 29.5 30.3 29.9
1980 1986
78.7 103.9 70.0 104.7 72.9 104.5 68.6 93.1 72.7 102.0 73.1 102.4 58.5 101.1 63.8 104.7 77.7 102.8 74.4 104.8 65.8 98.8 69.7 91.0 70.9 101.3 71.3 104.0 71.7 102.1 1987 107.3 109.7 107.6 95.3 103.9 103.8 98.5 107.2 104.6 107.3 97.7 90.0 103.1 106.5 104.3 1988 107.6 113.7 108.8 100.9 112.5 105.0 100.6 109.6 105.2 108.2 102.3 100.2 106.8 108.0 106.9 1989 111.1 117.7 112.1 107.5 126.8 108.8 104.4 118.5 108.8 109.4 112.9 106.6 112.5 112.9 111.3 1990 117.5 123.7 116.1 114.9 136.4 114.3 109.3 125.2 115.4 113.2 122.6 110.0 117.8 119.0 117.0 1991 07 121.9 122.1 125.8 125.2 120.2 120.8 122.2 122.3 145.5 145.7 116.9 117.1 112.7 112.3 132.2 132.5 119.6 119.4 117.8 118.3 138.4 140.4 118.5 119.5 123.3 123.8 123.2 123.7 122.0 122.5 08 122.6 125.5 121.0 121.1 146.8 117.3 112.3 132.5 119.9 118.8 142.4 119.4 124.0 123.9 122.7 09 122.5 126.5 121.3 125.2 147.5 117.5 113.9 133.5 120.2 119.7 142.4 119.5 124.4 124.2 123.1 1991 10 123.2 126.9 121.7 127.5 147.8 117.9 114.3 134.4 120.8 120.3 143.4 119.6 125.0 124.8 123.6 11 123.8 127.1 122.7 128.1 148.1 118.3 114.7 134.7 121.8 120.8 142.9 119.2 125.4 125.1 124.0 12 123.9 126.8 123.1 128.8 147.2 118.7 114.9 134.8 122.1 121.0 141.6 118.4 125.3 125.1 124.1 1992 01 124.0 126.7 123.4 127.9 150.3 119.1 114.7 136.2 122.4 120.6 146.1 118.2 125.9 125.7 124.6
Annual rate of increase (%)
Β DK D ELL E F IRL I L NL Ρ UK
EUR 12
ERM ECU 61-70 3.9 5.5 4.5 1.3 3.7 3.3 3.5 4.3 2.9 5.1 3.7 2.9 3.7 4.1 3.9
71-80 1986
TABLE VII
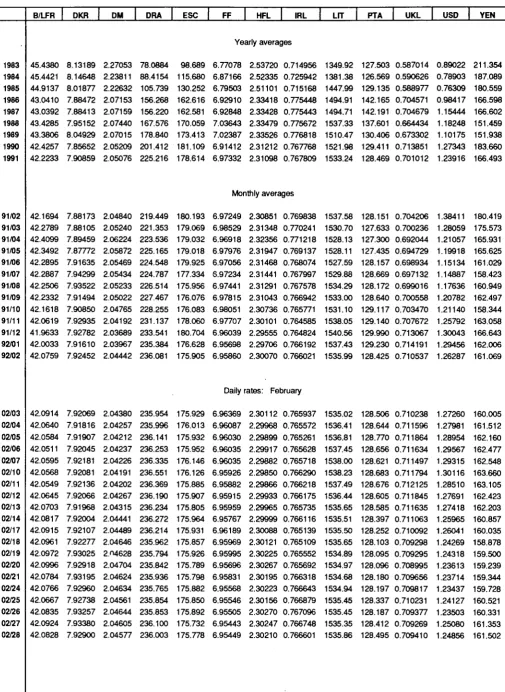
ECU EXCHANGE RATES
1983 1984 1985 1986 1987 1988 1989 1990 1991 91/02 91/03 91/04 91/05 91/06 91/07 91/08 91/09 91/10 91/11 91/12 92/01 92/02 02/03 02/04 02/05 02/06 02/07 02/10 02/11 02/12 02/13 02/14 02/17 02/18 02/19 02/20 02/21 02/24 02/25 02/26 02727 02/28 B/LFR 45.4380 45.4421 44.9137 43.0410 43.0392 43.4285 43.3806 42.4257 42.2233 42.1694 42.2789 42.4099 42.3492 42.2895 42.2887 42.2506 42.2332 42.1618 42.0619 41.9633 42.0033 42.0759 42.0914 42.0640 42.0584 42.0511 42.0595 42.0568 42.0549 42.0645 42.0703 42.0817 42.0915 42.0961 42.0972 42.0996 42.0784 42.0766 42.0667 42.0835 42.0924 42.0828 DKR 8.13189 8.14648 8.01877 7.88472 7.88413 7.95152 8.04929 7.85652 7.90859 7.88173 7.88105 7.89459 7.87772 7.91635 7.94299 7.93522 7.91494 7.90850 7.92935 7.92782 7.91610 7.92452 7.92069 7.91816 7.91907 7.92045 7.92181 7.92081 7.92136 7.92066 7.91968 7.92004 7.92107 7.92277 7.93025 7.92918 7.93195 7.92960 7.92738 7.93257 7.93380 7.92900 DM 2.27053 2.23811 2.22632 2.07153 2.07159 2.07440 2.07015 2.05209 2.05076 2.04840 2.05240 2.06224 2.05872 2.05469 2.05434 2.05233 2.05022 2.04765 2.04192 2.03689 2.03967 2.04442 2.04380 2.04257 2.04212 2.04237 2.04226 2.04191 2.04202 2.04267 2.04315 2.04441 2.04489 2.04646 2.04628 2.04704 2.04624 2.04634 2.04561 2.04644 2.04605 2.04577 DRA 78.0884 88.4154 105.739 156.268 156.220 167.576 178.840 201.412 225.216 219.449 221.353 223.536 225.165 224.548 224.787 226.514 227.467 228.255 231.137 233.541 235.384 236.081 235.954 235.996 236.141 236.253 236.335 236.551 236.369 236.190 236.234 236.272 236.214 235.962 235.794 235.842 235.936 235.765 235.854 235.853 236.100 236.003 ESC 98.689 115.680 130.252 162.616 162.581 170.059 173.413 181.109 178.614 180.193 179.069 179.032 179.018 179.925 177.334 175.956 176.076 176.083 178.060 180.704 176.628 175.905 175.929 176.013 175.932 175.952 176.146 176.126 175.885 175.907 175.805 175.964 175.931 175.857 175.926 175.789 175.798 175.882 175.850 175.892 175.732 175.778
FF HFL IRL
EXPLANATORY NOTES
Bilateral currency deviation (graph on page 3).
The various curves should be compared in pairs. To find the differential between two currencies, subtract the (positive or negative) values along the y-axis corresponding to each currency.
The graph is drawn with the curve of the strongest currency above that of the weakest. It shows therefore the relative position of each currency vis-à-vis the other currencies.
When two curves intersect or merge over a period of time there is no differential between the two currencies and their market exchange rate equals their bilateral central rate.
The graph is drawn within a horizontal band corresponding to the maximum 2,25% margin of fluctuation applying at any given moment to market exchange rates and the bilateral central rates of the ERM currencies, with the exception of the PTA and Sterling, which have a maximum authorized fluctuation of 6%. This band is divided symmetrically by a horizontal axis along which the points would be plotted if all currencies were at their bilateral central rate and there were therefore no fluctuations. The daily market exchange rates of all currencies are compared with the relevant bilateral central rates and the differentials between the two calculated.
The maximum fluctuation between two currencies (with the exception of the PTA and Sterling) is shown within the band, symmetrical with the horizontal axis. The fluctuations of the other currencies in relation to either of the two currencies in question are shown within the maximum permissible fluctuation.
The curves are drawn by linking the daily points showing the relative positions of each currency.
Exchange rate grid (Table I).
The intervention limit rates fixed in the official grid do not always correspond exactly to + or - 2.25% (+ or - 6% for the peseta and Sterling) of the central rates, since for each currency pair (whose exchange rates are inversely proportional to one another) the lower limit of the one corresponds to the upper limit of the other.
Ecu bond issues (Table II & IV).
In table II, issues are recorded as at the payment date. This bulletin only covers international and foreign issues in ecus, including ecu issues offering the option of conversion into other currencies. Main source: International Financing Review Table II shows, under the headings:
-Business sector and Governments: national issuers, both private and public.
-Institutions: the European Investment Bank and the Commission of the European Communities (EEC, ECSC, Euratom).
-Organizations: the specialist institutions of the United Nations, the World Bank, the Council of Europe, etc
Table IV shows detailled information of the latest known issues, whatever the payment date.
Interest rates and yields on ecu investments (Table III).
The interest rates for 1, 3 and 6 month and 1 year deposits are calculated on the basis of the Friday London market rates (source: Financial Times, London Money Rates, ECU Linked Deposit Bid).
The bonds are classified according to three types of maturities: under 5 years, from 5 to 7 years and more than 7 years. The redemption yields of ecu bonds are calculated each Wednesday from a sample of fixed interest bonds, denominated in ecus and listed on the Luxembourg Stock Exchange. These yields are weighted by the amounts in circulation, (source: Luxembourg Stock Exchange).
The monthly and yearly averages are the arithmetic means of these weekly interest rates and bond yields.
Operations rates of the EMCF (Table III).
The interest rate for transactions in EMCF (European Monetary Cooperation Fund) ecus, is the weighted average of the most representative rates on the domestic money market of the countries whose currencies make up the ecu basket. It is based on the weighting of the currencies in the ecu basket as derived from the ecu central rates in force. The rate thus calculated for a given month applies to EMCF transactions for the following month. In table 3, this rate relates to the month upon which the calculations are based and not to the (following) month during which it is used by the EMCF.
Consumer price Indices in national currency (Table V).
The consumer price indices in the national currency of each country measure changes in the purchasing power of one unit of national currency spent in the country concerned.
Two composite indices are calculated, covering all the Member States of the Community (EUR 12) and the ten Member States with currencies participating in the European Monetary System exchange rate mechanism (ERM). (Although the peseta has been participating in the exchange rate mechanism since 19/06/89 and has been included in the calculation of the ecu since 21/09/89, it is only taken into account in the indices relating to the ERM which are included in this bulletin for data after 30/09/89.)
These indices are calculated as weighted arithmetic means (chain indices) of the national indices, the weighting for each Member State being its relative share in the final consumption of households of the group of countries in question (EUR 12, ERM), expressed in purchasing power standards, at current prices and purchasing power parities.
Consumer price indices in ecus (Table VI).
For each country the index of consumer prices in ecus is calculated by dividing the national consumer price index by the average movement of the national currency in relation to the ecu during the month. It measures the change in the purchasing power of one ecu in the country concerned.
Three composite indices are calculated, covering all the Member States of the Community (EUR 12 and ECU), the 10 Member States participating in the European Monetary System exchange rate mechanism (ERM). Although the peseta has been participating in the exchange rate mechanism since 19/06/89, and the peseta and the escudo have been included in the calculation of the ecu since 21/09/89, these two currencies are only taken into account in the indices contained in this bulletin for data after 30/09/89.)
These three indices are calculated as weighted arithmetic means (chain-indices). The weightings are defined as follows: for the EUR 12 and ERM indices, the relative share of each Member State in the final consumption of households for the group of countries in question (EUR 12 or ERM), expressed in ecus at current prices and exchange rates (annual weighting). For the ecu index, the relative share of each Member State's currency in the calculation of the ecu (monthly weighting).
Ecu exchange rates (Table VII).
The exchange rates for the ecu against the national currencies of the Member States of the Community, the USD and yen are shown as annual averages, monthly averages (for the current year), and daily rates (for the latest available month).
1 ecu = Σ
100= Σ
BFR DKR D M D R A * ESC* FF HFL IRL LFR LIT PTA
From 21/09/89 the ecu basket has been made up made as follows :
3.301 0.1976 0.6242 1.44 1.393 1.332 0.2198 0.008552 0.13 151.8 6.885
Ecu central rates from 08/10/90.
42.4032 784195 2.05586 205.311 178.735 6.89509 2.31643 0.767417 42.4032 1538.24 133.631
Weights of currencies on 08/10/90, calculated on the basis of current central rates, expressed in %:
7.78 2.52 30.36 0.70 0.78 19.32 9.49 1.11 0.31 9.87 5.15
UKL
0.08784
0.696904
12.60
' does not participate in the exchange rate mechanism
Venta y suscripciones · Sarg; og abonnement · Verkauf und Abonnement · Πωλήσεις και συνδρομές Sales and subscriptions · Vente et abonnements · Vendita e abbonamenti
Verkoop en abonnementen * Venda e assinaturas
B E L G I Q U E / B E L G I Ë FRANCE UNITED K I N G D O M YUGOSLAVIA
Moniteur belge / Belgisch Staatsblad
Rue de Louvain 42 / Leuvenseweg 42 1000 Bruxelles / 1000 Brussel
Tél. (02)512 00 26
Fax 511 01 84
C C P / Postrekening 0 0 0 - 2 0 0 5 5 0 2 - 2 7 Autres distributeurs /
Overige v e r k o o p p u n t e n
Librairie e u r o p é e n n e / Europese Boekhandel
A v e n u e Albert Jonnart 50 / Albert Jonnartlaan 50 1200 Bruxelles / 1200 Brussel Tél. (02) 734 02 81
Fax 735 08 60
J e a n De Lannoy
A v e n u e d u Roi 202 / K o n i n g s l a a n 202 1060 Bruxelles / 1060 Brussel Tél. (02) 538 51 69
Télex 63220 U N B O O K Β Fax (02) 538 08 41
C R E D O C
Rue de la M o n t a g n e 34 / Bergstraat 34 Bte 11 / B u s 11
1000 Bruxelles / 1000 Brussel
J . H. Schultz Information A / S EFPublikationer
Ottiliavej 18 2500 Valby Tlf. 36 44 22 66 Fax 36 44 01 41 Girokonto 6 00 08 86
BR D E U T S C H L A N D
Bundesanzeiger Verlag
Breite Straße Postfach 10 80 06 5000 Köln 1 Tel. (02 21) 20 29-0
Telex ANZEIGER B O N N 8 882 595 Fax 20 29 278
GREECE
G.C. Eleftheroudakis SA
International B o o k s t o r e Nikis Street 4 10563 Athens Tel. (01) 322 63 23 Telex 2 1 9 4 1 0 ELEF Fax 323 98 21
ESPANA
Boletín Oficial del Estado
Trafalgar, 27 28010 M a d r i d Tel. (91) 44 82 135
M u n d i P r e n s a Libros, S.A.
Castellò, 37 28001 M a d r i d
Tel. (91) 431 33 99 (Libros) 431 32 22 (Suscripciones) 435 36 37 (Dirección) Télex 4 9 3 7 0 - M P L I - E Fax ( 9 1 ) 5 7 5 39 98 Sucursal:
Librería Internacional A E D O S
Consejo de Ciento, 391 08009 Barcelona Tel. (93) 301 86 15 Fax (93) 317 01 41
Llibreria de '.a Generalität de Catalunya
Rambla deis Estudis, 118 (Palau Moja) 08002 Barcelona
Tel. (93) 302 68 35 302 64 62 Fax (93) 302 1 2 99
Journal officiel Service des publications des C o m m u n a u t é s e u r o p é e n n e s
26, rue Desaix 75727 Paris Cedex 15 Tél. (1) 40 58 75 00 Fax (1) 40 58 75 74
IRELAND
G o v e r n m e n t Publications Sales Office
Sun Alliance House Molesworth Street Dublin 2 Tel. (1) 71 03 09
or by post
G o v e r n m e n t Stationery Office EEC Section
6th floor Bishop Street Dublin 8 Tel. (1) 78 16 66 Fax (1) 78 06 45
ITALIA
Licosa Spa
Via Benedetto Fortini, 120/10 Casella postale 552 50125 Firenze Tel. (055) 64 54 15 Fax 64 12 57 Telex 570466 LICOSA I CCP 343 509
Subagenti:
Libreria scientifica Lucio d e Biasio A E I O U
Via Meravigli, 16 20123 Milano Tel. (02) 80 76 79
Herder Editrice e Libreria
Piazza Montecitorio, 117-120 00186 Roma
Tel. (06) 679 46 28/679 53 04
Libreria giuridica
Via XII Ottobre, 172/R 16121 Genova Tel. (010) 59 56 93
G R A N D - D U C H É DE L U X E M B O U R G
Messageries Paul Kraus
1 1 , rue Christophe Plantin 2339 L u x e m b o u r g Tél. 499 88 88 Télex 2515 Fax 499 88 84 44 C C P 4 9 2 4 2 - 6 3
NEDERLAND
S D U Overheidsinformatie
Externe Fondsen Postbus 20014 2500 EA 's-Gravenhage Tel. (070) 37 89 911 Fax (070) 34 75 778
PORTUGAL
Imprensa Nacional
Casa da Moeda, EP
Rua D. Francisco Manuel de Melo, 5 1092 Lisboa Codex
Tel. (01) 69 34 14
Distribuidora d e Livros Bertrand, Ld.° Grupo Bertrand, SA
Rua das Terras d o s Vales, 4-A Apartado 37
2700 A m a d o r a Codex
Tel. (01) 49 59 050
Telex 15798 BERDIS Fax 49 60 255
H M S O Books (PC 16)
H M S O Publications Centre 51 Nine Elms Lane L o n d o n SWS 5DR Tel. (071) 873 2000 Fax GP3 873 8463 Telex 29 71 138
ÖSTERREICH
M a n z ' s c h e V e r l a g s
und Universitätsbuchhandlung
Kohlmarkt 16 1014 Wien Tel. (0222) 531 61-0 Telex 11 25 00 BOX A Fax (0222) 531 61-81
S U O M I
A k a t e e m i n e n Kirjakauppa
Keskuskatu 1 PO Box 128 00101 Helsinki Tel. (0) 121 41 Fax (0) 121 44 41
NORGE
Narvesen information center
Bertrand Narvesens vei 2 PO Box 6125 Etterstad 0602 Oslo 6
Tel. (2) 57 33 00 Telex 79668 NIC N Fax (2) 68 19 01
B T J Box 200 22100 Lund Tel. (046) 18 00 00 Fax (046) 18 01 25
SCHWEIZ / SUISSE / SVIZZERA
O S E C
Stampfenbachstraße 85 8035 Zürich
Tel. (01) 365 54 49 Fax (01) 365 54 11
C E S K O S L O V E N S K O
NIS
Havelkova 22 13000 Praha 3 Tel. (02) 235 84 46 Fax 4 2 - 2 - 2 6 4 7 7 5
M A G Y A R O R S Z A G
Agroinform
Budapest I. Kir. Attila ut 93 1012 Budapest Tel. (1) 56 82 11
Telex (22) 4717 AGINF H-61
POLAND
Business Foundation
ul. Krucza 38/42 00-512 Warszawa
Tel. (22) 21 09 93, 628 28-82 International Fax&Phone
(0-39) 12-00-77
Privredni Vjesnik
Bulevar Lenjina 171/XIV 11070 Beograd Tel. (11) 123 23 40
CYPRUS
Cyprus C h a m b e r of C o m m e r c e and Industry
Chamber Building 38 Grivas Dhigenis Ave 3 Deligiorgis Street
PO Box 1455 Nicosia
Tel. (2)449500/462312
Fax (2) 458630
TURKIYE
Pres G a z e t e Kitap Dergi
Pazarlama Dagitim Ticaret ve sanayi AS
Narlibahçe Sokak N. 15 Istanbul-Cagaloglu
Tel. (1) 520 92 96 - 528 55 66
Fax 520 64 57 Telex 23822 DSVO-TR
AUTRES PAYS OTHER COUNTRIES ANDERE LÄNDER
Office des publications officielles des C o m m u n a u t é s européennes
2, rue Mercier 2985 L u x e m b o u r g Tél. 49 92 81
Télex P U B O F LU 1324 b Fax 48 85 73
C C bancaire BIL 8 - 1 0 9 / 6 0 0 3 / 7 0 0
CANADA
Renouf Publishing Co. Ltd
Mail orders — Head Office: 1294 A l g o m a Road Ottawa, Ontario K1B 3W8 Tel. (613) 741 43 33 Fax (613) 741 54 39 Telex 0534783
Ottawa Store: 61 Sparks Street Tel. (613) 238 89 85
Toronto Store: 211 Yonge Street Tel. (416) 363 31 71
UNITED STATES OF AMERICA
U N I P U B
4611 -F Assembly Drive Lanham, MD 20706-4391 Tel. Toll Free (800) 274 4888 Fax (301) 459 0056
AUSTRALIA
Hunter Publications
58A Gipps Street C o l l i n g w o o d Victoria 3066
J A P A N
Kinokuniya C o m p a n y Ltd
17-7 Shinjuku 3 - C h o m e Shinjuku-ku
Tokyo 160-91
Tel. (03) 3439-0121
Journal D e p a r t m e n t
PO Box 55 Chitóse
Tokyo 156
TABLE VII
ECU EXCHANGE RATES
01/02 01/03 01/06 01/07 01/08 01/09 01/10 01/13 01/14 01/15 01/16 01/17 01/20 01/21 01/22 01/23 01/24 01/27 01/28 01/29 01/30 01/31 B/LFR 41.9417 41.9756 41.9609 41.9514 41.9466 41.9377 41.9451 41.9517 41.9565 41.9828 41.9807 42.0042 42.0116 42.0301 42.0359 42.0423 42.0488 42.0699 42.0719 42.0552 42.0876 42.0848 DKR 7.92850 7.93479 7.93093 7.92285 7.91556 7.91548 791044 7.90208 7.89952 7.90475 7.90678 7.91299 7.90961 7.91416 7.91169 7.91792 7.91707 7.91904 7.92065 7.91783 7.92162 7.92002 DM 2.03680 2.03909 2.03822 2.03736 2.03651 2.03579 2.03676 2.03686 2.03716 2.03900 2.03864 2.03993 2.04020 2.04131 2.04161 2.04142 2.04139 2.04274 2.04291 2.04167 2.04351 2.04385 DRA 235.391 235.312 235.174 235.342 235.095 234.934 234.741 234.611 235.052 234.693 235.082 235.085 235.599 235.710 235.746 235.729 235.511 235.892 235.910 236.024 235.979 235.834 ESC 179.131 177.850 177.522 177.572 177.082 177.585 177.275 176.715 176.283 176.238 176.655 176.328 176.007 176.065 176.009 175.988 175.852 175.907 176.002 175.989 175.897 175.860 FF Daily 6.95582 6.95989 6.95694 6.95575 6.95324 6.95267 6.95200 6.94948 6.94971 6.95578 6.95395 6.95675 6.95697 6.95932 6.95808 6.96184 6.96084 6.95969 6.96115 6.95969 6.96233 6.96159
HFL IRL
rates : January
2.29484 2.29677 2.29558 2.29472 2.29380 2.29299 2.29387 2.29373 2.29421 2.29605 2.29588 2.29748 2.29766 2.29880 2.29896 2.29881 2.29900 2.30039 2.30052 2.29941 2.30102 2.30086 0.767003 0.767728 0.766789 0.766534 0.766747 0.766492 0.765228 0.764652 0.765520 0.765745 0.765417 0.765689 0.766379 0.766393 0.766417 0.766289 0.765783 0.766285 0.766273 0.765942 0.766614 0.766305 LIT 1540.93 1539.20 1538.72 1539.22 1539.85 1539.76 1538.54 1537.22 1538.25 1537.12 1536.40 1536.76 1537.08 1536.60 1536.65 1536.84 1536.93 1534.70 1534.95 1536.37 1535.37 1536.08 PTA 129.557 129.339 129.446 129.516 129.687 129.806 129.680 129.835 129.767 129.489 129.453 129.164 129.134 128.898 128.975 128.925 129.037 128.813 128.665 128.760 128.579 128.540 UKL 0.715080 0.712905 0.714768 0.715799 0.716871 0.717562 0.717582 0.718361 0.717675 0.715377 0.716233 0.714498 0.714072 0.712876 0.712554 0.712043 0.711933 0.711599 0.711370 0.712438 0.710394 0.710208 USD 1.34256 1.32280 1.33697 1.34320 1.34779 1.33538 1.30578 1.29341 1.29756 1.25942 1.26286 1.25573 1.28476 1.28425 1.28865 1.28246 1.26653 1.27234 1.27086 1.28609 1.27480 1.26609 YEN 166.411 165.085 166.600 165.348 167.786 166.455 164.163 163.836 163.816 161.395 161.608 160.821 159.194 158.668 158.852 158.320 157.620 158.788 159.747 161.019 160.128 158.476
TABLE IV
LAST MONTH'S ECU BOND ISSUES
Issue Payment Date 22/02/1992 11/03/1992 22/02/1992 16/03/1992 29/02/1992 09/03/1992 29/02/1992 11/03/1992 29/02/1992 01/04/1992 29/02/1992 18/03/1992 Borrower (country)
Nacional Financiera SNC (MEXICO)
B.E.I. -E.I.B.
Conseil de Γ Europe Council ol Europe
Kredit lür Wiederaufbau (DEUTSCHLAND) Eurolima (SWITZERLAND) Nisshinbo (JAPAN) Listing :
(1) Issued at fixed Re-otlor (2) French Treasury OAT. (3) 3 M. LIBOR- 5/8 % with (4) Unlisted Issued (Mio Ecu) 100 100 135 150 75 100
LX = Luxem
pnce sued under Eu Call Option the
Issue Price 100.750 100.000 100.500 100.050 101.125 100.000 bourg romarket prad February, 18
Coupon 10.25 8.8 9.375 8.5 8.625 4.875 ces 1993 à 10C
Term (years) 5 2 2 5 7.6 4
PA = Parla
Maturity 11/03/1997 16/03/1994 14/01/1994 12/02/1997 01/0*1999 19/03/1996 Yields 10.05 8.80 9.09 8.49 8.42 4.88 Lead Manager
Swiss Bank Corp.
Banco di Roma
Lehman Brothers
Deutsche Bk CM.
Daiwa Europe
Nikko
LN = London
Listing LX (4) LX LX LX LX Notice Swap(1) (1) Swap(1) Swap
Equity Linked Debl
Price (excl. VAT) in Luxembourg: Single copy ECU 9 · Subscription ECU 67
Óf)
OFICINA DE PUBLICACIONES OFICIALES DE LAS COMUNIDADES EUROPEAS KONTORET FOR DE EUROPÆISKE FÆLLESSKABERS OFFICIELLE PUBLIKATIONER AMT FÜR AMTLICHE VERÖFFENTLICHUNGEN DER EUROPÄISCHEN GEMEINSCHAFTEN ΥΠΗΡΕΣΙΑ ΕΠΙΣΗΜΩΝ ΕΚΔΟΣΕΩΝ ΤΩΝ ΕΥΡΩΠΑΪΚΩΝ ΚΟΙΝΟΤΗΤΩΝ
OFFICE FOR OFFICIAL PUBLICATIONS OF THE EUROPEAN COMMUNITIES
OFFICE DES PUBLICATIONS OFFICIELLES DES COMMUNAUTÉS EUROPÉENNES
UFFICIO DELLE PUBBLICAZIONI UFFICIALI DELLE COMUNITÀ EUROPEE BUREAU VOOR OFFICIËLE PUBLIKATIES DER EUROPESE GEMEENSCHAPPEN SERVIÇO DAS PUBLICAÇÕES OFICIAIS DAS COMUNIDADES FIIROPFIAS
ISSN 1011-0844
[image:12.595.64.524.378.662.2]