eurostat
eurosta
STATISTISCHES AMT DER EUROPAISCHEN GEMEINSCHAFTEN STATISTICAL OFFICE OF THE EUROPEAN COMMUNITIES OFFICE STATISTIQUE DES COMMUNAUTÉS EUROPÉENNES L-2920 Luxembourg — Tél. (352) 43 01-1 — Télex COMEUR LU 3423 B-1049 Bruxelles, rue de la Loi 200 — Tél. (32-2) 299 11 11
Eurostat hat die Aufgabe, den Informa-tionsbedarf der Kommission und aller am Aufbau des Binnenmarktes Beteiligten mit Hilfe des europäischen statistischen Systems zu decken.
Um der Öffentlichkeit die große Menge an verfügbaren Daten zugänglich zu machen und Benutzern die Orientierung zu erleichtern, werden zwei Arten von Publi-kationen angeboten: Statistische Doku-mente und Veröffentlichungen.
Statistische Dokumente sind für den Fachmann konzipiert und enthalten das ausführliche Datenmaterial: Bezugs-daten, bei denen die Konzepte allgemein bekannt, standardisiert und wissenschaft-lich fundiert sind. Diese Daten werden in einer sehr tiefen Gliederung dargeboten. Die Statistischen Dokumente wenden sich an Fachleute, die in der Lage sind, selbständig die benötigten Daten aus der Fülle des dargebotenen Materials auszu-wählen. Diese Daten sind in gedruckter Form und/oder auf Diskette, Magnet-band, CD-ROM verfügbar. Statistische Dokumente unterscheiden sich auch optisch von anderen Veröffentlichungen durch den mit einer stilisierten Graphik versehenen weißen Einband.
Veröffentlichungen wenden sich an eine ganz bestimmte Zielgruppe, wie zum Beispiel an den Bildungsbereich oder an Entscheidungsträger in Politik und Ver-waltung. Sie enthalten ausgewählte und auf die Bedürfnisse einer Zielgruppe abgestellte und kommentierte Informa-tionen. Eurostat übernimmt hier also eine Art Beraterrolle.
Für einen breiteren Benutzerkreis gibt Eurostat Jahrbücher und periodische Veröffentlichungen heraus. Diese enthal-ten statistische Ergebnisse für eine erste Analyse sowie Hinweise auf weiteres Datenmaterial für vertiefende Unter-suchungen. Diese Veröffentlichungen werden in gedruckter Form und in Daten-banken angeboten, die in Menütechnik zugänglich sind.
Um Benutzern die Datensuche zu erleich-tern, hat Eurostat Themenkreise, d. h. eine Untergliederung nach Sachgebieten, eingeführt. Daneben sind sowohl die Statistischen Dokumente als auch die Veröffentlichungen in bestimmte Reihen, wie zum Beispiel „Jahrbücher", „Kon-junktur", „Methoden", untergliedert, um den Zugriff auf die statistischen Informa-tionen zu erleichtern.
Y. Franchet Generaldirektor
It is Eurostat's responsibility to use the European statistical system to meet the requirements of the Commission and all parties involved in the development of the single market.
To ensure that the vast quantity of ac-cessible data is made widely available, and to help each user make proper use of this information, Eurostat has set up two main categories of document: statistical documents and publications.
The statistical document is aimed at spe-cialists and provides the most complete sets of data: reference data where the methodology is well-established, stand-ardized, uniform and scientific. These data are presented in great detail. The statistical document is intended for ex-perts who are capable of using their own means to seek out what they require. The information is provided on paper and/or on diskette, magnetic tape, CD-ROM. The white cover sheet bears a stylized motif which distinguishes the statistical docu-ment from other publications.
The publications proper tend to be com-piled for a well-defined and targeted public, such as educational circles or political and administrative decision-makers. The information in these docu-ments is selected, sorted and annotated to suit the target public. In this instance, therefore, Eurostat works in an advisory capacity.
Where the readership is wider and less well-defined, Eurostat provides the infor-mation required for an initial analysis, such as yearbooks and periodicals which contain data permitting more in-depth studies. These publications are available on paper or in videotext databases. To help the user focus his research, Eurostat has created 'themes', i.e. subject classifications. The statistical documents and publications are listed by series: e.g. yearbooks, short-term trends or method-ology in order to facilitate access to the statistical data.
Y. Franchet Director-General
Pour établir, évaluer ou apprécier les dif-férentes politiques communautaires, la Commission européenne a besoin d'infor-mations.
Eurostat a pour mission, à travers le sys-tème statistique européen, de répondre aux besoins de la Commission et de l'en-semble des personnes impliquées dans le développement du marché unique. Pour mettre à la disposition de tous l'im-portante quantité de données accessibles et faire en sorte que chacun puisse s'orienter correctement dans cet ensem-ble, deux grandes catégories de docu-ments ont été créées: les docudocu-ments statistiques et les publications.
Le document statistique s'adresse aux spécialistes. Il fournit les données les plus complètes: données de référence où la méthodologie est bien connue, standar-disée, normalisée et scientifique. Ces données sont présentées à un niveau très détaillé. Le document statistique est des-tiné aux experts capables de rechercher, par leurs propres moyens, les données requises. Les informations sont alors disponibles sur papier et/ou sur disquette, bande magnétique, CD-ROM. La couver-ture blanche ornée d'un graphisme stylisé démarque le document statistique des autres publications.
Les publications proprement dites peu-vent, elles, être réalisées pour un public bien déterminé, ciblé, par exemple l'enseignement ou les décideurs politi-ques ou administratifs. Des informations sélectionnées, triées et commentées en fonction de ce public lui sont apportées. Eurostat joue, dès lors, le rôle de conseil-ler.
Dans le cas d'un public plus large, moins défini, Eurostat procure des éléments nécessaires à une première analyse, les annuaires et les périodiques, dans les-quels figurent les renseignements adé-quats pour approfondir l'étude. Ces publications sont présentées sur papier ou dans des banques de données de type vidéotex.
Pour aider l'utilisateur à s'orienter dans ses recherches, Eurostat a créé les thèmes, c'est-à-dire une classification par sujet. Les documents statistiques et les publications sont répertoriés par série — par exemple, annuaire, conjonc-ture, méthodologie — afin de faciliter l'accès aux informations statistiques.
LABOUR FORCE SURVEY
Results 1992
Theme Population and social conditions
Cataloguing data can be found at the end of this publication.
Luxembourg: Office for Official Publications of the European Communities, 1994
ISBN 92-826-9224-8
© ECSC-EC-EAEC, Brussels · Luxembourg, 1994
Reproduction is authorized, except for commercial purposes, provided the source is acknowledged.
with Council Regulation (EEC) No. 3711/91 of 16 December 1991.
This survey, like preceding surveys carried out between 1983 and 1991, was based upon the International Labour Office guidelines on labour force statistics as adopted by the 13th International Conference of Labour Statisticians in 1982 and subsequently confirmed atthe 14th and 15th conferences in 1987 and 1993. The fact that the methodology of the European Labour Force Survey conforms with internationally-accepted standards has assisted its development over the years into a rich and powerful source of labour force statistics. The unique application of common definitions and standardised contents for all Member States of the European Union permits the survey to be used extensively in meeting requirements with regard to labour market statistics for the social and regional development policies of the Union.
The 1992 European Labour Force Survey was the first in a new series. In comparison with the surveys conducted between 1983 and 1991, a number of modifications were made in order to meet changing statistical requirements and to improve data quality and reliability at both national and regional levels. Information about the content and methodology of the survey as implemented from 1992 onwards may be found in the Eurostat publication Labour Force Survey: Methods and Definitions-1992 Seríes. Some clarifications and updates to the definitions as given there are provided below in the explanatory notes to this publication.
The changes in the survey contents are reflected in the differences between the selection of tables in this publication and those presented in previous years. In addition, the linguistic format has been changed so that three separate versions are now available (in English, French and German) instead of a single multilingual version as previously.
The figures shown for Germany in this publication refer to the territory of the Federal Republic as constituted from 3 October 1990 onwards. These figures and the totals for the Union (EUR-12) are therefore comparable from this standpoint with those given in the annex to the 1991 publication but not to figures from the main part ofthat publication nor from earlier years.
The revision of the survey for 1992 involved a considerable degree of additional effort on the part of all concerned. Eurostat wishes to thank all those involved at the national statistical offices for their contribution to the success of the survey in preparing the questionnaires, selecting the samples, conducting the interviews and transmitting the data to Eurostat The preparation of this publication was the responsibility of the unit Population, Migration, Employment and Unemployment in the Directorate for Social and Regional Statistics and Regional Plans at Eurostat.
Signs
and abbreviations
- Zero or not availableNot zero but extremely unreliable
( ) Unreliable data due to small size of the sample Eur 12 Union
Bibliographical note
Main publications of 1992 national survey resultsBelgique/Belgiö
Enquête par sondage sur les forces de travail, INS 1992 Steekproefenquête naarde beroepsbevolking, NIS 1992
Danmark
Arbejdsstyrkeundersøgelsen, Statistiske efterretninger, Danmarks Statistik
B.R. Deutschland
Bevölkerung und Erwerbstätigkeit, Fachserie 1, Reihe 4.1, Statistisches Bundesamt
Greece
Labour force survey, National Statistical Service of Greece
España
Encuesta de población activa
Principales resultados y resultados detallados (trimestral), Tablas anuales, INE
France
Enquête sur l'emploi 1992, les collections de l'Insee
Ireland
Labour force survey 1992, Central Statistics Office
Italia
Rilevazione trimestrale sulle forze di lavoro, Istat Annuario statistico italiano, Istat
Luxembourg
Bulletin du Statec
Nederland
Enquête beroepsbevolking 1992, CBS
Portugal
Inquérito ao emprego 1992, INE
United Kingdom
Explanatory notes Page 9
Table
001
002
003
004
005
006
007
008
009
010
011
012
013
014
015
016
017
018
019
020
021
022
023
024
025
026
027
028
029
030
031
032
033
034
035
036
037
038
039
040
041
042
043
044
045
046
(Old
Table
Number )
(01)
(02)
(03)·
(04)
(05)
(06)
(07)
(08)
(09)
(10)
(11)
(12)
(13)
(14)
(15)
(16)
(17)
(18)
(19)
(20)
(21)
(22)
(23)
(24)
/
\
(—)
(—)
(—)
(—)
(—)
(—)
(25)
(26)
(27)
(28)
(29)
(30)
(31)
(32)
(43)
(44)
(45)
(46)
(-)
(-)
(-)
Population and activity
Principal characteristics of activity of the population (1,000/%)
Principal characteristics of activity of young persons aged 15 to 24 years (1,000/%) Activity rates by age groups (%)
Activity rates by marital status and broad age groups (%) Activity rates by nationality and broad age groups (%)
Employment/population ratios by age groups (%)
Employment/population ratios by marital status and broad age groups (%) Unemployment rates by age groups (%)
Unemployment rates by marital status and broad age groups (%) Total population by age groups (1,000)
Total population by age groups (%)
Non-national population by broad age groups (1,000) Non-national population by broad age groups (%) Labour force by age groups (1,000)
Labour force by age groups (%)
Labour force by nationality and broad age groups (1,000) Labour force by nationality and broad age groups (%) Persons in employment by age groups (1,000) Persons in employment by age groups (%) Unemployed persons by age groups (1,000) Unemployed persons by age groups (%) Inactive persons by age groups (1,000) Inactive persons by age groups (%)
Young persons aged 15 to 24 years in education by age groups and main population categories
(1,000)
Young persons aged 15 to 24 years in education by age groups and main population categories (%) Main population categories by degree of urbanisation (1,000) ·" Main population categories by degree of urbanisation (%)
Unemployment rates, employment/population ratios, and activity rates by degree of urbanisation (%) Employment status by educational attainment level of persons aged 15 years and over (1,000) . . Employment status by educational attainment level of persons aged 15 years and over (%) . . . . Educational attainment level by employment status of persons aged 15 years and over (%) . . . . Employment
Persons in employment by professional status (1,000) Persons in employment by sector of activity (1,000) Persons in employment by professional status (%) Persons in employment by sector of activity (%)
Persons in employment by professional status and sector of activity (1,000) Persons in employment by professional status and sector of activity (%) Persons in employment by sector of activity and professional status (1,000) Persons in employment by sector of activity and professional status (%)
Persons in employment by economic activity (1,000) . . Persons in employment by economic activity (%)
Employees by economic activity (1,000) Employees by economic activity (%)
Persons in employment by occupation (ISCO-88(COM)) (1,000) Persons in employment by occupation (ISCO-88(COM))(%) Employees by occupation (ISCO-88(COM)) (1,000)
14
16
18
20
22
24
26
28
30
32
34
36
38
40
42
44
46
48
50
52
54
56
58
60
62
64
66
68
70
72
74
Table
047
048
049
050
051
052
053
054
055
056
057
058
059
060
061
062
063
064
065
066
067
068
069
070
(Old Table Number
(-)
(41) (42) (33) (34) (35) (36) (37) (38) (39) (40)
(-)
(-)
(-)
(-)
(-)
(-)
(-)
(-)
(-)
(-)
(-)
(-)
(-)
Employees by occupation (ISCO-88(COM))(%)
Persons working full-time/part-time by broad age groups (1,000) Persons working full-time/part-time by broad age groups (%)
Persons in employment by professional status and full-time/part-time breakdown (1,000) . . . Persons in employment by professional status and full-time/part-time breakdown (%)
Persons in employment by sector of activity and full-time/part-time breakdown (1,000) Persons in employment by sector of activity and full-time/part-time breakdown (%) Employees by sector of activity and full-time/part-time breakdown (1,000)
Employees by sector of activity and full-time/part-time breakdown (%) Non-employees by sector of activity and full-time/part-time breakdown (1,000) Non-employees by sector of activity and full-time/part-time breakdown (%) Married women-sector of activity by full-time/part/time breakdown (1,000/%) Persons working part-time by reason (1,000/%)
Persons working shiftwork, in the evening or at night (1,000) Persons working shiftwork, in the evening or at night (%) Persons working on Saturday, Sunday or from home (1,000) Persons working on Saturday, Sunday or from home (%) Employees with a temporary job by reason (1,000/%)
Reasons for total absence from work during the reference week (1,000/%)
Persons in employment receiving training during the previous four weeks (1,000/%) . . . Persons in employment with more than one job by professional status of the second job (1,000) Persons in employment with more than one job by sector of activity of the second job (1,000) . Persons in employment with more than one job by professional status of the second job (%). . Persons in employment with more than one job by sector of activity of the second job (%) . . .
Page
104 106 108 110 112 114 116 118 120 122 124 126 128 130 132 134 136 138 140 142 144 144 146 146
071
(47/48)072
073
074
075
076
077
078
079
080
081
082
083
084
085
086
087
088
089
090
091
(54) (55) (56)
(-)
(49) (50) (51) (52) (57) (58) (59) (60)
(-)
(53)
(-)
(-)
(-)
(-)
(-)
(-)
Working time
Persons in employment - comparison of average usual and average actual number of hours
worked by sector of activity (hrs) 150 Employees-average hours usually worked per week by economic activity (hrs) 152
Employees working full-time - average hours usually worked per week by economic activity (hrs) 154 Employees working part-time - average hours usually worked per week by economic activity (hrs) 156 Employees-average hours usually worked per week by occupation (ISCO-88(COM)) (hrs) . . . . 158
Persons in full-time employment-groups of hours usually worked per week (%) 160 Persons in full-time employment - groups of hours actually worked during the reference week (%) 162
Persons in part-time employment-groups of hours usually worked per week (%) 164 Persons in part-time employment - groups of hours actually worked during the reference week (%) 166
Employees in industry working full-time - groups of hours usually worked per week by economic
activity (%) 168 Employees in services working full-time - groups of hours usually worked per week by economic
activity (%) 172 Employees in industry and services working part-time - groups of hours usually worked per week
(%) 176
Persons in full-time employment - detailed groups of hours actually worked during the reference
week(%) 178
Persons in full-time employment-detailed groups of hours usually worked per week (%) 180 Persons in full/part-time employment-differences between usual and actual hours (1,000) . . . . 182
Persons in full/part-time employment-differences between usual and actual hours (%) 184 Persons in employment having worked during the reference week - reasons for differences between
usual and actual hours (1,000) 186 Persons in employment having worked during the reference week - reasons for differences between
usual and actual hours (%) 188 Persons in employment having worked during the reference week - average difference in hours
between usual and actual hours (hrs) 190 Persons in employment with a second job - number of persons and average hours actually worked
in second job during the reference week (1,000/hours) 192 Persons in employment with a second job - type of second job by hours actually worked during the
092 093 094 095 096 097 098 099 100 101 102 103 104 105 106 107 108 109 110 111 112 113
114 115 116 117 118 119 120 121 122
Number )
(62) (63) (64) (65) (68) (69) (70) (71) (-) (72) (74) (-) (-) (-) (75) (76) (79) (80) (-) (-) (81) (82)
(-) (-) (-) (-) (-) (66) (67) (-) (73)
Unemployment and search for work
Principal characteristics of the unemployed (1,000) 198 Principal characteristics of the unemployed (%) 200 Principal characteristics of the young unemployed aged 15 to 24 years (1,000) 202
Principal characteristics of the young unemployed aged 15 to 24 years (%) 204
Detailed duration of unemployment (1,000) 206 Detailed duration of unemployment (%) 208 Duration of unemployment for the main groups of unemployed (1,000) 210
Duration of unemployment for the main groups of unemployed (%) 212
Duration of unemployment by broad age groups (1,000) 214 Duration of unemployment by broad age groups (%) 216 Unemployed having lost/left job as employee due to economic reasons by previous economic
activity (1,000) 218 Unemployed having lost/left job as employee due to economic reasons by previous economic
activity (%) 220 Unemployed having lost/left job as employee due to economic reasons by occupation of last
job (ISCO-88(COM)) (1,000) 222 Unemployed having lost/left job as employee due to economic reasons by occupation of last
job (ISCO-88(COM)) (%) 224 Unemployed seeking employment by broad age group and type of employment sought (1,000) . . 226
Unemployed seeking employment by broad age group and type of employment sought (%) . . . . 228
Unemployed seeking employment by method of job search (1,000) 230 Unemployed seeking employment by method of job search (%) 232 Inactive persons-reasons for not seeking employment (1,000) 234 Inactive persons - reasons for riot seeking employment (%) 236 Persons having a job and seeking another by broad age groups and reasons (1,000) 238
Persons having a job and seeking another by broad age groups and reasons (%) 240 Households
Number of private households by household type (children under 15) (1,000/%) 244 Activity rates and unemployment rates by household type (children under 15) (%) 246 Number households by number of unemployed persons living in household (1,000/%) 248 Number of private households by age of yougest person in the household (1,000) 250 Number of private households by age of yougest person in the household (%) 250
Unemployed by relationship to head of household (1,000) 252 Unemployed by relationship to head of household (%) 254 Duration of unemployment by relationship to head of household (1,000) 256
Organization of the survey
The content of the European Labour Force Survey is determined by the Statistical Office of the European Union (Eurostat), together with the national experts of the Member States. An agreed coding scheme is then used by the Member States in transmitting the data.
A summary presentation of the type of information covered by the survey was included in Article 4 of Council Regulation (EEC) N° 3711/91 which formed the legal basis for the 1992 survey.
The national statistical institutes are responsible for selecting the sample, preparing the questionnaires, conducting the direct interviews among households, and forwarding the results to Eurostat in accordance with the standard coding scheme.
Eurostat devises the programme for analysing the results and is responsible for processing and disseminating the information forwarded by the national institutes.
A detailed description of the sampling methods, the adjustment procedures, the definitions and the common Community coding currently used in the labour force survey is presented in the publication Labour Force Survey - Methods and definitions, 1992 seríes.
Reference period
The labour force characteristics of each person interviewed refer to his situation in a particular reference week.
As a general rule the reference week should be a normal week in spring excluding bank holidays. For countries using a fixed week such as Italy, this requirement is easy to fulfil. In some countries, however, the reference week is the one preceding the week of the interview and, as the survey extends over a period ottime, the mobile reference week method is used. In this case it cannot be guaranteed that the reference week represents a normal week.
For the 1992 survey, the reference weeks were distributed within the following periods:
Belgium Denmark FR of Germany Greece Spain France Ireland Italy Luxembourg Netherlands Portugal United Kingdom
May
February ^June May
ApriWune ApriWune March-April May October May
January-Oune January and March March-May
Field of survey
The survey is intended to cover the whole of the resident population, i.e. all persons whose usual place of residence is in the territory of the Member States of the Community. For technical and methodological reasons, however, it is not possible in all the countries to include the population living in collective households, i.e. 'persons living in homes, boarding schools, hospitals, religious institutions, workers' hostels, etc. Consequently, for the purposes of harmonizing the field of survey, the Community results are compiled on the basis of the population of private households only. This comprises all persons living in the households surveyed during the reference week. This definition also includes persons absent from the household for short periods due to studies, holidays, illness, business trips, etc.
The sampling method was designed separately by each national statistical office in the light of the experience and practices of the individual Member States. The design adopted in each case was required by the Regulation to ensure a certain minimum reliability at regional level, expressed as follows : "
the sampling plan shall guarantee that for characteristics relating to 5% of the population of working age the relative standard error at NUTS II level (or equivalent) does not exceed 8%, assuming the design effect for the variable 'unemployment. '
(Council Regulation (EEC) No. 3711/91, Article 3.2)
The number of private households for which data was finally available from each Member State, was as follows :
Belgium Denmark F.R. of Germany
Greece
Spain France Ireland Italy Luxembourg Netherlands Portugal United Kingdom
Reliability of the results
Sampling error
31,046 12,844 140,048 48,776 59,351 69,458 46,522 72,663 5,667 30,398 15,499 64,252
complete census had been carried out using the same questionnaires, interviewers, supervisors, data-processing techniques, etc. as those used in the labour force survey. This difference is known as the sampling error of the estimate. In a given sample, there are basically two factors which account for the relative magnitude of the sampling error of a characteristic: the frequency with which it occurs, and the evenness with which it is distributed among the population. Of two estimates, the larger is likely to have a smaller per cent sampling error, while of two estimates of comparable size the one which refers to a characteristic more evenly spread throughout the population would, in general, be subject to smaller relative sampling variability.
In this publication results likely to have very wide margins of relative sampling variability have been replaced by a dot, while other relatively imprecise estimates are shown within brackets. An indication of the per cent sampling error can be provided by the coefficient of variation of an estimate. Eurostat has requested the Member States to calculate the coefficient of variation for certain basic variables (employed by broad industrial group, unemployed, unemployment rates, labour force and activity rates) by sex and age. The answers received indicate that for the abovementioned variables the labour force survey provides reliable results at national level.
Survey response
A significant source of non-sampling error in the labour force survey is the effect of non-response on the results. Non-response rates normally range from about 5 to 19% with most Member States around 6%. Adjustment for non-response in the majority of countries was made by reweighting the results while in some cases the method used was 'duplication' or 'substitution' of units. Quality checks carried out in various countries suggest that one-person households may be under-represented in the sample as they tend to be more difficult to contact than households containing several persons.
Weighting
The 1992 survey results were weighted up to independently derived population estimates for various age, sex, region, nationality, etc. categories. More information about weighting and adjustment procedures can be found in Labour Force Survey - Methods and definitions, 1988.
Basic concepts and definitions
The concepts and definitions used in the survey are those contained in the Recommendation of the 13th International Conference of Labour Statisticians, convened in 1982 by the International Labour Organisation (and therefore referred to throughout these notes as the 'ILO guidelines'). In accordance with the ILO guidelines, the definitions given below are applied. All these definitions apply to persons aged 15 years and over, living in private households.
Persons in employment are those who during the reference week did any work for pay or profit, or were not working but had · jobs from which they were temporarily absent. Family workers are also included.
Unemployed persons are those who, during the reference week :
(a) had no employment, and
(bywere available to start work within the next two weeks, and
(c) had actively sought employment at some time during the previous four weeks.
In addition, unemployed persons include those who had no employment and had already found a job to start later. Duration of unemployment is defined as:
(a) the duration of search for a job, or
(b) the length of the period since the last job was held (if this period is shorter than the duration of search for a job).
The labour force is defined as the sum of persons in employment and unemployed persons.
Inactive persons are those who are not classified as persons in employment nor as unemployed persons.
Activity rates represent the labour force as a percentage of the population of working age.
Employment/population ratios represent persons in employment as a percentage of the population ofworking age. Unemployment rates represent unemployed persons as a percentage of the labour force.
The above rates are usually calculated for sex/age groups and sometimes further cross-classified by other demographic variables.
Application of the concepts
As discussed below, the revision of the survey in 1992 included a number of modifications designed to ensure a more exact application of the ILO guidelines. This application modifies certain aspects of the text in the publication Labour Force Survey- Methods and Definitions, 1992 series. In terms of the codification as presented in that publication, the definitions of employed and unemployed persons may be expressed as follows :
Employed :
(Column 13 = '1') or (Column 13 = '2' and (Column 14 NE '7')) Unemployed :
(((Column 13 = '3' or '5') and (Column 77 = '1') and (Column 73 = '01' or '02' or '03' or '04' or '05' or '06' or '07' or '08' or Ί 2 ) )
or ((Column 13 = '2' and Column 14 = '7') or (Column 13 = '5' and Column 69 = '2')))
Comparability with previous surveys
The concepts and definitions used in the European Labour Force Survey have been derived from the ILO guidelines since 1983. This has guaranteed the comparability of the results between all the surveys held since that year. The results of surveys held before 1983 are not comparable since they were not based upon these guidelines.
The integration into the 1992 survey of a more exact implementation of the guidelines implies that the degree of comparability between the 1983-91 series and the new series from 1992 is slightly less than the comparability within each series. However, the fact that both sets of definitions continue to rest upon the ILO guidelines ensures that the differences are minimal.
of the labour force is minimal as only 73,320 persons aged 14 years were included in the labour force in 1991.
The definition of employed persons in the two series is identical.
The definition of unemployed persons contains the following differences:
(a) Persons seeking work as self-employed are now considered unemployed only if they satisfy the same criteria of seeking work and availability for work, as persons seeking work as employees. Before 1992, these criteria were not applied for this small group. They are estimated in 1992 at 270,000 whereas the figure consistent with the previous definition would have been 302,000.
(b) Persons not at work and hoping to be re-engaged by a former employer ('temporary lay-offs') are similarly now considered as unemployed only if they satisfy the usual criteria of seeking work and availability for work, which were not previously applied. They amounted in 1991 to a total of only 25,000 persons.
(c) Persons without employment are considered as unemployed only if they are available for work and have used an active method of job-search within the reference period as specified by the ILO guidelines. The questionnaires were therefore modified to permit active methods to be distinguished separately. In the absence of comparative data from both the old and new sets of questions, it is difficult to estimate the effect of this change, but most Member States considered that the category of unemployed already comprised exclusively persons actively seeking work.
Implementation of the survey at national level The 1992 survey was designed to provide a more complete picture of the labour market than had been possible in the previous series of surveys between 1983 and 1991. A number of variables were therefore introduced which had not previously formed part of the survey, or had existed in a different form. (The correspondence between the two series is presented in Labour Force Survey- Methods and Definitions, 1992 seríes, page 13). This implied, for the national statistical offices, the considerable additional task of modifying the questionnaires and the procedures required fortransmitting the data to Eurostat
The changes implemented may have given rise to certain inconsistencies in the data, which it is hoped to remedy as the new version of the survey becomes familiar. In some Member States, it was not possible for all the modifications to be implemented fully, but some future improvements have been undertaken. In France, the new questionnaire was implemented only for that section of the sample which was interviewed using computers, with the result that non-response rates are very high for some variables. This effect will gradually disappear with the general phasing-in of computer
employment, so that certain figures have had to be imputed. In addition part-time work in the Netherlands is higher than for other Member States due to the nature of the Dutch questionnaire. There have been difficulties in several Member States in providing data on occupations according to the new ISCO-88 (COM) classification; again it is hoped that this information will become more consistent in future years. In addition some countries have adopted different and not always comparable approaches concerning the allocation of national qualifications to the different levels of education as defined by Eurostat.
In Denmark, due to the method of sample selection, which is based on the family unit, the head of household is normally assigned to the female, while the male is considered as spouse. Additionally, from 1992 onwards, the 'extended family' concept is used. This considers cohabiting non-married couples in the same way as married couples thus resulting in an increase in the size of households in Denmark when compared to the earlier series of surveys of 1983 to 1991. For Ireland and Luxembourg data on the 'degree of urbanisation' was not provided. It is hoped to rectify this omission in the 1993 survey.
In the United Kingdom persons shown as 'registered unemployed' are, in fact, claimants to unemployment benefit. Data on recipients of unemployment benefit are not available
Contents of this publication
The tables presented here reflect the changes made to the contents of the survey in 1992. As mentioned above, a number of variables were included for the first time, particularly in the areas of labour force mobility, untypical working patterns and second jobs, and the selection of tables has accordingly been enlarged to include this information. Data on occupations, on educational attainment levels and on household structure are also presented for the first time.
The introduction of these new tables means that the numbering of the tables no longer corresponds with that which was used for the surveys between 1983 and 1991. To facilitate reference to earlier publications, the previously-used table numbers (where appropriate) have been indicated in the table of contents. In making such comparisons, it should be borne in mind that certain definition changes have taken place, so that for example the working-age population now comprises everyone aged 15 years and over (instead of 14 as previously). It should be recalled that the geographical area covered by the survey has also reflected political changes; in particular, the eastern states of Germany are not included in previous publications, except in the 1991 publication where they were included only in the annex.
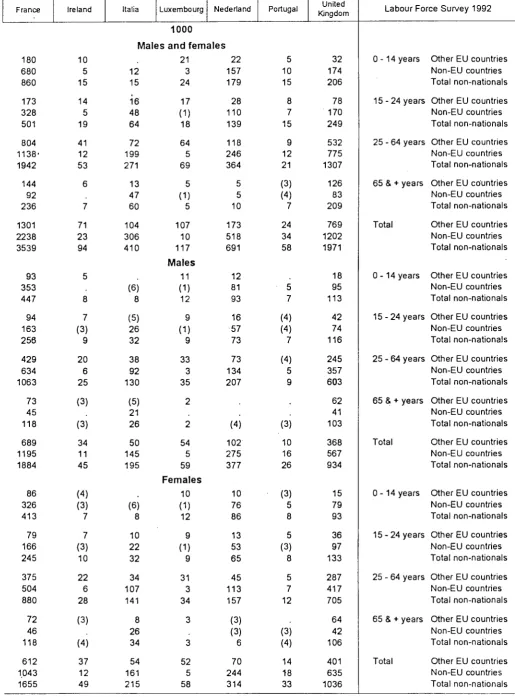
Table 001
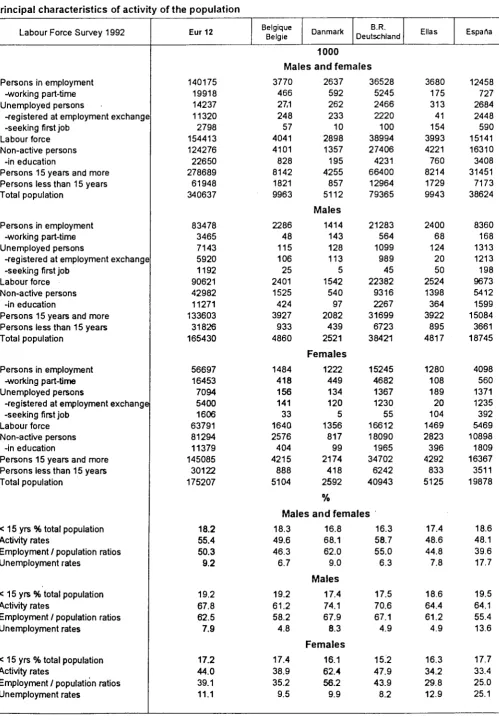
Principal characteristics of activity of the population
Labour Force Survey 1992 Eur 12 Belgique België Danmark Deutschland B.R. Ellas Espana
Persons in employment -working part-time Unemployed persons
-registered at employment exchange -seeking first job
Labour force Non-active persons
-in education
Persons 15 years and more Persons less than 15 years Total population
Persons in employment -working part-time Unemployed persons
-registered at employment exchange -seeking first job
Labour force Non-active persons
-in education
Persons 15 years and more Persons less than 15 years Total population
Persons in employment -working part-time Unemployed persons
-registered at employment exchange -seeking first job
Labour force Non-active persons
-in education
Persons 15 years and more Persons less than 15 years Total population
< 15 yrs % total population Activity rates
Employment / population ratios Unemployment rates
< 15 yrs % total population Activity rates
Employment / population ratios Unemployment rates
< 15 yrs % total population Activity rates
Employment / population ratios Unemployment rates
140175 19918 14237 11320 2798 154413 124276 22650 278689 61948 340637
83478 3465 7143 5920 1192 90621 42982 11271 133603 31826 165430
1000 Males and females 3770
466 27,1 248 57 4041 4101 828 8142 1821 9963
2286 48 115 106 25 2401 1525 424 3927 933 4860
2637 592 262 233 10 2898 1357 195 4255 857 5112 Males
1414 143 128 113 5 1542 540 97 2082 439 2521 Females
36528 5245 2466 2220 100 38994 27406 4231 66400 12964 79365
21283 564 1099 989 45 22382 9316 2267 31699 6723 38421
Males and females
3680 175 313 41 154 3993 4221 760 8214 1729 9943
2400 68 124 20 50 2524 1398 364 3922 895 4817
12458 727 2684 2448 590 15141 16310 3408 31451 7173 38624
8360 168 1313 1213 198 9673 5412 1599 15084 3661 18745
56697 16453 7094 5400 1606 63791 81294 11379 145085 30122 175207
1484
418
156
141
33
1640 2576
404
4215
888
5104
1222
449
134
120
5
1356
817
99
2174
418
2592
15245 4682 1367 1230
55
16612 18090 1965 34702 6242 40943
1280
108
189
20
104
1469 2823
396
4292
833
5125
4098
560
1371 1235
392
5469 10898 1809 16367 3511 19878
18.2 55.4 50.3
9.2
19.2 67.8 62.5
7.9
17.2 44.0 39.1 11.1
18.3 49.6 46.3
6.7
19.2 61.2 58.2
4.8
17.4 38.9 35.2
9.5
16.8 68.1 62.0 9.0
Males
17.4 74.1 67.9 8.3Females
16.1 62.4 56.2
9.9
16.3 58.7 55.0
6.3
17.5 70.6 67.1
4.9
15.2 47.9 43.9
8.2
17.4 48.6 44.8
7.8
18.6 64.4 61.2
4.9
16.3 34.2 29.8 12.9
18.6 48.1 39.6 17.7
19.5 64.1 55.4 13.6
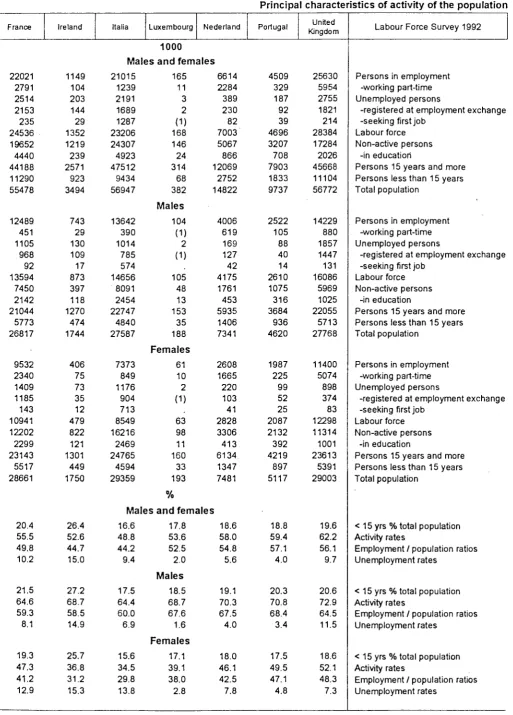
Principal characteristics of activity of the population
France
22021 2791 2514 2153 235 24536 19652 4440 44188 11290 55478
12489 451 1105 968 92 13594 7450 2142 21044 5773 26817
9532 2340 1409 1185 143 10941 12202 2299 23143 5517 28661
20.4 55.5 49.8 10.2
21.5 64.6 59.3 8.1
19.3 47.3 41.2 12.9
Ireland
1149 104 203 144 29 1352 1219 239 2571 923 3494
743 29 130 109 17 873 397 118 1270 474 1744
406 75 73 35 12 479 822 121 1301 449 1750
26.4 52.6 44.7 15.0
27.2 68.7 58.5 14.9
25.7 36.8 31.2 15.3
Italia Luxembourg 1000
Nederland
Males and females 21015
1239 2191 1689 1287 23206 24307 4923 47512 9434 56947
13642 390 1014 785 574 14656 8091 2454 22747 4840 27587
7373 849 1176 904 713 8549 16216 2469 24765 4594 29359
165 11 3 2 (1) 168 146 24 314 68 382
Males
104 (1) 2 (1) 105 48 13 153 35 188 Females
61 10 2 (1) 63 98 11 160 33 193
0/
6614 2284 389 230 82 7003 5067 866 12069 2752 14822
4006 619 169 127 42 4175 1761 453 5935 1406 7341
2608 1665 220 103 41 2828 3306 413 6134 1347 7481 /o
Males and females
16.648.8 44.2 9.4
17.5 64.4 60.0 6.9
15.6 34.5 29.8 13.8
17.8 53.6 52.5 2.0
Males
18.5 68.7 67.6 1.6
Females
17.1 39.1 38.0 2.8
18.6 58.0 54.8 5.6
19.1 70.3 67.5 4.0
18.0 46.1 42.5 7.8
Portugal
4509 329 187 92 39 4696 3207 708 7903 1833 9737
2522 105 88 40 14 2610 1075 316 3684 936 4620
1987 225 99 52 25 2087 2132 392 4219 897 5117
18.8 59.4 57.1 4.0
20.3 70.8 68.4 3.4
17.5 49.5 47.1 4.8
United Kingdom
25630 5954 2755 1821 214 28384 17284 2026 45668 11104 56772
14229 880 1857 1447 131 16086 5969 1025 22055 5713 27768
11400 5074 898 374 83 12298 11314 1001 23613 5391 29003
19.6 62.2 56.1 9.7
20.6 72.9 64.5 11.5
18.6 52.1 48.3 7.3
Labour Force Survey 1992
Persons in employment -working part-time Unemployed persons
-registered at employment exchange -seeking first job
Labour force Non-active persons
-in educatiori
Persons 15 years and more Persons less than 15 years Total population
Persons in employment -working part-time Unemployed persons
-registered at employment exchange -seeking first job
Labour force Non-active persons
-in education
Persons 15 years and more Persons less than 15 years Total population
Persons in employment -working part-time Unemployed persons
-registered at employment exchange -seeking first job
Labour force Non-active persons
-in education
Persons 15 years and more Persons less than 15 years Total population
< 15 yrs % total population Activity rates
Employment / population ratios Unemployment rates
< 15 yrs % total population Activity rates
Employment / population ratios Unemployment rates
< 15 yrs % total population Activity rates
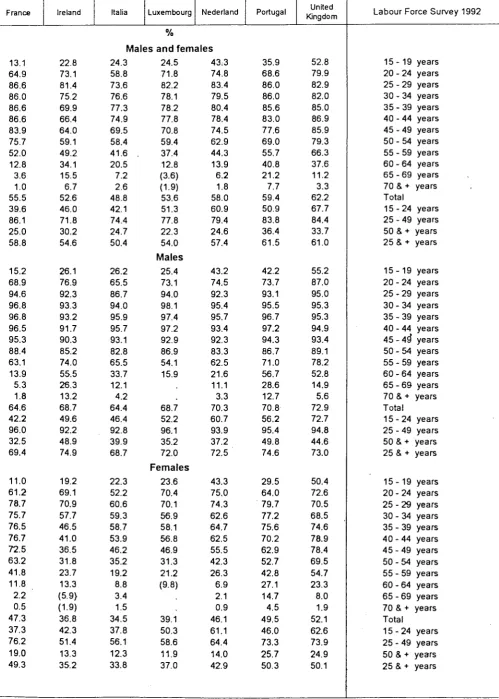
[image:17.595.53.567.72.788.2]Table 002
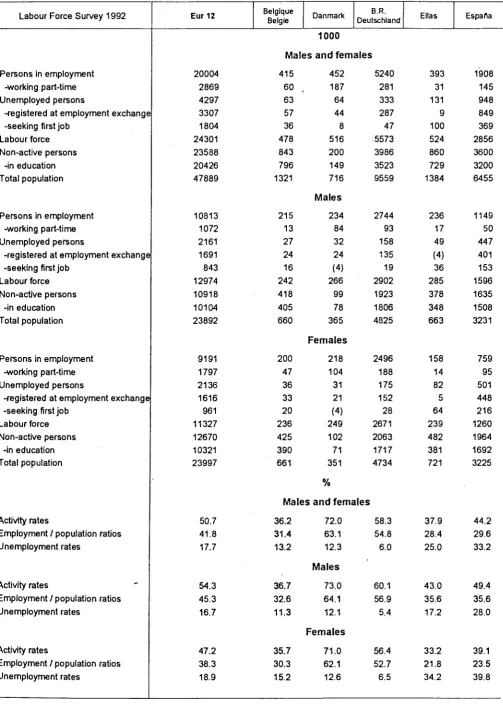
Principal characteristics of activity of young persons aged 15 to 24 years
Labour Force Survey 1992 Eur 12 Belgique België Danmark Deutschland B.R. Ellas EspaAa
Persons in employment -working part-time Unemployed persons
-registered at employment exchange -seeking first job
Labour force Non-active persons
-in education Total population
Persons in employment -working part-time Unemployed persons
-registered at employment exchange -seeking first job
Labour force Non-active persons
-in education Total population
Persons in employment -working part-time Unemployed persons
-registered at employment exchange -seeking first job
Labour force Non-active persons
-in education Total population
Activity rates
Employment / population ratios Unemployment rates
Activity rates
Employment / population ratios Unemployment rates
Activity rates
Employment / population ratios Unemployment rates
1000
Males and females 20004
2869 4297 3307 1804 24301 23588 20426 47889
10813 1072 2161 1691
843
12974 10918 10104 23892
9191 1797 2136 1616
961
11327 12670 10321 23997
50.7 41.8 17.7
54.3 45.3 16.7
47.2 38.3 18.9
415
60
63
57
36
478
843
796
1321
215
13
27
24
16
242
418
405
660
200
47
36
33
20
236
425
390
661
452
187
64
44
8
516
200
149
716
Males
234
84
32
24
(4)
266
99
78
365
Females
218
104
31
21
(4)
249
102
71
351 %
Males and females
36.231.4 13.2
36.7 32.6 11.3
35.7 30.3 15.2
72.0 63.1 12.3
Males
73.0 64.1 12.1
Females
71.0 62.1 12.6
5240
281
333
287
47
5573 3986 3523 9559
2744
93
158
135
19
2902 1923 1806 4825
2496
188
175
152
28
2671 2063 1717 4734
58.3 54.8
6.0
60.1 56.9
5.4
56.4 52.7
6.5
393
31
131
9
100
524
860
729
1384
236
17
49
(4)
36
285
378
348
663
158
14
82
5
64
239
482
381
721
37.9 28.4 25.0
43.0 35.6 17.2
33.2 21.8 34.2
1908
145
948
849
369
2856 3600 3200 6455
1149
50
447
401
153
1596 1635 1508 3231
759
95
501
448
216
1260 1964 1692 3225
44.2 29.6 33.2
49.4 35.6 28.0
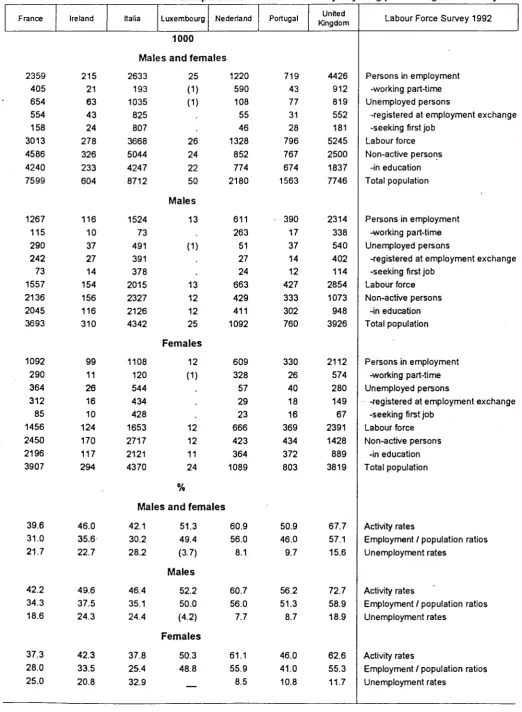
Principal characteristics of activity of young persons aged 15 to 24 years France Ireland Italia Luxembourg Nederland Portugal Kingdom United Labour Force Survey 1992
1000
Males and females
2359405
654
554
158
3013 4586 4240 7599
1267
115
290
242
73
1557 2136 2045 3693
1092
290
364
312
85
1456 2450 2196 3907
39.6 31.0 21.7
42.2 34.3 18.6
37.3 28.0 25.0
215
21
63
43
24
278
326
233
604
116
10
37
27
14
154
156
116
310
99
11
26
16
10
124
170
117
294
46.0 35.6 22.7
49.6 37.5 24.3
42.3 33.5 20.8
2633
193
1035
825
807
3668 5044 4247 8712
1524
73
491
391
378
2015 2327 2126 4342
1108
120
544
434
428
1653 2717 2121 4370
25
(1)
(1)
26
24
22
50 Males
13
(1)
13
12
12
25 Females
12
(1)
12
12
11
24 %
Males a n d females 42.1
30.2 28.2
46.4 35.1 24.4
37.8 25.4 32.9
51.3 49.4 (3.7) Males
52.2 50.0 (4.2) Females 50.3 48.8
1220
590
108
55
46
1328
852
774
2180
611
263
51
27
24
663
429
411
1092
609
328
57
29
23
666
423
364
1089
60.9 56.0
8.1
60.7 56.0
7.7
61.1 55.9
8.5
719
43
77
31
28
796
767
674
1563
390
17
37
14
12
427
333
302
760
330
26
40
18
16
369
434
372
803
50.9 46.0
9.7
56.2 51.3
8.7
46.0 41.0 10.8
4426
912
819
552
181
5245 2500 1837 7746
2314
338
540
402
114
2854 1073
948
3926
2112
574
280
149
67
2391 1428
889
3819
67.7 57.1 15.6
72.7 58.9 18.9
62.6 55.3 11.7
Persons in employment -working part-time Unemployed persons
-registered at employment exchange -seeking first job
Labour force Non-active persons
-in education Total population
Persons in employment -working part-time Unemployed persons
-registered at employment exchange -seeking first job
Labour force Non-active persons
-in education Total population
Persons in employment -working part-time Unemployed persons
-registered at employment exchange -seeking first job
Labour force Non-active persons
-in education Total population
Activity rates
Employment / population ratios Unemployment rates
Activity rates
Employment / population ratios Unemployment rates
Activity rates
[image:19.595.48.571.78.791.2]Table 003
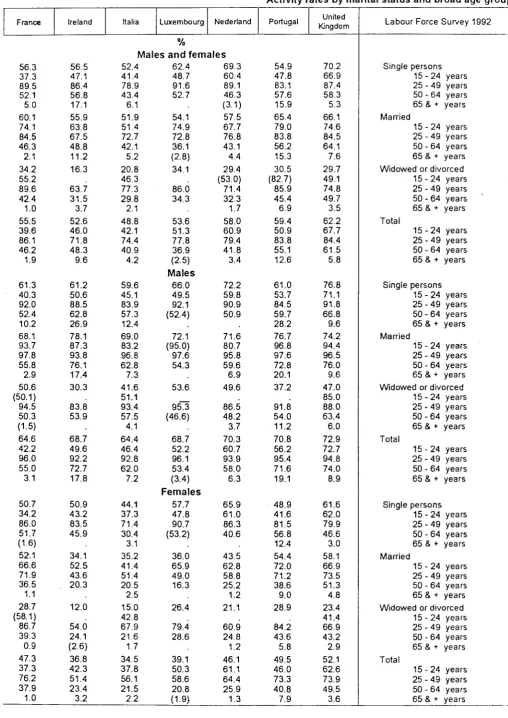
A c t i v i t y r a t e s by a g e g r o u p s
Labour Force Survey 1992 Eur 12 Belgique
België Danmark
BR.
Deutschland Ellas Esparta
M a l e s a n d f e m a l e s 15 20 25 30 35 40 45 50 55 60 65 19 24 29 34 39 44 49 54 59 64 69 70 & + Total 15 25
24 49 50 & + 25 & +
15 20 25 30 35· 40 45 50 55· 60· 65 •19 •24 ■29 •34 •39 •44 •49 •54 ■59 •64 •69 70 & + Total 15 25
24 49 50 & + 25 & +
15 2 0 2 5 30 35 4 0 4 5 50 55 6 0 65 19 24 29 34 39 44 49 54 59 64 69 70 & + Total 15 2 5
24 49 50 & + 25 & +
years years years years years years years years years years years years years years years years years years years years years years years years years years years years years years years years years years years years years years years years years years years years years years years years 30.5 69.1 81.0 81.8 82.5 81.9 78.3 71.2 52.6 23.8 7.2 2.2 55.4 50.7 81.2 28.8 56.4 33.1 73.9 90.7 95.4 96.1 95.8 94.0 88.3 70.2 35.0 10.6 3.7 67.8 54.3 94.3 41.5 70.8 27.9 64.4 71.2 68.1 68.9 67.9 62.7 54.1 35.8 13.5 4.4 1.2 44.0 47.2 68.0 18.6 43.3 7.9 61.4 8 6 . 6 , 85.9 83.5 78.0 71.5 56.1 33.8 12.3 2.6 0.6 49.6 36.2 81.7 18.3 52.2 8.7 62.2 93.1 95.6 95.4 93.9 91.4 78.9 50.3 20.3 3.9 (1.2) 61.2 36.7 94.0 29.5 66.1 7.2 60.6 80.0 75.8 71.3 61.6 51.2 33.7 18.1 5.0
(1.4)
38.9 35.7 69.0 9.3 39.5 64.0 79.7 88.7 92.4 92.5 92.9 91.2 86.1 76.0 36.9 17.2 2.7 68.1 72.0 91.5 37.8 67.3 M a l e s63.8 81.6 91.2 95.9 94.8 95.2 94.6 92.2 83.6 47.2 26.6 4.9 74.1 73.0 94.3 47.0 74.3 F e m a l e s
64.1
77.6
86.1 88.9 90.1 · 90.6 87.5 80.0 68.6 27.3 9.0 1.462.4
71.0
88.6
30.1
60.7
37.6 74.3 80.9 83.9 85.3 86.4 84.3 79.8 56.7 19.8 4.8 1.6 58.7 58.3 84.0 32.9 58.8 40.1 76.5 87.1 95.6 96.8 96.9 95.6 93.0 72.6 30.7 7.0 2.8 70.6 60.1 94.1 46.8 72.5 34.8 72.2 74.3 71.8 74.0 75.7 72.7 66.0 40.9 9.8 3.3 1.0 47.9 56.4 73.7 22.0 46.5 18.0 60.0 74.9 76.6 75.8 74.6 68.3 61.0 49.0 31.7 14.6 3.9 48.6 37.9 74.1 29.6 50.8 19.9 69.2 91.1 96.3 96.8 96.4 93.8 87.0 72.4 46.8 21.4 6.2 64.4 43.0 94.9 44.2 68.7 16.2 51.7 59.6 58.5 57.1 53.2 43.7 36.9 26.9 17.7 8.4 2.0 34.2 33.2 54.5 16.7 34.4Activity rates by age groups
France
13.1 64.9 86.6 86.0 86.6 86.6 83.9 75.7 52.0 12.8 3.6 1.0 55.5 39.6 86.1 25.0 58.8
15.2 68.9 94.6 96.8 96.8 96.5 95.3 88.4 63.1 13.9 5.3 1.8 64.6 42.2 96.0 32.5 69.4
11.0 61.2 78.7 75.7 76.5 76.7 72.5 63.2 41.8 11.8 2.2 0.5 47.3 37.3 76.2 19.0 49.3
Ireland
22.8 73.1 81.4 75.2 69.9 66.4 64.0 59.1 49.2 34.1 15.5 6.7 52.6 46.0 71.8 30.2 54.6
26.1 76.9 92.3 93.3 93.2 91.7 90.3 85.2 74.0 55.5 26.3 13.2 68.7 49.6 92.2 48.9 74.9
19.2 69.1 70.9 57.7 46.5 41.0 36.5 31.8 23.7 13.3 (5.9) (1.9) 36.8 42.3 51.4 13.3 35.2
Italia Luxembourg
%
Nederland
M a l e s a n d f e m a l e s 24.3
58.8 73.6 76.6 77.3 74.9 69.5 58.4 41.6 . 20.5
7.2 2.6 48.8 42.1 74.4 24.7 50.4
26.2 65.5 86.7 94.0 95.9 95.7 93.1 82.8 65.5 33.7 12.1 4.2 64.4 46.4 92.8 39.9 68.7
22.3 52.2 60.6 59.3 58.7 53.9 46.2 35.2 19.2 8.8 3.4 1.5 34.5 37.8 56.1 12.3 33.8
24.5 71.8 82.2 78.1 78.2 77.8 70.8 59.4 37.4 12.8 (3.6) (1.9) 53.6 51.3 77.8 22.3 54.0
Males
25.4 73.1 94.0 98.1 97.4 97.2 92.9 86.9 54.1 15.9
68.7 52.2 96.1 35.2 72.0 F e m a l e s
23.6 70.4 70.1 56.9 58.1 56.8 46.9 31.3 21.2 (9.8)
39.1 50.3 58.6 11.9 37.0
43:3 74.8 83.4 79.5 80.4 78.4 74.5 62.9 44.3 13.9 6.2 1.8 58.0 60.9 79.4 24.6 57.4
43.2 74.5 92.3 95.4 95.7 93.4 92.3 83.3 62.5 21.6 11.1 3.3 70.3 60.7 93.9 37.2 72.5
43.3 75.0 74.3 62.6 64.7 62.5 55.5 42.3 26.3 6.9 2.1 0.9 46.1 61.1 64.4 14.0 42.9
Portugal
35.9 68.6 86.0 86.0 85.6 83.0 77.6 69.0 55.7 40.8 21.2 7.7 59.4 50.9 83.8 36.4 61.5
42.2 73.7 93.1 95.5 96.7 97.2 94.3 86.7 71.0 56.7 28.6 12.7 70.8 56.2 95.4 49.8 74.6
29.5 64.0 79.7 77.2 75.6 70.2 62.9 52.7 42.8 27.1 14.7 4.5 49.5 46.0 73.3 25.7 50.3
United Kingdom
52.8 79.9 82.9 82.0 85.0 86.9 85.9 79.3 66.3 37.6 11.2 3.3 62.2 67.7 84.4 33.7 61.0
55.2 87.0 95.0 95.3 95.3 94.9 93.4 89.1 78.2 52.8 14.9 5.6 72.9 72.7 94.8 44.6 73.0
50.4 72.6 70.5 68.5 74.6 78.9 78.4 69.5 54.7 23.3 8.0 1.9 52.1 62.6 73.9 24.9 50.1
Labour Force Survey 1992
1 5 - 1 9 years 2 0 - 2 4 years 2 5 - 2 9 years 30 - 34 years 35 - 39 years 40 - 44 years 45 - 49 years 50 - 54 years 55 - 59 years 6 0 - 6 4 years 65 - 69 years 70 & + years Total
1 5 - 2 4 years 25 - 4 9 years 50 & + years 25 & + years
1 5 - 1 9 years 2 0 - 2 4 years 2 5 - 2 9 years 3 0 - 3 4 years 35 - 39 years 40 - 44 years 45 - 49* years 5 0 - 5 4 years 55 - 59 years 6 0 - 6 4 years 6 5 - 6 9 years 70 & + years Total
15 - 24 years 2 5 - 4 9 years 50 & + years 25 & + years
1 5 - 1 9 years 20 - 24 years 2 5 - 2 9 years 3 0 - 3 4 years 35 - 39 years 40 - 44 years 45 - 49 years 5 0 - 5 4 years 55 - 59 years 60 - 64 years 6 5 - 6 9 years 70 & + years Total
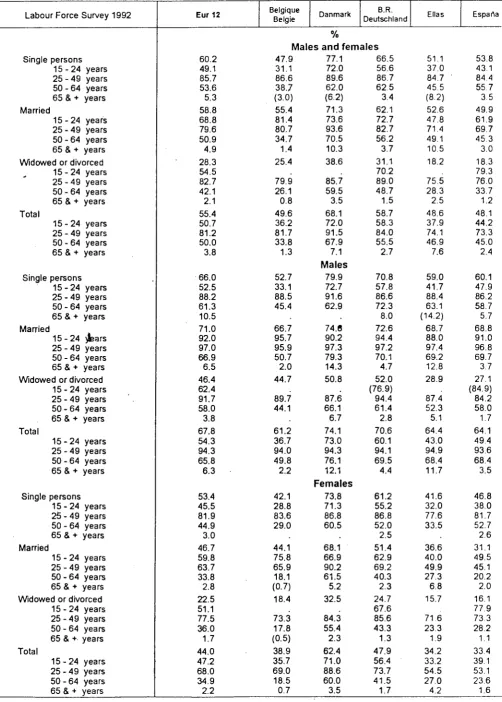
[image:21.595.58.558.83.783.2]Table 004
Activity rates by marital status and broad age groups
Labour Force Survey 1992 Eur 12 Belgique
België Danmark
B.R.
Deutschland Ellas Esparta
Single persons 1 5 2 4 years 25 49 years 5 0 6 4 years 65 & + years Married
1 5 2 4 years 25 49 years 50 64 years 65 & + years Widowed or divorced 1 5 2 4 years 2 5 4 9 years 50 64 years 65 & + years Total
1 5 2 4 2 5 4 9 5 0 6 4 65 & +
years years years years
Single persons 1 5 2 4 years 25 49 years 50 64 years 65 & + years Married
1 5 2 4 ylears 2 5 4 9 years 50 64 years 65 & + years Widowed or divorced 1 5 2 4 years 25 49 years 5 0 6 4 years 65 & + years Total
15 24 2 5 4 9 5 0 6 4 65 & +
years years years years
Single persons 1 5 2 4 years 2 5 4 9 years 50 64 years 65 & + years Married
1 5 2 4 years 25 49 years 50 64 years 65 & + years Widowed or divorced 1 5 2 4 years 25 49 years 50 64 years 65 & +■ years Total
1 5 2 4 2 5 4 9 5 0 6 4 65 & +
years years years years
M a l e s a n d f e m a l e s 60.2
49.1 85.7 53.6 5.3 58.8 68.8 79.6 50.9 4.9 28.3 54.5 82.7 42.1 2.1 55.4 50.7 81.2 50.0 3.8
66.0 52.5 88.2 61.3 10.5 71.0 92.0 97.0 66.9 6.5 46.4 62.4 91.7 58.0 3.8 67.8 54.3 94.3 65.8 6.3
53.4 45.5 81.9 44.9 3.0 46.7 59.8 63.7 33.8 2.8
22.5 51.1 77.5 36.0 1.7
44.0 47.2 68.0 34.9 2.2
47.9 31.1 86.6 38.7 (3.0) 55.4 81.4 80.7 34.7 1.4
77.1 72.0 89.6 62.0 (6.2) 71.3 73.6 93.6 70.5 10.3
66.5 56.6 86.7 625 3.4 62.1 72.7 82.7 56.2 3.7
51.1 37.0 84.7 ■ 455 (8.2) 52.6 47.8 71.4 49.1 10.5
53.8 43.1 844 557 3.5 49.9 61.9 69.7 453 3.0 25.4
79.9
26.1 0.8
49.6 36.2 81.7 33.8 1.3
52.7 33.1 88.5 45.4
66.7 95.7 95.9 50.7 2.0 44.7 89.7 44.1
61.2 36.7 94.0 49.8 2.2
42.1 28.8 83.6 29.0 44.1 75.8 65.9 18.1 (0.7)
18.4
73.3 17.8 (0.5)
38.9 35.7 69.0 18.5 0.7
38.6 85.7 59.5 3.5 68.1 72.0 91.5 67.9
7.1
Males
79.9 72.7 91.6 62.9 74.β 90.2 97.3 79.3 14.3 50.887.6 66.1 6.7 74.1 73.0 94.3 76.1 12.1
Females
73.8 71.3 86.8 60.5
68.1 66.9 90.2 61.5 5.2 32.5 84.3 55.4 2.3 62.4 71.0 88.6 60.0 3.5
31.1 70.2 89.0 48.7 1.5 58.7 58.3 84.0 55.5 2.7
70.8 57.8 86.6 72.3 8.0 72.6 94.4 97.2 70.1 4.7 52.0 (76.9) 94.4 61.4 2.8 70.6 60.1 94.1 69.5 4.4
61.2 55.2 86.8 52.0 2.5 51.4 62.9 69.2 40.3 2.3
24.7 67.6 85.6 43.3 1.3 47.9 56.4 73.7 41.5 1.7
18.2 75.5 28.3 2.5 48.6 37.9 74.1 46.9 7.6
59.0 41.7 88.4 63.1 (14.2)
68.7 88.0 97.4 69.2 12.8 28.9
87.4 52.3 5.1
64.4 43.0 94.9 68.4 11.7
41.6 32.0 77.6 33.5
36.6 40.0 49.9 27.3 6.8 15.7
71.6 23.3
1.9 34.2 33.2 54.5 27.0 4.2
18.3 79.3 76.0 33.7 1.2
48.1 44.2 73.3 45.0 2.4
60.1 47.9 86.2 58.7 5.7 68.8 91.0 96.8 69.7 3.7
27.1
(84.9) 84.2 58.0 1.7 64.1 4 9 4 93.6 68.4 3.5
46.8 38.0 81.7 52.7 2.6 31.1 49.5 45.1 20.2 2.0
[image:22.595.46.549.75.778.2]Activity rates by marital status and broad age groups
France 56.3 37.3 89.5 52.1 5.0 60.1 74.1 84.5 46.3 2.1 34.2 55.2 89.6 42.4 1.0 55.5 39.6 86.1 46.2 1.9 61.3 40.3 92.0 52.4 10.2 68.1 93.7 97.8 55.8 2.9 50.6 (50.1) 94.5 50.3 (1.5) 64.6 42.2 96.0 55.0 3.1 50.7 34.2 86.0 51.7 (1.6) 52.1 66.6 71.9 36.5 1.1 28.7 (58.1) 86.7 39.3 0.9 47.3 37.3 76.2 37.9 1.0 Ireland 56.5 47.1 86.4 56.8 17.1 55.9 63.8 67.5 48.8 11.2 16.3 63.7 31.5 3.7 52.6 46.0 71.8 48.3 9.6 61.2 50.6 88.5 62.8 26.9 78.1 87.3 93.8 76.1 17.4 30.3 83.8 53.9 68.7 49.6 92.2 72.7 17.8 50.9 43.2 83.5 45.9 34.1 52.5 43.6 20.3 12.0 54.0 24.1 (2.6) 36.8 42.3 51.4 23.4 3.2Italia Luxembourg Nederland
%
Males and females
52.4 41.4 78.9 43.4 6.1 51.9 51.4 72.7 42.1 5.2 20.8 46.3 77.3 29.8 2.1 48.8 42.1 74.4 40.9 4.2 59.6 45.1 83.9 57.3 12.4 69.0 83.2 96.8 62.8 7.3 41.6 51.1 93.4 57.5 4.1 64.4 46.4 92.8 62.0 7.2 44.1 37.3 71.4 30.4 3.1 35.2 41.4 51.4 20.5 2.5 15.0 42.8 67.9 21.6 1.7 34.5 37.8 56.1 21.5 2.2 62.4 48.7 91.6 52.7 54.1 74.9 72.8 36.1 (2.8) 34.1 86.0 34.3 53.6 51.3 77.8 36.9 (2.5)Males
66.0 49.5 92.1 (52.4) 72.1 (95.0) 97.6 54.3 53.6953
(46.6) 68.7 52.2 96.1 53.4 (3.4)Females
57.7 47.8 90.7 (53.2) 36.0 65.9 49.0 16.3 26.4 79.4 28.6 39.1 50.3 58.6 20.8 (1.9) 69.3 60.4 89.1 46.3 (3.1) 57.5 67.7 76.8 43.1 4.4 29.4 (53.0) 71.4 32.3 1.7 58.0 60.9 79.4 41.8 3.4 72.2 59.8 90.9 50.9 71.6 80.7 95.8 59.6 6.9 49.6 86.5 48.2 3.7 70.3 60.7 93.9 58.0 6.3 65.9 61.0 86.3 40.6 43.5 62.8 58.8 25.2 1.2 21.1 60.9 24.8 1.2 46.1 61.1 64.4 25.9 1.3 Portugal 54.9 47.8 83.1 57.6 15.9 65.4 79.0 83.8 56.2 15.3 30.5 (82.7) 85.9 45.4 6.9 59.4 50.9 83.8 55.1 12.6 61.0 53.7 84.5 59.7 28.2 76.7 96.8 97.6 72.8 20.1 37.2 91.8 54.0 11.2 70.8 56.2 95.4 71.6 19.1 48.9 41.6 81.5 56.8 12.4 54.4 72.0 71.2 38.6 9.0 28.9 84.2 43.6 5.8 49.5 46.0 73.3 40.8 7.9 United Kingdom 70.2 66.9 87.4 58.3 5.3 66.1 74.6 84.5 64.1 7.6 29.7 49.1 74.8 49.7 3.5 62.2 67.7 84.4 61.5 5.8 76.8 71.1 91.8 66.8 9.6 74.2 94.4 96.5 76.0 9.6 47.0 85.0 88.0 63.4 6.0 72.9 72.7 94.8 74.0 8.9 61.6 62.0 79.9 46.6 3.0 58.1 66.9 73.5 51.3 4.8 23.4 41.4 66.9 43.2 2.9 52.1 62.6 73.9 49.5 3.6 Laboi Singleir Force Survey 1992
persons 1 5 - 2 4 years 25 - 49 years 50 - 64 years 65 & + years Married
15 - 24 years 2 5 - 4 9 years 50 - 64 years 65 & + years Widowed or divorced
Total
Single
1 5 - 2 4 years 25 - 49 years 50 - 6 4 years 65 & + years 1 5 - 2 4 years 25 - 49 years 50 - 64 years 65 & + years persons
15 - 24 years 25 - 49 years 50 - 64 years 65 & + years Married
1 5 - 2 4 years 2 5 - 4 9 years 50 - 64 years 65 & + years Widowed or divorced
Total
Single
1 5 - 2 4 years 25 - 49 years 50 - 64 years 65 & + years 1 5 - 2 4 years 2 5 - 4 9 years 50 - 64 years 65 & + years
persons 15 - 24 years 25 - 49 years 50 - 64 years 65 & + years Married
15 - 24 years 2 5 - 4 9 years 50 - 64 years 65 & + years Widowed or divorced
Total
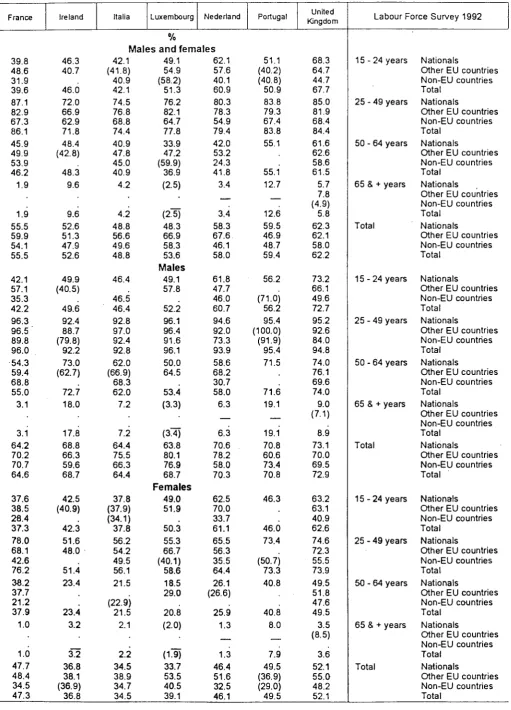
[image:23.595.46.555.77.796.2]Table 005
Activity rates
by nationality and broad age g r o u p s Labour Force Survey 199215 24 years
25 49 years
5 0 6 4 years
65 & + years
Total
1 5 2 4 years
25 49 years
5 0 6 4 years
65 & + years
Total
1 5 2 4 years
2 5 4 9 years
5 0 6 4 years
65 & + years
Total
Nationals
Other EU countries NonEU countries Total
Nationals
Other EU countries NonEU countries Total
Nationals
Other EU countries NonEU countries Total
Nationals
Other EU countries NonEU countries Total
Nationals
Other EU countries NonEU countries Total
Nationals
Other EU countries NonEU countries Total
Nationals
Other EU countries NonEU countries Total
Nationals
Other EU countries NonEU countries Total
Nationals
Other EU countries NonEU countries Total
Nationals
Other EU countries NonEU countries Total
Nationals
Other EU countries NonEU countries Total
Nationals
Other EU countries NonEU countries Total
Nationals
Other EU countries NonEU countries Total
Nationals
Other EU countries NonEU countries Total
Nationals
Other EU countries NonEU countries Total
Eur 12
51.0 53.6 43.3 50.7 81.6 81.0 68.9 81.2 49.8 55.0 58.8 50.0 3.8 4.8 5.4 3.8 55.2 62.7 58.3 55.4
54.4 58.5 50.2 54.3 94.6 94.5 87.0 94.3 65.7 67.1 71.5 65.8 6.3 5.8 7.5 6.3 67.6 73.8 72.4 67.8
47.6 48.4 35.8 47.2 68.7 65.3 49.6 68.0 34.8 40.1 37.3 34.9 2.2 3.8 (3.3) 2.2 43.9 50.1 42.4 44.0
Belgique
België Danmark
B.R. Deutschland
%
Males and females
36.6 37.9 26.9 36.2 83.2 76.0 53.2 81.7 34.5 25.0 25.4 33.8 1.3
1.3 49.9 49.3 40.2 49.6
36.9 38.7 31.5 36.7 94.9 90.8 75.6 94.0 51.2 36.5 34.1 49.8 2.3
2.2 61.4 61.3 53.6 61.2
36.4 37.2 21.3 35.7 71.2 56.1 30.2 69.0 19.1 11.7 18.5 0.7
ÖJ
39.5 35.2 24.5 38.9
72.6 47.0 72.0 91.9 93.6 71.1 91.5 67.9 (68.8) 66.7 67.9 7.0
7.1 68.2 76.1 62.6 68.1
Males
73.6 (47.8) 73.0 94.7 100.0 74.2 94.3 76.1 (74.1) 76.1 12.0
12.1 74.2 80.8 66.5 74.1
Females
71.6(46.4) 71.0 89.0 (81.8) 67.7 88.6 60.1
(60.7) 60.0 3.5
3~5 62.4 67.9 58.9 62.4
59.2 59.8 49.2 58.3 85.0 82.3 72.0 84.0 54.9 67.0 68.5 55.5 2.6 (7.4) 7.1 2.7 58.2 70.7 63.8 58.7
60.2 66.6 57.7 60.1 94.5 95.3 88.3 94.1 68.9 78.7 79.7 69.5 4.3 (13.7) (10.6) 4.4 69.9 82.4 77.1 70.6
58.1 52.5 39.1 56.4 75.3 65.6 52.9 73.7 41.3 47.5 46.7 41.5 1.7
1.7 47.8 55.6 47.0 47.9
Ellas
37.8 46.1 37.9 74.1 63.8 76.4 74.1 46.9 (42.2) 46.9 7.6
7.6 48.5 56.5 56.8 48.6
42.9 53.9 43.0 95.0 93.1 94.9 68.4 (65.5) 68.4 11.7
11.7 64.3 (69.6) 72.2 64.4
33.1 (39.2) 33.2 54.5 (53.9) 59.4 54.5 27.0
27.0 4.2
4.2 34.1 (49.2) 42.2 34.2
Esparta
44.2 58.6 43.4 44.2 73.3 70.3 73.7 73.3 45.0 (29.0) 52.4 45.0 2.4
2~4 48.1 50.2 59.2 48.1
49.4 (47.5) 49.4 93.7 91.3 92.4 93.6 6β.5 (74.9) 68.4 3.5
3~5 64.1 59.1 75.8 64.1
39.0 (61.0) (39.6) 39.1 53.1 52.5 56.4 53.1 23.5
23.6 1.6