eurostat
ELECTRICITY PRICES
PRIX DE L'ÉLECTRICITÉ
1980-1S88
I
Energy and industryÉnergie et industrie
eurostat
OFICINA ESTADÍSTICA DE LAS COMUNIDADES EUROPEAS DE EUROPÆISKE FÆLLESSKABERS STATISTISKE KONTOR STATISTISCHES AMT DER EUROPÄISCHEN GEMEINSCHAFTEN
ΣΤΑΤΙΣΤΙΚΗ ΥΠΗΡΕΣΙΑ ΤΩΝ ΕΥΡΩΠΑΪΚΩΝ ΚΟΙΝΟΤΗΤΩΝ
STATISTICAL OFFICE OF THE EUROPEAN COMMUNITIES OFFICE STATISTIQUE DES COMMUNAUTÉS EUROPÉENNES ISTITUTO STATISTICO DELLE COMUNITÀ EUROPEE
BUREAU VOOR DE STATISTIEK DER EUROPESE GEMEENSCHAPPEN SERVIÇO DE ESTATfSTICA DAS COMUNIDADES EUROPEIAS
L-2920 Luxembourg - Tél. 43011 - Télex: Comeur Lu 3423
B-1049 Bruxelles, bâtiment Berlaymont, rue de la Loi 200 (bureau de liaison) - Tél. 2351111
Las publicaciones de Eurostat están clasificadas por t e m a s y por series. La clasificación se encuentra al final de la obra. Para mayor información sobre las publicaciones, rogamos se pongan en contacto con Eurostat.
Para los pedidos, diríjanse a las oficinas de venta cuyas direcciones f i g u r a n en la página interior de la contracubierta.
Eurostats publikationer er klassificeret efter emne og serie. En oversigt herover findes bag i hæftet. Yderligere oplysninger o m publikationerne kan fås ved henvendelse til Eurostat.
Bestilling kan afgives til de salgssteder, der er anført på omslagets side 3.
Die Veröffentlichungen v o n Eurostat sind nach Themenkreisen und Reihen gegliedert. Die Gliederung ist hinten in j e d e m Band aufgeführt. Genauere A u s k ü n f t e über die V e r ö f f e n t l i c h u n g e n erteilt Eurostat. Ihre Bestellungen richten Sie bitte an die Verkaufsbüros, deren A n s c h r i f t e n jeweils auf der dritten Umschlagseite der Veröffentlichungen zu f i n d e n sind.
Οι εκδόσεις της Eurostat ταξινομούνται κατά θέμα και κατά σειρά. Η ακριβής ταξινόμηση αναφέρεται στο τέλος κάθε έκδοσης. Για λεπτομερέστερες πληροφορίες σχετικά με τις εκδόσεις, μπορείτε να απευθύνεσθε στην Eurostat.
Για τις παραγγελίες μπορείτε να απευθύνεσθε στα γραφεία πώλησης, των οποίων οι διευθύνσεις αναγράφονται στη σελίδα 3 του εξωφύλλου.
Eurostat's publications are classified according to themes and series. This classification is indicated at the end of the publication. For more detailed information on publications, contact Eurostat.
Orders are obtainable f r o m the sales offices mentioned on the inside back cover.
Les publications de l'Eurostat sont classées par thème et par série. Cette classification est précisée à la fin de l'ouvrage. Pour des informations plus détaillées sur les publications, contactez l'Eurostat.
Pour les commandes, adressez-vous aux bureaux de vente dont les adresses sont indiquées à la page 3 de la couverture.
Le pubblicazioni dell'Eurostat sono classificate per tema e per serie. Tale classificazione è precisata alla fine dell'opera. Per informazioni più dettagliate sulle pubblicazioni rivolgersi all'Eurostat.
Per eventuali ordinazioni rivolgersi a uno degli uffici di vendita i cui indirizzi figurano nella 3° pagina della copertina.
De publikaties van Eurostat zijn ingedeeld naar onderwerp en serie. Deze indeling is achter in het boek opgenomen. Voor nadere informatie over de publikaties kunt u zich wenden tot Eurostat.
Cataloguing data can be found at the end of this publication. Une fiche bibliographique figure à la fin de l'ouvrage.
Pour toute information concer-For ail information concerning this nant cette publication, s'adresser publication, contact: à :
Alan RYAN Alan RYAN
Tel. Luxembourg 4301-4215 Tél. Luxembourg 4301-4215
Luxembourg : Office des publications officielles des Communautés européennes, 1988
ISBN 92-825-8934-X
Cat. : CA-53-88-318-2A-C
© CECA-CEE-CEEA, Bruxelles · Luxembourg, 1988
Reproduction is authorized, except for commercial purposes, provided the source is acknowledged.
CONTENTS / SOMMAIRE
I. INTRODUCTION 7
II. CONDITIONS AND METHODS 8
CONDITIONS ET METHODES 23
III. UNITS OF VALUE 15
UNITES DE VALEUR 31
IV. TAXES 18
FISCALITE 34
V. ELECTRICITY PRICES IN NATIONAL CURRENCIES BY COUNTRY
PRIX DE L'ELECTRICITE EN MONNAIES NATIONALES PAR PAYS
1. Households / Usages domestiques
Belgique - Bruxelles ; Danmark - Kobenhavn 39
Danmark - Nord Sjælland ; Deutschland - Düsseldorf 40
Deutschland - Hamburg, Hannover 41
Deutschland - Westliche Gebiet, Frankfurt/M 42
Deutschland - Stuttgart, München 43
Deutschland - Südliche Gebiet ; Ellas - Athinai 44
Espana - Madrid ; France - Paris 45
France - Lille, Strasbourg 46
France - Lyon, Marseille.. 47
France - Toulouse > Ireland - Dublin 48
Italia - Settentr. e centrale ; Meridionale e Insulare 49
G.D. Luxembourg - Luxembourg ; Nederland - Rotterdam 50
Nederland - Noord Holland, Noord Brabant 51
United-Kingdom - Leeds, Birmingham 53
United-Kingdom - Glasgow 54
2. Industry / Usages Industriels
Belgique - Bruxelles ; Danmark - Kebenhavn 55
Danmark - Nord Sjælland ; Deutschland - Düsseldorf 56
Deutschland - Hamburg, Hannover 57
Deutschland - Westliche Gebiet, Frankfurt/M 58
Deutschland - Stuttgart, München 59
Deutschland - Südliche Gebiet ; Ellas - Athinai 60
Espana - Madrid y France - Paris 61
France - Lille, Strasbourg 62
France - Lyon ; Ireland - Dublin 63
Italia - Settentr. e Centrale ; Meridionale e Insulare 64
G.D. Luxembourg - Luxembourg 50% , Luxembourg 0% 65
G.D. Luxembourg - Luxembourg 100%; Nederland - Rotterdam... 66
Nederland - Noord Holland, Noord Brabant 67
Portugal - Lisboa ; United Kingdom - London 68
United-Kingdom - Leeds, Birmingham 69
United-Kingdom - Glasgow 70
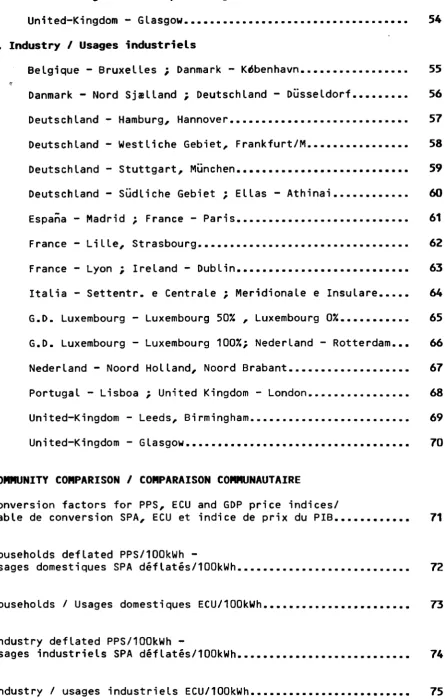
VI. COMMUNITY COMPARISON / COMPARAISON COMMUNAUTAIRE
[image:6.595.89.535.47.747.2]Conversion factors for PPS, ECU and GDP price indices/
Table de conversion SPA, ECU et indice de prix du PIB 71
Households deflated PPS/100kWh
-Usages domestiques SPA déflatés/100kWh 72
Households / Usages domestiques ECU/100kWh 73
Industry deflated PPS/100kWh
-Usages industriels SPA déf latés/100kWh 74
SYMBOLS AND ABBREVIATIONS / SIGNES ET ABBREVIATIONS
-/
O
Χ
0
NIL
Data less than half the
unit used
No data avai lable
Per cent
Annual average percentage
increase
Néant
Donnée inférieure à la moitié
de l'unité uti U s é e
Donnée non disponible
Pourcentage
Pourcentage moyen d'évolution
annuel
V
kV
kVA
kW
h
kWh
GWh
ηVolt
Kilovolt (= 1 000 V)
Kilovoltampere
Kilowatt
Hour
Kilowatthour
Gigawatthour (10 kWh)
Number
Volt
Kilovolt (= 1 000 V)
Kilovoltampere
Kilowatt
Heure
Kilowattheure
Gigawattheure (10 kWh)
Nombre
BFR
Belgian franc
DKR
ére
Danish crown, ére=1/100 DKR
DM
pf
German mark. Pfennig=1/100 DM
DRA
Greek drachma
PTA
Peseta
FF
French franc, centime
IR£
ρ
Irish pound, penny=1/100 IR£
LIT
Italian lira
LFR
Luxembourg franc
HFL cent
Dutch guilder, cent
ESC
Escudo
UK£
ρ
Pound sterling, penny=1/100 UK£
PPS/SPA
Purchasing power standard
ECU
European currency unit
Franc beige
Couronne danoise, ére
Deutsche Mark, Pfennig
Drachme grecque
Peseta espagnole
Franc français, centime
Livre irlandaise, pence
Lire italienne
Franc luxembourgeois
Florin néerlandais, cent
Escudo portugais
Livre sterling, pence
Standard de pourvoir d'achat
Unité monétaire européenne
EUR
12
Total of the member countries
of the European Communities
EUROSTAT
Statistical office of the
European Communities
Ensemble des Etats membres des
Communautés européennes
I. INTRODUCTION
The present publication contains the most recent prices, valid in 1988 together with prices for 1980 (base year for comparisons) 1985, 1986 and 1987.
The definitions and methods remain the same as those used in previous studies, so that the development of electricity prices can be observed over a very long time series.
Other publications in this series have, in addition to giving the same range of price information as seen here, described the structure of the electricity industry by country, detailed the tariffs applied and analysed the results. The most recent was "Electricity prices 1980-1987" catalogue n° CA-49-87-793-EN-C.
For reasons of economy this publication is only available in two Languages : English and French.
The survey on which the study is based was conducted by the Statistical Office of the European communities and would not have been possible without the cooperation of the electricity companies and the professional associations, to whom we express our sincere thanks.
******************************
I. INTRODUCTION
La présente publication présente les prix les plus récents valables pour 1988, ainsi que ceux de 1980 (année de base pour les comparaisons) et de 1985, 1986 et 1987.
Les définitions et méthodes restent identiques à celles des études antérieures sur ce sujet, de sorte qu'il est possible de suivre l'évolution des prix de l'électricité sur une très longue série chronologique.
Les études antérieures contiennent, en plus des séries de prix reproduites ici, une description de l'industrie électrique par pays, un exposé des tarifs appliqués et une analyse des résultats. La publication la plus récente est "Prix de l'électricité 1980-1987" n° de catalogue CA-49-87-793-FR-C.
Pour des raisons d'économie, cette publication n'est disponible qu'en deux langues : anglais et français.
II. CONDITIONS AND METHODS
1. SCOPE AND LOCATIONS
The present study aims to show the actual price of electricity paid by the consumer in the member countries of the European Community.
The prices are recorded at the beginning of each year based on the tariffs, contracts, conditions and rules in force at that time.
It is concerned with the actual price paid by the electricity consumer, corresponding to the invoiced delivery price to the consumer at the beginning of each year including any eventual rebates and subsidies. Our consumers are defined as those who purchase electricity for their own use and exclude those who offer it for resale. We have not considered the bulk price paid by the electricity distributors.
As regards consumers, the study considers all types of customers supplied through the public distribution network with low, medium and high-voltage electricity. In the interesjts "of simplified presentation, consumers are subdivided into two groups, one for domestic and the other for industrial users. The survey does not cover certain industrial consumers :
(i) who themselves produce part of their electrical energy requirement;
(ii) who purchase electricity under special contract terms because of their exceptionally high power requirements and consumption demand.
These exceptions are mainly steelmaking and chemical industries, or those engaged in the production of aluminium and other metals by electrolysis, railways, etc.
Most of these industries consume over 10 million kWh annually. They are few in number, but nevertheless consume an appreciable part of the total electrical energy supplied.
In order to reflect as accurately as possible the real position of consumers, it seemed advisable to record prices at selected locations, i.e. towns, conurbations or distribution networks, rather than give average prices per country.
The prices were
Belgium
Denmark
FR of Germany
Greece
Spain
France
Ireland
Italy
Luxembourg
Netherlands
Portugal
United Kingdom
recorded in the following towns or conurbations :
: The country as a whole (standard national tariff).
: Copenhagen (KB), North Zealand (NESA).
: Hamburg, Hanover, Düsseldorf, Frankfurt am Main, Stuttgart, Munich, Western Zone, Southern Zone.
: Athens (standard national tariff).
: Madrid (standard national tariff).
: Lille, Paris, Marseille, Lyon, Toulouse, Strasbourg.
: Dublin.
: Northern and central Italy, southern Italy and the islands.
: Grand Duchy (Cegedel).
: Rotterdam (GEB), North Holland (PEN), North Brabant (PNEM).
: Lisbon.
: London, Glasgow, Leeds, Birmingham.
Certain towns selected are representative of larger regions.
2. STANDARD CONSUMERS
The survey is based on the system of standard consumers, i.e. the prices are recorded for certain levels of electricity consumption and under certain conditions of supply, chosen as being representative of the population of electricity consumers. These standard levels of consumption remain fixed from one year to the next and for all the countries, this being one of the primary conditions for spatial and temporal comparability of prices.
Two groups of standard consumers are taken
Five domestic standard consumers (supply at low voltage) coded Dg to Dg have been taken :
Standard consumer
r
D a
D
b
D CDd
D
Annual
Total
600
1 200
3 500
7 500
20 000
consumption kWh
(of which nigh
-(1 300)
(2 500)
(15 000)
Approx.
subscribed Standard dwelling
4= 3 50m 2 rooms+kitchen
3 - 4 70m 3 rooms+kitchen
4 - 9 90m 4 rooms+kitchen
6 - 9 100m 4 rooms+kitchen
-> 9 120m 5 rooms+kitchen
As a guideline these standard consumers may be expected to possess the following household facilities and appliances :
D Lighting, .radio, television, refrigerator, small electric appliances;
D. as for D plus washing machine or dishwasher;
D D . as for D. with washing machine and dishwasher plus storage water
e d . . b
heater;D "all-electric" system with water heater and electric central heating operating on a storage basis.
Seven industrial standard consumers (for voltage see point 4) coded I to I have
g
Standard consumer
T :b
d e :f g
been taken :
Annual consumption
kWh
30 000 50 000 160 000 1 250 000 2 000 000 10 000 000 24 000 000
Maximum demand in kW
30
50
100
500
500
2 500 4 000
Annual load factor h
1 000 1 000 1 600 2 500 4 000 4 000 6 000
(1)
E.g. : vacuum cleaner, electric toaster, hair dryer, food mixer,The maximum demand is the maximum offtake in any quarter of an hour recorded in one year, expressed in kilowatts (kW). The price of supply
is calculated for cos f = 0.9. The annual load factor determines the
regularity of consumer offtake of electricity from the grid during the year. The longer this time the more even the pattern of consumption during the 8 760 hours of the year. It indicates the number of hours in which the consumer would reach his annual consumtion level if the demand
level were permanently equal to maximum demand.
Additional details are sometimes needed before the tariffs can be applied :
(i) In the case of tariffs based on half hourly maximum demand, the maximum demand of the standard consumer is multiplied by a coefficient of 0.98.
(ii) In the case of tariffs based on a maximum demand expressed in kVA an adjustment is made by dividing the standard consumer's maximum demand in kW by the coefficient cosf^ 0.90.
(iii) In the case of tariffs based on maximum demand readings more frequent than once a year the standing charge is multiplied by the following coefficients :
Table of power correction coefficients
Standard consumers
Annual
Maximum
Maximum demand
Maximum demand
load factor
monthly demand
two-monthly
three-monthly
: Xa Xb
: 1 000h
0,81
0,83
0,86
h
1 600h
0,83
0,85
0,88
lä
2 500h
0,85
0,87
0,90
I t
4
5 *f
000h
0,90
0,91
0,95
'g
6 000h
0,96
0,97
0,98
Average of the three highest values for
max. monthly demand 0,94 0,95 0,96 0,98 0,99
Average of the two highest values for
max. monthly demand 0,96 0,97 0,98 0,99 0,995
Annual max. demand
(basic principle) 1 1 1 1 1
Standard consumer
Γ
Jb
_c id Te Zi
g
Annual load factor
h
1 000 1 000 1 600 2 500 4 000 4 000 6 000
Annual consumption
1 000 kWh
30 50 160 1 250 2 000 10 000 24 000
2
7
eh
7 h
0
0
11 197 438 190 140
Αι an to
2
8
inual consumption ( in 1 000 ged at off-peak rates accorc
the
8 h
0
0
13 225 500 500 160
average dai ly off-peak peri
9 h
0
0
16 262 580 2 900 9 120
10 h
0
0
19 300 660 3 300 10 080
duration ode
11 h
0
0
22 338 740 3 700 4 11 040 12
kWh)
m g of
12 h
0
0
25 375 820 100 000
If off peak rates are charged during other periods, for example all day Sunday we have only taken one half as supplementary off peak hours.
Account has not been taken of changes in tariff parameters during the course of a year. In other words no weighted price is calculated for a year.
3. DEFINITION OF THE PRICE LEVELS RECORDED
All prices are shown per unit of electricity sold, that is per kilowatt hour (kWh). The results represent the unit price actually paid at the beginning of each year and take account of the relevant tariff, parameter, index, etc. applicable as from 1 January. In the case of tariffs or contracts with short term indices (month, quarter) it is the index which is in force during January which is applied. This means that any changes in the tariff structure during the year are not taken into account, i.e no price weighting is applied to the year. The prices include meter rental, the standing charge and the commodity rate. They do not include the initial installation charge to the consumer.
If there are several possible tariffs, it is the tariff which is most advantageous to the consumer that is taken into account, after the elimination of the tariffs which are not used in practice or which apply only to a marginal or negligible number of users.
When there are only quasi-tariffs, special contracts, or freely negotiated prices, the most commonly found price (most representative) for the given supply conditions has been recorded. In the case of freely negotiated prices or contracts, the returns relate respectively to the bills paid during the month of January or to the prices
In the case of a consumer having two separate meters or a switch meter (e.g. to record night and day consumption), the price reflects total consumption.
Account has been taken of special tariff or supplementary arrangements which may exist for reactive power.
Three price levels are shown : (i) the price net of tax;
(ii) the price excluding VAT but including all other taxes; (iii) the selling price (inclusive of all taxes).
The price excluding tax is obtained directly from the tariffs or contracts.
The price excluding VAT includes, where payable, other specific taxes which is interesting in cases where VAT is deductible.
The price inclusive of all taxes corresponds to the sum paid by the consumer.
"Taxes" is used here to mean fiscal and para-fiscal levies applying directly to electricity at the stage of sale at the consumer. These taxes may be levied at the national, regional, local or municipal
level, etc. by the State, regional or Local administrations, professional associations, etc.
On the other hand, the taxes levied before the sale of the electricity, such as taxes on companies, profits, wages, etc., which are obviously part of the production or distribution costs, are not calculated separately. They remain an integral part of the price excluding tax.
The results for each country are shown in national currencies at current prices, i.e. at face value.
For the purposes of international comparison, it was necessary to use a representative common monetary unit which would create a minimum of distortion in both space and time. Accordingly, the present study uses the purchasing power standard (PPS). The comparative tables are also shown in European currency units (ECU).
These units of value are explained in the following chapter.
4. TARIFF VOLTAGE
The voltage at which electricity is supplied to the consumer is an element which may affect the industrial price levels. The higher the voltage, the Lower the price. But in this case, the consumer has to bear the expense of the electricity transformer (the investment cost or the rental).
Where several supply voltages coexist for the same category of users it is the most representative (greatest number of users) which is considered.
The table below gives the tariff voltages according to which the prices for the industrial standard consumers have been calculated.
Voltage applied to industrial standard consumers
kV
Standard consumers
FR of Germany
- Süd Gebiet
- Hamburg, Hannover, Düsseldorf, Frankfurt - West Gebiet
Stuttgart, München
France
Italy
Netherlands
- GEB
- PEN
- PNEM
Belgium
Luxembourg
United Kingdom
Ireland
Denmark
Greece
Spain
Portugal
la *b
h
Xd
Xe
rf
l90,38
0,38
20
10
10
0,38
0,38
15
/
y
40-130
¿ 50
0,38
0,38
10
25
10
10
10/15
10/15
0,415
0,38
0,40
0,38
έ
11
65
11
10
C
ΊΟ
6,6
-> 1-36
38
10
20
36-7
> 1
¿L
60
22
2,5
III. UNITS OF VALUE
To permit comparisons between countries, prices expressed in national currencies need to be converted to a common unit. In this study two common units are used :
(i) the European currency unit (ECU);
(ii) the purchasing power standard (PPS).
1. THE EUROPEAN CURRENCY UNIT (ECU)
The ECU is a basket-type currency unit based on the market exchange rates of a certain amount of each of the Community currencies, weighted according to the gross national product and intra-Community trade of each Member State.
In 1984, this weighting was revised on the accession of Greece and wiLl remain in force until further notice.
The new composition of the ECU basket is as follows:
BFR 3.71 DKR 0.219 DM 0.719 DR 1.15 FF 1.31
IR£ 0.00871 LIT 140 LFR 0.14 HFL 0.256 UK£ 0.0878
The conversion rates for the ECU against the national currencies in January of each year are given in a tabLe in the Statistical Annex.
The definition of the ECU is such that it reflects fluctuations in exchange rates and is suitable for measuring the prices and values of international flows of goods and services. Data expressed in ECU therefore permit the comparison of prices in terms of money changed at a bank. Such currency conversion at the market exchange rates, however, has the disadvantage that it fluctuates in time under the influence of many factors which are independent of internal price movements :
(i) capital transfers;
(ii) political decisions;
(iii) regulations;
(iv) speculation;
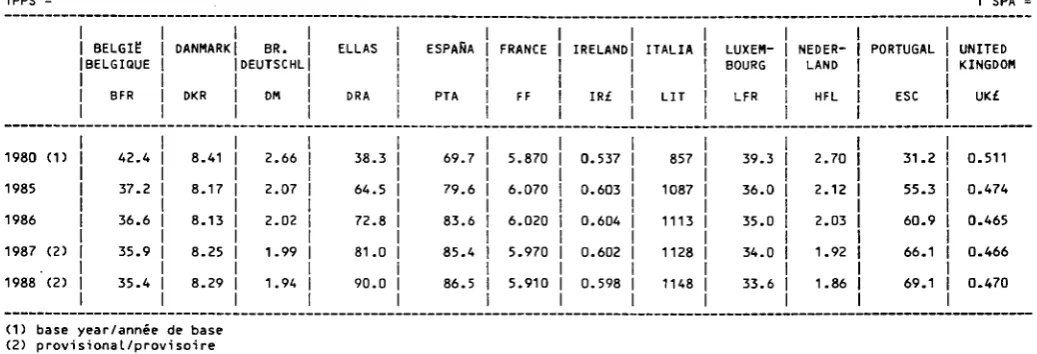
THE PURCHASING POWER STANDARD (PPS)
The PPS is a reference unit so calculated that its value in relation to the various national currencies is proportional to the purchasing power parities (PPP) between these currencies.
The purchasing power parities reflect the ratios between price levels in the different countries. The ratios between the prices expressed in national currencies are calculated for each of the products included in the uses of the GDP. If these ratios are suitably weighted, one obtains mean price ratios, the most general of which is the mean calculated for the GDP and known as the PPP at GDP level.
Such parities would be adequate to express all the data in real terms in the currency of any one of the countries considered. The method ensures that they are transitive and unaffected by the country chosen as a basis of reference. For Community calculations another reference unit known as the PPS is used. It is defined by applying the price ratios to the GDP of the various countries expressed in national currency and adjusting the parities so that the value of the GDP of the Community as a whole in 1975 is identical whether expressed in ECU or PPS. Only the proportion accounted for by each country will be different.
When prices are converted to PPS using the GDP parity, the result may be interpreted as follows :
If one gigajoule of energy costs 10 PPS in country A and 5 PPS in country B, this means that after allowance has been made for the differences between the general level of prices in the two countries, this gigajoule of energy is twice as expensive in country A as in country B.
This conclusion is independent of market exchange rates, which are influenced by factors other than the level of prices (movements of capital, speculation, interest rates, political decisions, etc.).
The conversion rates for the years covered by the study are given in a table in the annex. They were revised when the base year was changed.
3. PRICES IN CURRENT PPS AND CONSTANT PPS
The data can also be converted into base year PPS. If price series deflated by the GDP price index for each country are expressed in base year PPS, one obtains an indication of the change in prices for the product in question in relation to the general level of prices in the country. The data so calculated can also be compared between countries, giving the same results in relative terms as will be obtained using current prices and current PPP, since the Latter are extrapolated using the same indices, namely, the GDP price indices for each country and the average Community index.
Calculation using deflated PPS is thus carried out as foLLows :
1. The prices of the time series in current national currency are divided by one hundredth of the GDP price index of each of the years concerned;
2. This deflated series is converted to PPS using the conversion factor of the base year 1980.
4. PRICE SERIES
In the Light of the foregoeing, the results of this survey of Community prices are given in three forms :
1. a series of current prices in the national currency for each country;
2. a series in current ECU using the conversion rates for January of the year concerned;
IV. TAXES
In the Community, sales of electricity are subject to a general indirect tax, value added tax (turnover tax applicable to domestic consumption only, in Greece up to and including 1986).
Furthermore, specific taxes are levied in seven countries.
The prices inclusive of all taxes shown in this study comprise all the taxes mentioned above. In the tables in the annex, the amount of any specific taxes can be calculated from the difference between the tax-exclusive and VAT-exclusive price, while the difference between the total tax-inclusive price and VAT-exclusive price gives the amount of value-added tax (or turnover tax for Greece) in national currency per kWh.
1. GENERAL INDIRECT TAX
In general, VAT is calculated and applied to the price exluding VAT but including any specific taxes, these being part of the basis of assessment. France constitutes an exception since VAT is computed on the price excluding specific taxes.
The rates are as follows :
Value-added tax on electricity sales
(% of price before VAT)
January
FR of Germany France
Italy
(domestic) Italy
(non-domestic) Netherlands Belgium Luxembourg United Kingdom Ireland
Denmark Greece Spain Portugal
1980
13 17,6
6
14
18 16
5
0
0
20,25 8(1)
-~
1985
14 18,6
9
18
19 17
6
0
0
22 10(1) ■
-"
1986
14 18,6
9
18
19 17
6
0
0
22 10(1) 12
8
1987
14 18,6
9
18
20 17
6
0
0
22 18 12
8
1988
14 18,6
9
18
20 17
6
0
0
22 16 12
8
Since 1985, in Italy, the new VAT rates depend on the activity; 9 % for extractive and manufacturing industries, including printing and publishing, and 18 % for other non-domestic activities. In this study 18% has been applied to all industrial standard consumers (which changes the prices for the standard consumers Ic-Ig published in previous editions).
VAT is deductile for industrial and commercial consumers registered for the purposes of value added tax.
2. SPECIFIC TAXES
a) Denmark
A special government tax on electricity was introduced in April 1977, the rates of which were as follows :
1.1.83-31.12.85 15.50 ere/kWh 1.1.86-31.12.86 19.00 ére/kWh 1.1.87-... 32.50 ere/kWhd)
(1) reduced to 29.0 ére/kWh for consumption in excess of 4 000 kWh/year for homes with electric heating (D ) .
This tax is included in the assessment to VAT and is deductible in the same way as VAT.
b) Federal Republic of Germany
Since 1 January 1975 a compensatory tax (Ausgleichsabgabe) has been levied to promote the use of Community coal in power stations, the rates of which vary according to region :
(% of price before tax)
Hamburg Hannover Düsseldorf Western Zone Frankfurt/Main Stuttgart München
Southern Zone
Federal average
1980
5.1
4.3
5.3
5.3
4.1
4.0
4.0
4.0
4.5
1985
3.9
3.4
4.0
4.0
3.3
3.1
3.3
3.3
3.5
1986
3.6
3.2
3.7
3.7
3.1
2.9
3.1
3.1
3.3
1987
4.9
4.5
5.0
5.0
4.3
3.9
4.3
4.3
4.5
1988
8.1 .
7.5
7.9
7.9
6.9
6.4
7.0
7.0
c) Greece
From 1984 until 31.12.86 a stamp duty of 1.2 % which is taken into account in calculating turnover tax was applied to the tax exclusive selling price of electricity to domestic consumers only.
d) Spain
Several specific taxes were applied during the period 1980-1985. These taxes which were abolished on 31.12.85 may be summarised as follows :
Period Sector Special tax IGTE Provincial tax Municipal tax
PTA/kWh % % %
1/1985 Households 0.35 6 0.3 Industry 0.35 6 0.3
The three proportional taxes are calculated on the tax exclusive price and are not cumulative. The IGTE is a general transaction tax. The municipal tax is a charge for the area occupied by the aerial or underground lines within the urban conurbations. This tax is not shown separately from October 1984 onwards. Instead it is taken as a general cost and included in the tariffs, nevertheless the distributors continue payment of the tax to the communes. Only consumers within the urban territory were subject to this tax. A large number of medium and large industries outside this area were therefore exempt. On average the effective rate was only 0.8% for industry in general and 0.6% for industriy supplied in high voltage (^>1kV).
For simplicity in this study we have taken the full rate of the municipal tax (1.5%) for all domestic and small industrial/commercial consumers (I -I ) whilst the other industrial standard consumers CI .—I )
were considered to be outside the urban territory. 9
From 1 January 1986 the various taxes were replaced by value added tax.
e) France
The rates and basis for the assessment of municipal and departmental taxes on electricity supplies were modified by the law of 29 December 1984 though the change only came into effect in March 1985 and affected prices in our study in January 1986. The basis of assessment is now as follows :
Subscribed demand % of tax Standard kVA kW excl. price consumers
80 D -D I
30 I* Ie a
0 I* ?i
d g
Previously the taxes were applied to 80% of the tax exclusive price for low voltage supplies (standard consumers D -D ) .
a e
C
36
36-250
>-250
¿- 32.4
32.4-225
The maximum rate permitted by the law is 12% with however an exception for Paris. The following table summarises the rate of the municipal and departmental taxes during the period studied :
%
Locations
Lille Paris Marseilie Lyon Toulouse Strasbourg
f) Italy
Muni ci
1980/85
8
13.28
8
8
—pal tax
1986/88
8
13.28
8
8
™"Departmental tax
1980/85
1
-4
-2
4
1986/88
2
-4
4
4
4
Tot.
1980/85
9
13.212
8
10
4
al
1986/88
10
13.2
12 12 12
4
Electricity consumption is subject to a State taje (imposta erariale), the rates of which have been as follows since 1981 :
LIT/kWh
Region Domestic Non-domestic
200 OOOkWh/month 200 000 kWh/month
North and centre 1.10
South and islands 0.55 1.10 0.55 0.65 0.325
Certain types of consumption are exempt from this tax electro-chemical, electro-metallurgical, public lighting, railways.
Furthermore, at the end of 1982 local taxes were introduced as follows: (LIT/kWh)
Users
Municipalities Provinces
1985 1986/87 1988 1985 1986/87 1988
Domestic for the block > 7 5 kWh/month
12 13 15
N o n - d o m e s t i c
< 1 OOOkW 5.5 6.5 5.5 8.5
All these taxes are included in the basis of assessment to VAT.
g) Portugal
An inspection tax which is included in the basis of assessment to VAT is levied at the following rates :
Households Industry
6.8.76r- 22.4.82 2.50 esc/month 12.50 esc/month
II - CONDITIONS ET METHODES
1. CHAMP COUVERT
La présente étude vise à saisir Les prix réels de L'électricité, payés par Les consommateurs, dans Les pays membres de La Communauté économique européenne.
Les prix sont relevés au début de chaque année et découlent des tarifs, contrats, conditions et règles en vigueur à cet instant. Il s'agit de prix réels payés par Le consommateur d'éLectricité, ce qui correspond à
la facturation franco-consommateur y compris les ristournes éventuelles. Par consommateur on entend ici les abonnés qui achètent
l'électricité pour leur propre consommation, ce qui exclut les revendeurs. N'ont donc pas été relevés Les prix d'entrée dans La distribution d'électricité.
En ce qui concerne les consommateurs, L'étude vise l'ensemble de la clientele approvisionnée par la distribution publique en basse, moyenne et haute tension. Pour simplifier la présentation, les consommateurs sont répartis en deux groupes appelés usage domestique et usage industriel.
Sont toutefois exclus de l'enquête certains consommateurs industriels :
1) qui produisent eux-mêmes une partie de l'énergie dont ils ont besoin (autoproducteurs);
2) qui achètent L'électricité sous un régime de contrat particulier en raison de Leurs conditions exceptionnelles de demande en puissance et en consommation.
Ces exceptions visent surtout les grandes entreprises sidérurgiques et chimiques, la production d'aluminium et autres métaux par éLectrolyse,
les réseaux ferrés, l'écLairage public, etc.
Ces entreprises présentent Le plus souvent une consommation supérieure à 10 000 000 kWh par an. Elles sont peu nombreuses, mais consomment une part sensible de l'énergie électrique distribuée.
Plutôt que de présenter des moyennes de prix par pays, il a semblé préférable de noter les prix sur un certain nombre de places, c'est-â-dire de villes ou de réseaux de distribution, ceci dans le souci de s'approcher le plus possible de la situation réelle des consommateurs.
Les prix sont relevés sur Les places suivantes
- Belgique
- Danemark
- Allemagne (RF)
r
- Grèce
- Espagne
- France
- Irlande
- Italie
- Luxembourg (G-D)
- Pays-Bas
- PortugaL
- Royaume-Uni
Belgique (tarif national unifié);
Copenhague (KB), Zelande Septentrionale (NESA);
Hambourg, Hanovre, Düsseldorf, Francfort/Main, Stuttgart, Munich, Zone Ouest, Zone Sud;
Athènes (tarif national unifié).
Madrid (tarif national unifié);
Lille, Paris, Marseille, Lyon, Toulouse, Strasbourg;
DubLin;
Nord et Centre, Sud et îles;
Grand-Duché (CEGEDEL);
Rotterdam (GEB);
Hollande Septentrionale (PEN);
Brabant Septentrional (PNEM);
Lisbonne.
Londres, GLasgow, Leeds, Birmingham;
Certaines des places sélectionnées couvrent des régions plus ou moins vastes.
2. CONSOMMATEURS TYPES
L'enquête est basée sur le système des consommateurs-types, c'est-à-dire que les prix sont relevés pour certains niveaux de consommation d'électricité et sous certaines conditions de fourniture, qui ont été choisis en raison de leur représentativité de la population des consommateurs d'électricité. Ces consommations types restent fixes d'une année à l'autre et pour tous les pays, ce qui est une des conditions premières de comparabiLité des prix dans l'espace et dans le temps.
Deux familLes de consommateurs types sont distinguées
domestiques et industriels. usages
Consom. annuelle en kWh Puissance
Consom- souscrite
in-mateurs Totale (dont nuit) dicative en kW
types
Logement type
600
1 200
3 500
7 500
20 000
(1
(2
(15
—
-300)
500)
000)
£
3
4
6
->
3
4
9
9
9
50m 2 pièces+cuisine
2
70m 3 pieces+cuisine
90m 4 pièces+cuisine
2
100m 4 pieces+cuisine
2
120m 5 pieces+cuisine
A titre indicatif, ces consommateurs-types correspondent aux
équipements électroménagers suivants :
D : éclairage, radio, télévision, réfrigérateur, petit appareilLage
électrique (1);
l
bD .
c d
équipement D + machine à laver ou lave-vaisselle;
équipement D, avec machine à laver et Lave vaisselle +
chauffe-eau à accumulation;
D : équipement dit tout électrique avec chauffe-eau et chauffage
électrique fonctionnant par accumulation.
Sept consommateurs-types industriels (voir point 4 pour la tension
d'aLimentation) codifiés I à I sont retenus :
a g
Consommateurs Consommation annueLle Puissance maximale Modulation
types kWh appelée kW (2)
a
Jb
c
Ld
e
Jf
g
30 000
50 000
160 000
1 250 000
2 000 000
10 000 000
24 000 000
30
50
100
500
500
2 500
4 000
1 000 h
1 000 h
1 600 h
2 500 h
4 000 h
4 000 h
6 000 h
(2) Durée d'utilisation annuelle de la puissance maximale appelée
La puissance maximale appelée est la puissance maximale quart-horaire relevée dans une année et exprimée en kilowatt (kW).
Le prix de la fourniture est calculé pour cos^= 0,90.
La modulation annuelle détermine la régularité avec laquelle l'énergie électrique est prélevée sur le réseau par le consommateur au cours de l'année. Plus cette durée est élevée, plus la consommation a tendance à s'étaler régulièrement au cours des 8 760 heures de l'année. Elle indique le nombre d'heures durant lequel le consommateur pourrait atteindre son niveau de consommation annuelle, sous une puissance égale en permanence à la puissance maximale appelée.
Dans certains cas, pour l'application des tarifs, quelques précisions supplémentaires sont nécessaires :
- en cas de tarif basé sur la puissance appelée demi-horaire, La puissance maximaLe du consommateur-type est multipLiée par le coefficient 0,98;
- en cas de tarif basé sur une puissance mesurée en kVA, la correction est effectuée en divisant la puissance maximaLe appelée en kW du consommateur-type par Le coefficient cos~f = 0,90;
- au cas où la tarification est basée sur des relevés de puissance intégrés sur une période plus courte que L'année , le montant de la prime de puissance est corrigé par application des coefficients multiplicateurs suivants :
Tableau de correction de La puissance
Consommateurs-types : I I. I I . I 1, I
a b c d e f g
Modulation annuelle : 1 000h 1 600h 2 500h 4 000h 6 000h
Puissance maximale appelée mensuelle
Puissance maximale appelée bimestrielle
Puissance maximale appelée trimestrieLle
Moyenne des 3 puissances maximales appelées
men-suelles les plus élevées 0,94 0,95 0,96 0,98 0,99
Moyenne des 2 puissances maximales appelées
men-suelles les pLus élevées 0,96 0,97 0,98 0,99 0,995
Puissance maximale appelée
annuelle (déf. de base) 1 1 1 1 1
0,81
0,83
0,86
0,83
0,85
0,88
0,85
0,87
0,90
0,90
0,91
0,95
0,96
0,97
Un tableau harmonisé de la consommation réalisée pendant les heures creuses a été également dressé, afin de pouvoir calculer Les prix de manière uniforme en cas de tarifs différenciés en fonction des moments de La journée (prix plus bas pendant la nuit, par exemple).
TabLeau de la consommation en heures creuses
Consom- Modulation Consommation Consommation annuelle (en 1 000 kWh) mateurs annuelle annuelle facturée à des prix "heures creuses" types suivant la durée moyenne quotidienne
des heures creuses du tarif
1 000 kWh 7 h 8 h 9 h 10 h 11 h 12 h
a
:
b
c
J
d
e
If
g
i La
1 000
1 000
1 600
2 500
4 000
4 000
6 000
factura
30
50
160
1 250
2 000
0
0
11
197
438
0
0
13
225
500
0
0
16
262
580
0
0
19
300
660
0
0
22
338
740
0
0
25
375
820
10 000 2 190 2 500 2 900 3 300 3 700 4 100
24 000 7 140 8 160 9 120 10 080 11 040 12 000
la facturation des heures creuses s'étend à d'autres périodes, par exemple le dimanche toute La journée, on ne tiendra compte que de la moitié de ces heures creuses supplémentaires.
Lorsque des paramètres tarifaires changent en cours d'année, iL n'en est pas tenu compte. Autrement dit, il n'est effectué aucun calcul de pondération de prix sur une année.
3. DEFINITION DES NIVEAUX DE PRIX RELEVES
Tous Les prix sont exprimés par unité d'éLectricité vendue, soit par kilowattheure (kWh). Les résultats représentent les prix unitaires pratiqués au début de chaque année, compte tenu des modifications de tarif, de paramètre, d'indice, etc. intervenues à partir du 1er janvier. Dans les cas de tarifs ou contrats indexés à court terme
Les prix incluent la Location du compteur, La prime fixe et le terme proportionnel. Ils n'incluent pas les premiers frais de raccordement d'un usager.
En cas de possibiLité d'application de plusieurs tarifs, après élimination des tarifs inutilisés dans la pratique ou des tarifs qui ne correspondent qu'à un nombre marginal ou négligeable d'usagers, c'est
le tarif le plus avantageux pour le consommateur qui est pris en compte.
Lorsqu'il n'existe que des quasi-tarifs ou des contrats particuliers ou encore des prix librement négociés, on a relevé le niveau des prix correspondant à La valeur centrale représentative des conditions de fourniture retenues (prix Le plus fréquent). En cas de prix libres ou de contrats, les relevés portent respectivement sur Les factures payées pendant Le mois de janvier ou sur les prix découlant des contrats les plus fréquents, en vigueur pendant ce même mois.
Lorsqu'un même usager dispose d'un compteur doubLe (par exemple, tarif de jour et tarif de nuit), Le prix résulte de l'ensembLe de sa consommation.
Il a été tenu compte des formules tarifaires particulières et supplémentaires s'appliquant éventuellement à l'énergie électrique réactive.
Trois niveaux de prix sont présentés :
- prix hors taxe;
- prix hors taxe à La valeur ajoutée (TVA);
- prix de vente, toutes taxes comprises.
Le prix hors taxes résulte directement de l'application des tarifs ou des contrats.
Le prix hors TVA contient, le cas échéant, les autres taxes spécifiques; il est intéressant au cas où la TVA est déductible.
Le prix toutes taxes comprises correspond au montant déboursé par l'usager.
En revanche, les taxes prélevées en amont de la vente d'électricité, comme Les impôts sur Les sociétés, Les bénéfices, Les salaires, etc. qui font évidemment partie des coûts de production ou de distribution, ne sont pas isolées. ElLes restent englobées indistinctement dans le prix hors taxe.
Les résultats par pays sont exprimés en monnaie nationale courante. IL s'agit donc de valeurs nominales.
Pour La comparaison internationale, il a falLu recourir à une unité monétaire commune, qui soit représentative et qui provoque le minimum de distorsion dans L'espace et dans Le temps. Ainsi, la présente étude utilise le standard de pouvoir d'achat (SPA). On a aussi présenté des tableaux de comparaison internationale exprimés en unité de compte européenne (ECU). Ces unités de valeur sont exposées et expliquées dans
le chapitre suivant.
4. TENSION TARIFAIRE
La tension d'aLimentation sous laquelle l'électricité est fournie à l'uti Lisateur est un élément qui peut affecter le niveau de prix pour l'industrie. PLus la tension est éLevée, plus le prix de vente baisse. Mais dans ce cas, le transformateur électrique se trouve à la charge du
consommateur, avec les coûts d'investissement, de Location etc.
Dans La pratique. Les tensions d'alimentation varient selon les réseaux et les tarifications. En accord avec les définitions générales, c'est
La tension sous LaquelLe l'éLectricitë est réellement livrée à l'usager qui est prise en considération.
Lorsque plusieurs tensions d'aLimentation coexistent pour une même catégorie d'usagers, c'est la tension la plus courante (plus grand nombre d'usagers) qui est prise en considération.
Tension t a r i f a i r e
kV
Consommateurs
Γ
Allemagne (RF
- Zone Sud - Hamburg, Ha
Düsseldorf, - Zone Ouest,
Munich
France
Italie
Pays-Bas
- GEB
- PEN
- PN EM
Belgique
Luxembourg
Royaume-uni
IrLande
Danemark
Grèce
Espagne
Portugal
types :
)
novre, Francfort Stuttgart
*a *b
0,38
0,38
Xc *d
*e
li'
h
20
10
10
0,38
0,38
15
y
y
40-130
< 50
0,38
0,38
10
25
10
10
10/ 15
10/ 15
0,415
0,38
0,40
0,38
C 1
1
11
10
c
10
6,6
> 1-36
> 1
C 60
65
38
10
20
36-22
72,5
III. UNITES DE VALEUR
Pour permettre des comparaisons entre pays. Les prix exprimés en monnaies nationales doivent être convertis en unités communes. Dans
cette étude, deux unités sont utilisées :
- l'unité monétaire européenne (ECU) - le standard de pouvoir d'achat (SPA).
1. L'UNITE MONETAIRE EUROPEENNE (ECU)
L'ECU est une unité monétaire de type "panier" basée sur les taux de change du marché d'une certaine quantité de chacune des monnaies de la Communauté, seLon une pondération qui fait intervenir le produit national brut et le commerce intracommunautaire de chaque Etat-membre.
En 1984, cette pondération a été revue, à L'occasion de L'inclusion de la Grèce dans la CEE et reste valable jusqu'à nouvel avis.
La composition actuelle du panier de l'ECU se présente comme suit :
BFR 3,71 DKR 0.219 DM 0.719 DR 1.15 FF 1.31 IR£ 0.00871 LIT 140 LFR 0.14 HFL 0.256 UK£ 0.0878
Les facteurs de conversion entre ECU et monnaies nationales sont donnés pour janvier de chaque année, dans un tableau de l'annexe statistique.
De par sa définition, L'ECU reflète bien les fluctuations des taux de change et s'avère adapté à mesurer les prix et les valeurs des flux internationaux des biens et services. Des données exprimées en ECU se placent donc dans l'optique d'une comparaison des prix, après conversion des devises. Cependant, cette opération monétaire aux taux de change du marché présente L'inconvénient de fLuctuer dans le temps sous L'effet de nombreux facteurs indépendants des mouvements de prix intérieurs :
- tranferts de capitaux,
- décisions politiques,
- réglementations,
- spéculations,
- facteurs psychologiques,
Ainsi, une monnaie nationale peut-elle être sous ou surévaluée par rapport à son véritable pouvoir d'achat.
De plus, l'ECU change de définition lors de l'introduction d'une nouvelle monnaie, comme c'est le cas avec l'inclusion de la Grèce, et peut manquer de cohérence avec Les indices de prix du produit intérieur brut, d'où difficultés pour déflater.
Pour remédier à ces inconvénients, il faut calculer le pouvoir d'achat réel de chaque monnaie, ce qui conduit à La notion de standard de pouvoir d'achat.
2. LE STANDARD DE POUVOIR D'ACHAT (SPA)
Le SPA est une unité de référence calculée de manière à ce que les relations avec les différentes monnaies nationales soient propor-tionnelles aux parités de pouvoir d'achat (PPA) de ces monnaies.
Les PPA reflètent Les rapports entre Les niveaux de prix des différents pays. Pour chacun des produits entrant dans Les emplois du produit intérieur brut (PIB), les rapports entre les prix exprimés en monnaie nationale sont calculés. En pondérant de façon adéquate ces rapports, sont obtenues des moyennes de rapports de prix, dont la plus générale est la moyenne établie pour le PIB et appelée PPA du PIB.
De teLLes parités seraient suffisantes pour exprimer toutes les données en termes réeLs dans la monnaie de n'importe Lequel des pays considérés. La méthode garantit qu'elLes sont transitives et indépendantes du pays choisi comme référence. En fait, pour des calculs communautaires, on utilise un autre numéraire, appelé SPA. Ce dernier est défini en appliquant les rapports de prix au PIB en monnaie nationale des pays et en étalonnant les parités, de manière à ce que La valeur du PIB de La Communauté dans son ensemble, en 1975, soit identique, qu'il soit exprimé en ECU ou en SPA. SeuLe la répartition de celui-ci entre pays sera modifiée.
Lorsque les prix sont convertis en SPA, à l'aide de La parité du PIB, l'interprétation suivante peut être faite (comparaison exclusive pour le SPA):
Si un gigajoule d'énergie coûte 10 SPA dans le pays A et 5 SPA dans Le pays B, cela signifie que, abstraction faite du niveau général des prix des deux pays, ce gigajoule d'énergie est deux fois plus cher dans le pays A que dans Le pays B.
Ce jugement est indépendant des taux de change monétaire dont les valeurs sont influencées par des facteurs autres que le niveau des prix
(mouvements de capitaux, spéculation, taux d'intérêt, décisions publiques,etc.).
3. PRIX EN SPA "COURANTS" ET "CONSTANTS"
Les enquêtes de prix convenant à L'établissement des parités de pouvoir d'achat ne sont pas réalisées chaque année. La dernière date de 1980 et une autre est prévue en 1985. Toutefois, puisque les parités sont des rapports de prix, Leur valeur pour d'autres années peut être estimée en les extrapolant en fonction des variations relatives des indices de prix du PIB de chaque pays par rapport à la moyenne communautaire : ce sont les parités dites courantes.
Les données en SPA de l'année de base peuvent également être converties. Ainsi, sont exprimées en SPA de L'année de base des séries de prix défLatées par l'indice de prix du PIB de chaque pays, une
indication de l'évoLution des prix relatifs de ce produit par rapport au niveau général des prix du pays est obtenue. Les données calculées comme décrit ci-dessus peuvent également être comparées entre pays. Les résultats de cette comparaison seront, en termes relatifs, identiques à ceux obtenus en utilisant Les prix courants et les PPA courantes, ces dernières étant extrapolées à partir des mêmes indicateurs, à savoir
les indices des prix du PIB de chaque pays et L'indice moyen communautai re.
Ainsi, Le calcul en SPA deflate est opéré de la manière suivante :
1) les prix de la série chronologique en monnaies nationales courantes sont divisés par Le 1/100 de l'indice de prix du PIB de chacune des années considérées;
2) cette série déflatée est convertie en SPA avec Le facteur de conversion par rapport à l'année de base 1980.
4. SERIES DE PRIX
Sur base des descriptions précédentes, Les résultats de la présente enquête des prix dans la Communauté sont présentés sous trois formes:
1) séries de prix courants en monnaies nationales, pour chaque pays;
2) série en ECUS courants, utilisant Les taux de change de janvier de L'année concernée;
IV - FISCALITE
Dans La Communauté, les ventes d'électricité sont soumises à un impôt général indirect, la taxe à La valeur ajoutée (pour la Grèce, taxe sur le chiffre d'affaires applicable aux usages domestiques seulement, jusqu'à et y compris 1986).
En outre, dans sept pays, existent des taxes spécifiques sur L'électricité.
Les prix toutes taxes comprises, présentés dans cette étude, incluent toutes ces taxes. Dans Les tableaux de L'annexe, La différence entre prix hors TVA et prix hors taxes indique le montant absolu des taxes spécifiques éventuelles; tandis que la différence entre prix TTC et prix hors TVA donne le montant absolu de la taxe à la valeur ajoutée (taxe sur le chiffre d'affaires en Grèce), en monnaie nationale par kWh.
1. IMPOT GENERAL INDIRECT
En général, la TVA est calculée et appliquée sur Le prix hors TVA, mais y compris Les taxes spécifiques éventuelles, qui tombent dans l'assiette d'imposition. Par exception, en France, la TVA est calculée sur le prix excluant les taxes spécifiques.
Les taux sont les suivants :
Taxe à la valeur ajoutée (TVA) perçue sur Les ventes d'électricité
% du prix hors TVA
Janvier 1980 1985 1986 1987 1988
Belgique Danemark
Allemagne (RF) Grèce
Espagne France IrLande Ita Lie
(domestique) Italie
(non domestique) Luxembourg (G-D) Pays-Bas
Portugal Royaume-Uni
16
20,25
13
8(1)
-17,6
0
6
14
5
18
-0
17
22
14
10(1)
-18,6
0
9
18
6
19
-0
17
22
14
10(1)
12
18,6
0
9
18
6
19
8
0
17
22
14
18
12
18,6
0
9
18
6
20
8
0
17
22
14
16
12
18,6
0
9
18
6
20
8
0
Depuis 1985, en Italie, les nouveaux taux de TVA diffèrent selon l'activité des assujettis, soit 9 % pour les industries extractives et manufacturières, y compris imprimerie et édition, et 18 % pour Les autres activités non domestiques. Dans cette étude, Le taux de 18% est appliqué à tous les consommateurs-types industriels (ce qui change les prix pour Ic-Ig publiés dans Les éditions antérieures). La TVA est déductible pour les consommateurs industriels et commerciaux soumis au régime fiscal général.
2. TAXES SPECIFIQUES
a) Danemark
Une taxe gouvernementale a été introduite sur L'électricité en avril 1977, avec les taux suivants :
1.1.1983-31.12.85 15,50 Øre/kWh 1.1.1986-31.12.86 19,00 Øre/kWh 1.1.1987- 32.50 Øre/kWh(1)
(1) réduit à 29.0 Øre/kWh pour toute consommation excédant 4.000 kWh/an pour les foyers à chauffage électrique (D ) .
ELle fait partie de L'assiette de la TVA et est déductible au même titre que La TVA.
b) Allemagne (RF)
Depuis le 1er janvier 1975, une taxe compensatoire ("Ausgleichsabgabe") est perçue dans Le but d'aider l'emploi du charbon communautaire dans les centrales électriques. Ses taux diffèrent selon les régions et les périodes, comme iL suit :
(% du prix hors taxes)
Villes 1980 1981 1982 1983 1984 1985 1986 1987
Hambourg Hanovre Düsseldorf Zone Ouest Francfort/Main Stuttgart Munich Zone Sud
Moyenne fédérale
5,1
4,3
5,3
5,3
4,1
4,0
4,0
4,0
4,5
5,1
4,2
5,3
5,3
4,0
4,0
4,0
4,0
4,5
4,7
4,0
4,8
4,8
3,8
3,7
3,9
3,9
4,2
3,8
3,3
4,0
4,0
3,2
3,1
3,2
3,2
3,5
3,9
3,4
4,0
4,0
3,2
3,2
3,2
3,2
3,5
3,9
3,4
4,0
4,0
3,3
3,1
3,3
3,3
3,5
3,6
3,2
3,7
3,7
3,1
2,9
3,1
3,1
3,3
4,9
4,5
5,0
5,0
4,3
3,9
4,3
4,3
c) Grèce
De 1984 jusqu'au 31.12.86, un droit de timbre de 1,2% sur le prix hors taxes était perçu sur les ventes d'électricité à usage domestique seulement. Ce droit entrait dans l'assiette de calcuL de La taxe sur Le chiffre d'affaires.
d) Espagne
Plusieurs impôts ont été perçus pendant la période 1980-1985. Ces impôts, abolis le 31.12.1985, peuvent être schématisés ainsi :
Impôt spécial IGTE Taxe Taxe Période Secteur PTA/kWh % provinciale municipale
% %
1/1985 Domestique 0,35 6 0,3 Industrie 0,35 6 0,3
Les trois impôts proportionnels se calculent sur le prix hors taxe et ne se cumulent pas. L'IGTE est un impôt général sur les transactions. La taxe municipale est une redevance d'occupation de l'espace public urbain, aérien ou souterrain. Cette taxe n'est plus distincte depuis 1985. A partir de cette date, elLe est incluse dans Les coûts et donc dans les tarifs, bien que les entreprises distributrices continuent de verser une redevance aux communes. Ne sont sujets à cette taxe que Les usagers situés dans l'espace urbain. Un grand nombre de grosses et moyennes industries n'étaient pas sujettes à cette taxe étant situées hors de l'espace urbain; En moyenne, le taux effectif n'était que de 0,8% pour l'ensembLe de l'industrie et de 0,6% pour l'industrie alimentée en haute tension (>1kV).
e) France
Les taux et l'assiette des taxes municipales et départementales sur Les ventes d'électricité ont été modifiés par la loi du 29 décembre 1984, avec prise d'effet en mars 1985 et incidence sur Les prix en janvier 1986 dans notre étude. L'assiette est maintenant La suivante :
Puissance souscrite % du prix
Consommateurs-kVA kW hors taxe type
80 D à D I
30 I? I e a
d g
Auparavant, les taxes s'appliquaient à 80% du prix hors taxe pour la seule fourniture eri basse tension (D à D ) .
< 36
36-250
> 2 5 0
^ 32,4
32,4-225
La loi autorise un taux maximal de 12%, mais la vilLe de Paris déroge à cette limite. Un tableau résume les taux de ces taxes pendant la période étudiée :
Villes
Lil Le Paris MarseiILe Lyon TouLouse Strasbourg
f) Italie
Taxe municipale
1980-85
8
13,2
8
8
8
™
1986-88
8
13,2
8
8
8
™
Taxe départementale
1980-85
1
-4
-2
4
1986-88
2
-4
4
4
4
Tot,
1980-85
9
13,2
12
8
10
4
al
1986-88
10
13,2
12
12
12
4
La consommation d'électricité est sujette à un impôt spécifique gouvernemental (imposta erariale), dont les taux sont depuis 1981 (1) :
(LIT/kWh)
Région Domestique Non-domestique
200 OOOkWh/mois 200 000 kWh/mois
Nord 8 Centre
Sud et îles 1,10 0,55 1,10 0,55 0,65 0,325
Certains usages en sont exempts : électrochimie, éLectrométallurgie, éclairage public, traction.
En outre, fin 1982, ont été instaurées des taxes locales que L'on peut résumer ainsi :
Lit/kWh
Usagers Communes
1985 1986/87 1988
Provinces
1985 1986/87 1988
Domestiques > 75 kWh/mois Non domestiques <^ 1 000 kW
12
5
13
5,5
15
6,5
5,5 8,5Toutes ces taxes entrent dans l'assiette de la TVA.
g) Portugal
Une taxe d'inspection, comprise dans l'assiette de la TVA, est perçue aux taux ci-après :
ESC/mois
domestique industrie
ELECTRICITY PRICES FOR HOUSEHOLDS PRIX DE L'ELECTRICITE POUR USAGES DOMESTIQUES
BELGIQUE BFR/KWH DANMARK ORE/KWH
JANUARY/JANVIER
D A
600 KMH
V.
D B
1 200 KMH
V.
D C
3 500 KWH
(1 300 KWH NIGHT/NUIT)
V.
D D
7 500 KWH
(2 500 KWH NIGHT/NUIT) /. 0 V. 0 Χ 0 ■/. ·/. 9 D E
20 000 KMH
(15 000 KWH NIGHT/NUIT) Y. V. 0 1980 1985 1986 1987 1988 88/87 80-88 1980 1985 1986 1987 1988 88/87 80-88 1980 1985 1986 1987 1988 68/87 80-88 1980 1985 1986 1987 1988 88/87 80-88 1980 1985 1986 1987 1988 88/87 80-88 BRUXELLES
PRICE INCL. ALL TAXES
PRIX TTC ι
6.36 8.86 9.17 8.72 8.83 1.3 4.2 4.96 7.64 7.80