Agglomeration in counter-current spray drying towers. Part B:
Interaction between multiple spraying levels
Víctor Francia
a,b,⁎
, Luis Martín
b, Andrew E. Bayly
b,1, Mark J.H. Simmons
a aSchool of Chemical Engineering, University of Birmingham, Birmingham,B15 2TT,United Kingdom bProcter & Gamble, R & D, Newcastle Innovation Centre, Newcastle upon Tyne, United Kingdom
a b s t r a c t
a r t i c l e i n f o
Article history:
Received 20 November 2015 Received in revised form 6 May 2016 Accepted 7 May 2016
Available online 11 May 2016
A new experimental method is developed here to investigate agglomeration in spray drying towers operating with multiple nozzles. It allows studying independently the contribution of each spray to the product and obtaining a valuable insight into the agglomeration processes. The paper studies a two level swirl counter-current dryer of detergent in a full-scale production system. It shows that operation with two nozzle levels increases the energy efficiency compared to the use of single sprays, but in turn promotes both agglomeration and elutriation of powder from the top of the dryer. The product size distribution becomes bi-modal and the composition and porosity of the product more heterogeneous due to the different thermal histories experienced by droplets from each spray. The method described here controls the air temperature and humidity nearby the nozzles to quantify the agglomerates resulting from particle contacts within each individual spray or from their interaction. Particle agglomeration is shown to be suppressed at the bottom of the dryer where the heat transfer rates are highest and promoted at the top spray, which originates a second coarse mode in the size distribution. Both levels do not operate independently; the powder elutriated upwards from the bottom nozzle is captured entirely by the top spray when it is centrally located. By isolating the independent impact of each nozzle in a dryer, the method provides powerful data to correlate the agglomeration behaviour with local process conditions, and so facilitate the development and validation of spray dryer models.
© 2016 The Authors. Published by Elsevier B.V. This is an open access article under the CC BY license (http://creativecommons.org/licenses/by/4.0/). Keywords:
Spray drying Agglomeration Aggregation Coalescence Spray Nozzle
1. Introduction
Spray dryers are used for obtaining particulate products from stocks of materials with high humidity. Slurries or pastes are atomised in a dry-ing chamber and the contact with hot air removes the moisture, turndry-ing the droplets into porous particles. Advantages versus other alternatives include the ability to encapsulate active components in a solid matrix and obtaining fast dissolving powders with an open structure, which is often desirable for consumer goods[1]. Thermally stable products are spray dried in counter-current devices to minimise the consumption of energy. In turn, the counterflow accumulates solids and causes more agglomeration, breakage and deposition than a co-current device. De-tergent powders can be manufactured in this way, making use of large towers and a strong swirl to increase the relative velocity between the phases[2,3]. The swirl makes the solids to concentrate close to the walls, where they form multi-layered deposits[4]that interact with air borne powder through the deposition of new material and re-en-trainment of clusters back into theflow. The deposition/resuspension
cycle then gives rise to substantial agglomeration and much of the res-idence time experienced by the solids[5].
The design and scale up of dryers still needs to rely on experience[6, 7]. Theflow dynamics depends on an intimate coupling between both phases[8–10]and it is often impossible to describe without a certain knowledge of how the solids come into contact, grow[11,12]or deposit [13–15]. The change in size affects drastically the way the particles dis-perse, particularly under swirl[16,17]; it determines the quality of the powder and the rate of heat and mass transfer[18–20]. Stochastic models[21]allow for tracking particle-particle impacts and introducing growth models[22–25]but significant research is needed to describe accurately the contact between semi-dried particles[26,27]. It is gener-ally accepted that comprehensive tools are still far from capturing ag-glomeration phenomena [28,29] particularly in counter-current towers where the number of contacts is exacerbated. Swirl towers have been adapted to different formulations over decades to maximise capacity and efficiency[3], both of which depend on the evolution of the particle size. In essence, the rate of a dryer is limited by the amount of slurry that can be dried without causing excessively coarse orfine particles. Agglomeration in a swirl tower becomes more important when one operates at a high throughput, for instance by placing more sprays in the chamber[30–32]. Ultimately, the powder becomes too
⁎ Corresponding author.
E-mail address:[email protected](V. Francia). 1
Present address:School Chemical and Process Engineering,University of Leeds,Leeds,UK.
http://dx.doi.org/10.1016/j.powtec.2016.05.010
0032-5910/© 2016 The Authors. Published by Elsevier B.V. This is an open access article under the CC BY license (http://creativecommons.org/licenses/by/4.0/). Contents lists available atScienceDirect
Powder Technology
coarse and wet, and the fraction that must be discarded turns too high. Research has focused on the airfluid dynamics[33,34], but experimen-tation in full scale (e.g.N100-1000 m3) is challenging and obtaining
re-liable data is complicated[35]. In manufacturing scales, residence times werefirst reported by Place[36], but more recently, stability analysis [37], velocity[38]andflow and turbulence data have become available [39]. As a consequence of a limited experimentation it has not been pos-sible to validate the few multi-phase models available[40–43], which rely on data in laboratories[33]or pilot scale facilities[34]and very rarely deal with the solid phase[44–46], particle contacts[47]or de-posits. Only few authors such as Fieg[48]or Zbiciński[40]study exper-imentally the properties of the solids and report temperatures or drying rates in pilot towers, but to our knowledge no full scale experimentation has linked agglomeration to process conditions, nozzle configuration or energy efficiency.
To this purpose, two independent investigations have been conduct-ed. Part A[49]compartmentalises a swirl drying tower and documents the use of single detergent nozzles; it clarifies the effects arising from the separation of solid and liquid phases during the atomization and correlates the location of a nozzle to the capacity and efficiency of the dryer. The nozzle position can be manipulated to minimise elutriation and control growth[49], but to maximise throughput, the largest units introduce various nozzles levels[30–32]. Further research is needed to understand the role of the nozzle configuration: where and how the ag-gregates are formed, how the drying efficiency changes from using one to various levels or whether the different sprays interact. This paper, Part B, answers some of these questions studying the transition from a single-level operation to the use of two spraying levels with central noz-zles. The experimental method developed here allows studying, for the
first time, the contribution of each nozzle to the product, quantifying the interaction between sprays and correlating the local conditions to ex-perimental growth patterns. This type of data enables the simplification of models to the areas in a dryer where agglomeration is most relevant.
2. Experimental conditions
2.1. Unit design and measurement
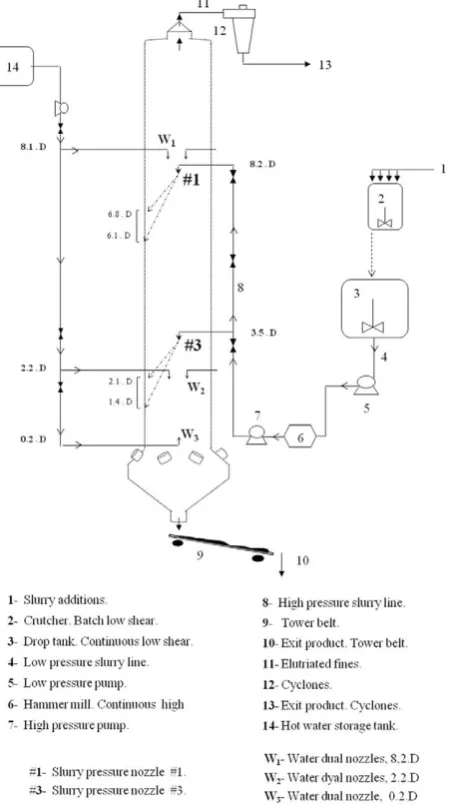
An industrial counter-current spray drying tower was used for the experiments, property of Procter & Gamble.Table 1includes the main design features andFig. 1depicts the location of slurry and water noz-zles.Fig. 2illustrates the operation of the air system, the location of tem-perature sensors and wall inspection areas.
The hot air is injected at the bottom of the dryer with certain angular momentum. A vortex is formed at the conical section[39]; it moves into the cylinder and exits through the top duct entering a series of cyclones, where the powder elutriated from the chamber is collected. The same formulation and atomization conditions used in Part A[49]and other works[5]are maintained. The paste is prepared by the addition of sur-factant(s), polymer(s) and inorganic salt(s) up to a solid content be-tween 30-60% It is pressurised and conducted into swirl pressure nozzles at positions #1 and #3 inFig. 1, where it is atomized. The same nozzle is used at all levels, aligned with the centreline of the cham-ber and facing down. Droplets sufficiently light are entrained in the up-wards airflow. Some exit the tower top and are collected at the cyclones and those sufficiently coarse migrate to the wall before reaching the top exit, concentrate, grow and start toflow down. Intermediate droplet sizes move outwards from the spray and approach the terminal velocity before reaching the wall above or below the nozzle. Increasing in size,
droplets become less affected by drag and maintain a high momentum when they impact the wall for thefirst time.Fig. 1depicts the area of the projection of the spray based in the spraying angle and the thickness of the hollow cone formed. Once the solids are dispersed near the wall, they free fall maintaining the swirling motion and collide multiple times with the structure of deposits formed.
The experiments described later make use of afine water mist to control the air temperature and humidity in the chamber. To this effect, three sets of air atomized spray nozzles, denoted W1, W2and W3(SU82,
Fluid Cap 251376; Air Cap 4691312) were installed at the positions shown inFig. 1, and fed from storage.
The air temperatureTAwas measured automatically at the inlet, tt-0,
and exhaust lines, tt-5 (Fig. 2). Any indication of the temperature inside the dryer is extremely valuable because it is rarely available and difficult to obtain[35]. In the chamber, measurements of air temperatureTA
were obtained at four levels (tt-1 to tt-4,Fig. 1) placing hollow metallic bars with seven rectangular openings that expose K-type naked ther-mocouples to theflow. In agreement to Huntington[3], deposition and condensation in the sensors could be prevented by placing the bars sufficiently far from the sprays and aligning the openings in the shadow of the swirl. Comparison of this method to the exhaust probe results in good agreement (± 2 °C) in the absence of particles and sim-ilar humidity ranges. The evolution of the heat losses QLoss was Table 1
Tower design parameters.
d/D H/D ⁎Ωi
0.29 10.58 5.1 - 5.4
[image:2.595.326.552.55.458.2]⁎ Ωiinitial swirl intensity[39]
monitored by measurement of the wall temperatureTwat the conical
section of the dryer.
Wall deposits grow during a long period until achieving a steady state thickness where deposition and re-entrainment become balanced [5]. The deposition rate in an initial stagerd,ois a good indication of the
rate of impacts to the wall and often used for model validation. In line with usual practice[50,51]the initial deposition rate was measured at several locations (Fig. 2) by collection of the deposits formed over clean surfaces during 10-15min.
The droplet size and the spray angle were obtained in an external spray rig with image analysis and laser diffraction methods (Malvern Spraytec Particle Sizer, RTSizer 5.6) respectively. The reader is referred to Part A[49]for a detailed study of atomization and the effects arising from the separation of solid and liquid phases at the nozzle.
The elutriation rate from the top of the chamber is measured by col-lection of the powder exiting the cyclones, later used for analysis. Ten 1kgsamples of the product exiting the bottom end were taken at the tower belt (Fig. 1) by collection of the full stream; they were sampled down and sieved using the Taylor series. The product temperature was measured by an infrared probe (OMEGA OS551). A larger bulk sam-ple between 15-20kgwas also gathered by blending consecutive sam-ples; it was sieved into 11 size fractions (Russell Finex Model 17240), sealed and used for analysis of composition, density and porosity.
Water and surfactant(s) contents,XwandXs, were obtained with Toledo
Mettler Moisture Balances and performing analytical titrations. Mor-phology was examined under Scanning Electron Microscopy, SEM, (Hitachi TM1000). Particle absolute,ρabs, and envelop,ρenv, densities
were analysed under He picometry (Micromeritics, AccuPyc II 1340 v1.02.01) and Hg Porosimetry (Micrometricts, Autopore IV) respectively.
2.2. Multi-level swirl dryers: Powder recirculation and drying kinetics
The capacity of a dryer is given by its ability to dry the maximum amount of product while controlling its properties, mainly size and den-sity. Swirl dryers can distribute several nozzles in two or three rings at different levels[31,32]to maximise rate while minimising the number of particle contacts. Neighbouring sprays in each level can interact when they are too close to each other[3]. That effect is left out of the scope of this work, which focuses only on the transition from one to two levels of a single central nozzle. In this scenario, the introduction of a second nozzle level increases the production rate and modifies the dispersion and thermal history of the solid phase because (a) the inlet air mass rate and temperature need to be increased to convey more heat and mass transfer, (b) particles are injected at different places and so they present different residence times and (c) each spray faces different local temperatures and velocities.
Fig. 3depicts the initial trajectory of different sized droplets and the subdivision of the dryer for a multi-level system. Part A[49]discusses in more detail this compartmentalization. One can focus in a concentrated ring close to the wall where the powder concentrates[4]. Regions above and below the spray(s) projection, denotedSR,TR,ERinFig. 3are
de-fined as the areas where the particle motion is function of particle size and density but history independent. The nozzle regionNRin turn is di-vided into (a) the spray (nozzle inertial region,NIRFig. 3), which is com-prised of high velocity droplets whose motion is dominated by the initial momentum and thus history, and (b) a concentrated area near the wall (nozzle terminal region,NTRFig. 3) where free falling powder is exposed to high velocity droplets coming from the spray. In the nozzle region, the deposits need to be considered as a separate region, where wall-borne clusters interact with air-borne powder by rates of deposi-tion and re-entrainment[5]. The transition from the single-level ar-rangement described in Part A to using two levels promotes agglomeration in three ways:
• Collision rate or frequency:The rate of particle and particle-wall impacts increases in response to a higher concentration of solids. As the throughput is doubled it is necessary to convey more heat transfer in the dryer, which can be done by increasing the inlet air temperature and/or mass rate,TA,INandMA. As a result, the chamber
develops higher air velocitiesUA, which hold up more solids and
elu-triate more powder.
• Probability of growth or collision efficiency:The injection of the
slurry at two different levels modifies the air temperature and velocity
field, and so the droplets sprayed at each nozzle face different thermal histories. The largest driving force to dry the powder is generated at the bottom, where the air temperatureTAand velocityUAare the
highest. The surface of a droplet sprayed here must experience faster drying rates; it dries and turns non-deformable more rapidly, which reduces the likelihood for contacts to result in agglomeration or de-posits. In contrast, droplets sprayed at the top face cooler and damper air and must remain prone to agglomerate or deposit for longer.
• Recirculation and contact mechanics:A characteristic feature of a
[image:3.595.47.275.58.457.2]multi-level configuration is theflow established between several noz-zle regions. In this case, the product can be thought to be comprised of three different populations, p-i and p-ii: particles that come from each of the sprays without having aggregated or having done so with Fig. 2.(a) Inspection areas on the walls and (b) description of the hot air system and
others from the same nozzle (e.g. coalescence near eachNIRinFig. 3), but also a different population p-iii: granules produced when the droplets/particles injected at different nozzles come into contact and aggregate. The contacts between particles from different sprays are likely to occur near each of the nozzle region(s),Fig. 4:
oTop (NR #1):Most of the powder elutriated from the bottom nozzle
approaches the top spray near the walls inNTR. Thefinest drops however do not migrate outwards and reach the top at central po-sitions withinNIR,Fig. 4a. Here they face collision with high velocity droplets coming from the spray, which acts as a scrubber.
o Bottom (NR #3):The product from the topflows down near the
wall and crosses the bottom sprayNIRinFig. 4b. These contacts occur in the concentrated annulus near the wall,NTRinFig. 3. Here the solids stagnate, collide one to another and interact with high velocity drops coming from the bottom spray. The contacts with the particles coming from the top nozzle are no different to the rest of the powder in this region; they simply include solids that have had a longer residence time, and probably have already ag-glomerated in the top region.
The aim of this paper is to quantify the growth occurring in each of the nozzle regions shown inFig. 3, and due to the recirculationflows depicted inFig. 4.
2.3. Experimental design
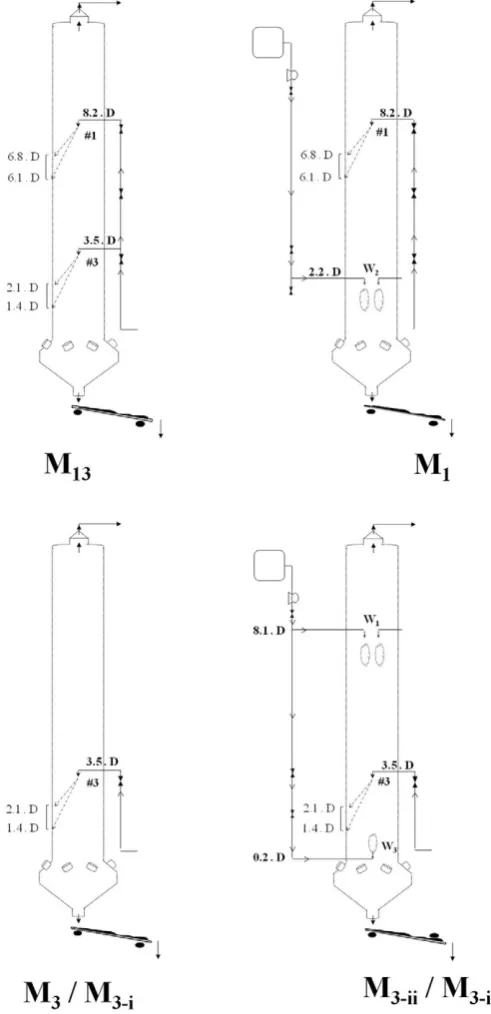
When one places a second nozzle level, it is complicated to distin-guish the effects due to increasing the rate and the concentration of solids in the chamber or due to modifying the thermal history of each spray. The series of experiments outlined inFig. 5does so by studying each spray independently keeping a constant atomization. Three stages are followed:
1. Reference.The case M13uses both slurry nozzles simultaneously and
is taken as the reference.
2.Isolation of each spray.The top slurry nozzle in studied
indepen-dently in M1; the bottom in M3, M3-iiand M3-iiiusing different levels
of added water to control the air temperature and humidity within the nozzle region.
3. Sensitivity. The effect of reducing the inlet air temperatureTA,INand
velocityUAare studied in M3-i.
During the start-up of M13the hot air is connected; the inlet air
tem-perature,TA,INand rate,MAare increased to heat up the dryer. When
at-omization starts,TA,INisfixed andMAincreased until the product exits
with the target water contentXwand the dryer wall reaches a constant
temperature. The inlet conditions in M13are used as the reference for
the remaining experiments.
The isolation experiments try to identify which part of the product in M13comes from nozzle #1, from nozzle #3, or as result of their
interac-tion (i.e. populainterac-tions p-i, p-ii and p-iii described earlier). In order to de-termine the agglomerates formed only by one of the sprays, one needs to operate this nozzle alone but under the same airflowfield observed when both are together in M13. In essence, the solids must face the same
air conditions in terms of temperatureTA, relative humidity,rHA, and
ve-locity,UAin order to originate the same rate and type of particle
con-tacts, particularly in the nozzle region. The changes introduced to replicate the airflowfield observed in M13during the isolation
experi-ments are explained below;Table 2summarizes the process conditions. Experiments M1, M3-iiand M3-iiireplicate the airflowfield in the
chamber using only one slurry nozzle but matching the overall evapora-tion rate to that of the reference M13. To do so they replace the water
re-moved from the slurry in M13with the equivalent amount provided by
[image:4.595.308.559.52.248.2]two sets of air/water dual nozzles (Fig. 5): Fig. 3.Compartmentalization of a swirl counter-current dryer with two levels with central
[image:4.595.42.292.53.409.2]nozzles. Nozzle regions,NR, comprised of terminalNTRand inertialNIRregions; terminal TRsedimentationSRand elutriationERregions and the cone regionCR.
• M1:During M13theflow to nozzle #3 is disconnected and the water
previously evaporated from that slurryflow is injected as afine mist by W2, placed at the centre and facing down (Fig. 5). As shown later
this allows retaining a comparable temperaturefield and heat transfer rateqin the top region. The product exiting the tower under these conditions represents what would have been generated by nozzle #1 in M13if nozzle #3 were absent.
• M3-ii, M3-iii:In a similar way, in these cases theflow to nozzle #1 is disconnected and W1and W3are connected to maintain the same
evaporation rate. Cases M3-iiand M3-iiiuse a different water injection
ratio between W1and W3(Table 2). Two considerations must be
made in respect to the use of water:
o Water dries faster than slurry, and thus the evaporation of droplets from W1and W3does not extend as far into the bottom of the dryer
when compared to the behaviour of slurry droplets in M13. As a
re-sult, the air is likely to reach a higher temperatureTAat the bottom and enhance drying. Indeed,Table 2and later sections show that the powder in M3-iiand M3-iiireaches a higher exit temperature
Tpand a lower water contentXw. This is not an issue to study
ag-glomeration because the contacts responsible occur above, i.e. in the cylinder.
o Re-wetting: there is a risk for the surface of particles to be re-wet by water drops and become stickier for a short period of time. Later
Section 3.3show that some deposits appear near the water sprays
despite the dual nozzles provide very fine drops (b100µm), which are expected to dry rapidly.
LaterSection 3.2shows that during M13the air temperatureTAvaries
from ~300 °C at the inlet to ~100 °C above nozzle #3. The same range of variation has also been controlled by modifying the inlet air conditions:
• M3uses the same inlet air mass rateMAbut reduces the inlet
temper-atureTA,INuntil theTAabove nozzle #3 reaches the value in the
refer-ence M13(~100 °C). Therefore, the same rate of heat is exchanged and
the product is dried to the same water contentXw, but in turn, the air
at the top of the chamber reaches higher temperatures and velocities.
• M3-ikeeps on reducingTA,INfurther until the exhaust conditions
match those in the reference M13. Of course, this reduces the overall
drying rate versus the one in M3and the product exits with a higher
water contentXw.
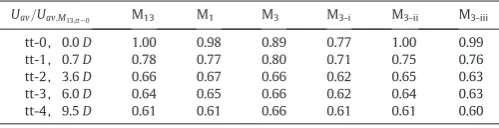
Table 3illustrates the effect of the different operating conditions in the air velocityUAin the chamber, by the estimation of the air superficial
velocityUavat different levels according to the changes in air tempera-ture given in laterSection 3.2. This enables the comparison of the ex-haust velocities for different cases and explain how the stronger drag causes more elutriation and presumably a higher particle concentra-tions at the bottom of the chamber.
3. Results and discussion
3.1. Capacity and efficiency
All cases with the exception of M3show comparable exhaust
condi-tions (Tables 2 and 3, level tt-4). However, the elutriation rateMEin
Table 2decreases when the nozzle is brought down from M1to M3-i
fromME¼8:0%of the full exit rate of powderMEPto ~ 6.8% in M3-i.
The trend is in agreement with the observation made in Part A: a lower nozzle position allows more time for the elutriated powder to mi-grate to the walls. The operation of a multi-level arrangement results more elutriation (ME¼6:8−8:0%vsME¼2:0−4:0%for single-level cases[49]) because the chamber operates at higher velocities and the air carries more solids upwards (in single-level operation conditions
[49]the air mass rate and temperature are lower:MA/MA,M13~ 0.67; TA;IN;M13−TA;IN30°C ). When water nozzles are used in M3-iiand
M3-iiithe elutriation falls further perhaps as a consequence of
interac-tion with the water drops.
When both slurry nozzles are operated together in M13, the
elutria-tionMErepresents only 3.1 % of the overall exit rate of powderMEPbut, remarkably, when both operate individually the summation of the elu-triation rates represents 7.4% (computed from the rate of each nozzle in M13and the elutriation in M1and M3-i,Table 2). This is a very relevant
fact: a quite substantial part of production ~ 4.3%flows up when both nozzles are operated independently in M1and M3-ibut it no longer
[image:5.595.300.546.203.711.2]exits from the top if they are operated together: instead it exits at the
bottom. The lack of elutriates in M13points to the agglomeration offine
powderflowing up from the bottom and somehow captured. The anal-ysis of the product size and composition given in later sections provides further evidence.
The capacity of the dryer is affected by the amount of product that must be discarded, which comprises of the powder elutriated and col-lected in the cyclones,ME, and the fraction of the product considered too coarse, denotedMR(e.g. computed here as the fractionxpN1800 µm).Table 2includes the capacity ratioC, computed as the usable frac-tion of the overall exit rate of powder,MEP.Cdecreases from a maximum of 0.92 in the single-level operation conditions[49]to 0.85 in a multi-level operation because more elutriates are generated and coarser gran-ules start to form. However, the multi-level system still results in a more economical arrangement because it doubles the throughput and in-creases the thermalηtand the heat transferηhefficiencies from 0.74
and 0.51 in a single-level operation[49]to 0.79 and 0.57 in M13thanks
to the higherΔTdriven between the phases and presumably, a longer residence time.
3.2. Control of the drying environment in the chamber
In order to compare the reference production M13with those from
the top or bottom levels it is important to ensure that the slurry nozzles #1 and #3 face a similar temperaturefield and drying rate.Fig. 6reports
the air temperatureTAin the cylindrical chamber giving time-averaged measurements at different radial and axial positions.Fig. 7includes a cross-sectional averageTA,avand measurements at the plenum tt-p
and the conical section t-c.
The multi-level production M13and that from the top nozzle in M1
show comparable temperatures below the top slurry spray (see tt-3 in Fig. 6): a constant small bias, ~ 10 °C and an increase at the centre of the cylinder. In the studies of the bottom slurry nozzle, the level tt-1 shows the temperature immediately below the projection the spray. The experiments using added water, M3-iiand M3-iii, render slightly
lower temperatures than the reference M13. In the outer region,TA
varies from 175-180 °C to 150-175 °C and 160-180 °C from having both slurry nozzles in M13or only the bottom in M3-iiand M3-iii(Fig.
6). In these cases, the central region of highTAis lost above the level
of the nozzle (tt-2,Fig. 6), but it reappears at the top of the chamber (tt-3, tt-4Fig. 6). The reason for this behaviour remains unclear but it may be related to the recirculation areas caused by the swirl, at least in isothermalflows[52]. The experiments M3and M3-iuse also the
bot-tom slurry spray but neither slurry nor water are injected at the top of the dryer. Above the nozzle (tt-2 to tt-4,Figs. 6 and 7) the entire cham-ber achieves a homogeneousTA, which indicates that the elutriated
powder dries rapidly near the nozzle. Below the bottom spray (tt-1) M3and the multi-nozzle production in M13face a very similar air
tem-perature:TAdecreases towards the wall in an indication of a higher
con-centration of solids and it shows a span from 185-200 ºC (M3Fig. 6). In
turn, when the inlet air temperatureTA,INdecreases further in the case
M3-ithe temperature faced by the solids in the nozzle region (tt-1)
re-duces significantly to 135-145 °C (M3-iFig. 6).
A distributed energy balance is reported inTables 4 and 5(Sections I to V are defined inFig. 7a). The evaporation rateMevaand the heat loss rateQLoss, are obtained from overall mass and energy balances. Eq.(1)
defines the overall heat exchange rateQExfrom the variation of sensible
enthalpy in the dry air,ΔHDA,sn, and the product,ΔHP,sn(i.e. inlet slurry
[image:6.595.49.560.83.346.2]and outlet powder, elutriation and vapour) utilised in evaporation Table 2
Operation conditions. Both spraying levels in M13and the isolation of each by: a ramp in the inlet air temperatureTA,IN(M3, M3-i) and the use of water sprays to replicate the evaporation rate in (M1, M3-ii, M3-iii).
Scenario M13 M1 M3 M3-i M3-ii M3-iii
Air phase
MA=MA;M13 1.00 ± 0.06 0.98 ± 0.06 1.00 ± 0.02 1.00 ± 0.02 1.00 ± 0.02 0.99 ± 0.04
tt−0;TA;IN ð°CÞ 300.1 ± 7.0 300.7 ± 5.2 238.9 ± 2.6 169.8 ± 1.8 299.8 ± 3.2 301.5 ± 1.2 tt−5; TA;EX ð°CÞ 78.2 ± 2.2 82.8 ± 1.6 104.8 ± 2.2 82.5 ± 1.0 75.5 ± 4.2 68.7 ± 10.4 1Meva=Meva;M
13 1.00 1.00 0.52 0.46 1.06 1.09
rHA,EX (%) 29 24 6 12 35 48
Particulate phase
Nozzle(s) #1 , # 3 #1 ,W2 #3 #3 #1 , W1, W3 #1 , W1, W3
MS;#1=MS;M13 0.47 ± 0.02 0.52 ± 0.02 − − − −
MS;#3=MS;M 13 0.53 ± 0.02 − 0.52 ± 0.02 0.52 ± 0.02 0.53 ± 0.02 0.56 ± 0.02
2
MW1=ΔMW;eq − − − − 0.36 0.58
2
MW2=ΔMW;eq − 0.98 − − − −
2MW
3=ΔMW;eq − − − − 0.72 0.58
Xw−Xw,M13 (%) 0.00 -0.5 -0.6 4.2 -2.0 -1.6
TP−TS ð°CÞ 2.8 ± 3.7 1.6 ± 5.2 46.7 ± 8.1 −14.1 ± 2.2 47.0 ± 14.1 57.6 ± 9.4
ME ð%MEPÞ 3.1 8.0 9.0 6.8 5.2 1.8
MR ð%MEPÞ 11.6 16.1 12.7 16.4 4.6 11.3
C 0.853 0.759 0.782 0.768 0.901 0.871
Overall Energy Balance
QLoss (% QEx) 30.2 ± 1.8 28.0 ± 0.5 36.4 ± 0.9 19.6 ± 1.9 24.9 ± 0.7 24.5 ± 0.7
ΔHP,sn (% QEx) 2.2 ± 2.7 2.2 ± 0.7 6.0 ± 1.5 −1.9 ± 2.3 4.1 ± 1.0 5.0 ± 1.0
3η
t 0.79 ± 0.02 0.78 ± 0.01 0.61 ± 0.01 0.58 ± 0.01 0.80 ± 0.01 0.83 ± 0.02
4η
h 0.57 ± 0.02 0.57 ± 0.01 0.41 ± 0.01 0.47 ± 0.02 0.62 ± 0.01 0.64 ± 0.01
A: air, IN: inlet, EX: exhaust. S: slurry, P: powder at the exit belt, E: powder at the cyclones, R: powder removed as oversized, EP: full rate of spray dried powder. 1
Evaporation rate Meva;2
Equivalent water rateΔMw,eqestimated from the variation in rate from single-nozzle operation to M13.3
Thermal efficiencyηt=(TA,IN- TA,EX)/(TA,IN- Tamb);4
[image:6.595.43.293.680.744.2]Heat transfer efficiencyηh=QS/HA,INwhere HA,INdenotes inlet air enthalpy with ambient as reference.
Table 3
Axial variation of the air superficial velocityUav, estimated asUav¼MDA=ρDAπR2. Uav=Uav;M13;tt−0 M13 M1 M3 M3-i M3-ii M3-iii
QLat, and lossesQLoss
QEx¼QLatþQLoss¼ ΔHDA;snþΔHP;sn ð1Þ
In order to study how the solids dry at different sections, it is useful to group the terms differently in Eq.(2)and compute the heat trans-ferred to the solid phase in each sectioni, denotedQS,i.
QS;i¼ ΔHDA;sn;iþQLoss;i
¼QLat;iþΔHP;sn;i ð2Þ
Eq.(2)requires the estimation of the axial distribution of the heat losses. Losses are largely localised to Section I inFig. 7i.e.QLoss,IN
0.84-0.91QLoss, and particularly, to the distributor i.e.ΔTbetween tt-0 and
tt-p, which accounts for 0.72-0.87QLoss. The remaining losses reduce
drastically in cylinder and can be distributed according to the contact area and the air-wall temperature differences, in the assumption that all sections show comparable heat transfer resistances. In general, the energy required to heat the solids is low i.e.ΔHP,snb0.10QEx, and so
the heat transfer rate calculated fromQSserves as a valid indication of
the drying rate experienced by the solids.
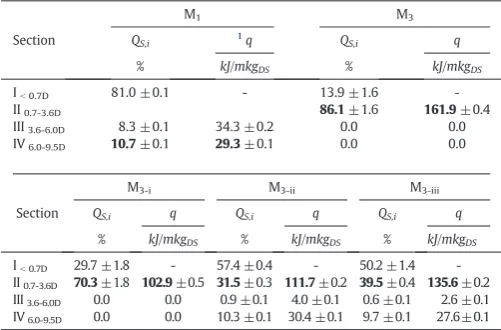
Table 4summarizes the axial distribution ofQSin the reference case,
M13. Notably, a high proportion of heat is transferred below the cylinder
N44% and a low proportion between the nozzles, Section III. There is also
a large difference between both nozzle regions, Sections II and IV. Clear-ly, most of the particles sprayed at the top are in fact dried below the bottom nozzle in Sections I and II. To illustrate the differences,Tables 4 and 5include a specific heat transfer rateq (kJpermof tower and kgof dry slurry). Normalization by the either total rate and that of each nozzle facilitates comparison of each nozzle region inTable 5.qis indicative of the efficiency of the heat transfer and the particle concen-tration. For instance, in M13much lower values are obtained at the top
nozzle region i.e. 16.5 kJ/mkgDSthan the bottom nozzle region i.e.
70.6kJ/mkgDSbecause each faces a different drying environment. The
bottom nozzle is located in areas of higher temperature, which pro-motes the heat transfer, and faces a stronger upwards air velocity, which must concentrates the powder further and increase the overall heat transfer ratequnless the concentration rises sufficiently to affect the temperature or cause a local mass transfer limitation.
All experiments aim at reproducing similar concentration and parti-cle properties in the nozzle regions, and thus they must present a com-parableTAfield inFig. 7, and comparable heat transfer rates inTables 4
and 5. The production from the top spray alone in M1renders an overall
similar heat transfer rate to M13, yet a slightly lower values at the top
nozzle region, Section IV, comparingq= 35.1 inTable 4(1) to 29.3kJ/ mkgDSinTable 5.
The production from the bottom spray in M3renders higher rates i.e.
161.9 kJ/m kgDS) in the nozzle region, Section II, than the reference M13
inTable 4(3) i.e. 97.0 - 133.3kJ/mkgDS. The case M3-ireplicates this
range better using a lower inlet air temperature and yields a value of q= 102.9kJ/mkgDSin Section II. The use of the water sprays in the
cases M3-iiand M3-iiirenders a comparable distribution of heat exchange
in the entire chamber (Table 4(13) andTable 5). Accordingly, during M13one expects the properties of the particles near the bottom nozzle,
Section II, to be somewhere between those in the isolation experiments M3and M3-iwithout added water and M3-iiand M3-iiiwith added water.
Thefirst two experiments cover the range of heat transfer rateq ob-served in the reference, and the last two render very similar heat trans-fer rates but include the potential to re-wet the surface of the particles. Remarkably, all of these experiments result in a very similar product size distribution (Section 3.4) which ensures that any potential rewetting or the minor changes in the drying rate did not have signifi -cant effects in the agglomeration.
3.3. Wall deposits
During the reference M13, deposits appear primarily near the
projec-tion of the top nozzle (6.9D) and barely no deposits appear either be-tween the sprays or at the bottom inspection area in 2.2D.Table 6 andFig. 8report the initial net wall deposition rate,rd,o, and the
exam-ination of the walls. The deposits above the nozzle respond to the accu-mulation offines. In M1thefine droplets are directly elutriated and no
deposits develop at the top (9.2D), but in M13 heavier deposits appear
despite the elutriation rate is lower (Table 2). Interestingly, more wet
fine particles seem to be reaching the walls at the top and accumulate without being elutriated. It is perhaps the consequence of recirculation or wearing of deposits given the large amount of powder impacting the walls. This could explain by the deposits do in fact diminish at the top nozzle region (6.9-8.1D) when comparing M13to the use of the top
noz-zle alone in M1.
In the projection area from nozzle #1 (6.9D) the amount of deposits increase significantly from single-level operation conditions (Part A, 0.91g/sm2[49]) to the use of the same nozzle under multi-level
[image:7.595.33.286.48.442.2]opera-tion condiopera-tions (1.87g/sm2). This is a neat evidence of the effects of a two-level arrangement: the stronger counter airflow (a) increases con-centration and the rate of wall impacts and (b) shifts the trajectory of coarse wet droplets upwards so that they cover more the inspection area (compare the projection between 6.1-6.8DinFig. 1to the inspec-tion area centred around 6.9DinFig. 2).
No deposits appear near the projection from nozzle #1 (2.2D) in ei-ther M13or the operation of the bottom nozzle in M3because the solids
are sufficiently dry when they reach the wall. However, when the dry-ing rate diminishes in M3-ithe deposits start to appear, seeFig. 8b.
Sim-ilarly, when added water is used in M3-iiand M3-iii, some deposits start
to appear near both of the water sprays (seeFig. 8b) in an indication that the surface of the particles or the walls has been re-wet. The prod-uct in these cases may contain some aggregates that would not have been produced if water drops were“invisible”to the solids, but as de-tailed later it poses no restrictions to the conclusions of the work
[image:8.595.49.557.50.330.2]3.4. Contribution of each spray and their interaction to the agglomeration
Table 7summarizes the statistics of all the product size distributions. Fig. 9a evidence the increase in particle size from the initial droplet pop-ulation to the product in the multi-level production, M13. The conditions
associated to a single-level operation render product size distributions with a single mode between 300-425µm[49]. The use of both sprays
in M13 generates a clearly different bi-modal shape. The product
shows the same primary mode but also a coarser second mode between 850-1180µm.Fig. 9b compares the reference production M13with the
contribution expected from the operation of each of the nozzles inde-pendently given by M1and M3. All cases show the same primary
mode inFig. 9b. The bottom spray M3originates a single narrow mode
but the top spray, M1is clearly responsible of generating coarser powder
and the bi-modal distribution. It is evident that agglomeration is strongly inhibited at the bottom of the dryer and promoted at the top. The reduc-tion of the heat transfer rate observed at the top of the chamber,Table 4, makes the surface of particles in the top region wetter (either air-borne or wall-borne) and thus more prone to stick to the wall and deposit (Fig. 8) or to each other and agglomerate (Fig. 9b)
[image:8.595.310.561.570.735.2]Fig. 7.Energy balance. Definition of sections I to IV (a) and axial temperature distribution. Cross sectional averageTA,avin tt-1 to tt-4; time average in the plenum tt-p and the exhaust tt-5, and punctual measurement in the cone t-c. (b) multi-nozzle operation M13from nozzle #1 (z= 8.2D) and #3 (z= 3.5D) and isolation experiments in (c) M1: nozzle #1 and water nozzle W2(d) M3and M3-i: nozzle #3 modifyingTA,INand (e) comparison of M3to the use of water in M3-iiand M3-iii: nozzle #3 and water nozzles W1and W3.
Table 4
Distributed energy balance for the multi-level production, M13and specific heat transfer rates. Bold denotes the spray region(s).
Multi-level system, M13
Section QS,i 1q kJ/mkgDS
% #13 #1 #3
Ib0.7D 44.7 ±1.4
-II0.7-3.6D 40.1 ±1.1 70.6±0.6 150.3 ±6.5 3133.3±5.8 III3.6-6.0D 4.0 ±0.1 8.8 ±0.3 18.8 ±1.0 16.7 ±0.9 IV6.0-9.5D 11.2 ±0.3 16.5±0.2 235.1±1.5 31.1 ±1.4
1
Specific heat transfer rate q = QS,i/(Δz MS(1-Xw,S)); #13, #1 or#3 denote the normal-ization to MS,MS,#1or MS,#3.
2 Most the heat exchanged corresponds to the product from nozzle#1. 3
Part of the heat is transferred to product from nozzle#1. The minimum rate transferred to the product from nozzle#3may be estimated as97.0±4.5kJ/mkgDSfor a direct comparison to M3,M3-iinTable 5.
Table 5
Distributed energy balance and specific heat transfer rates for the isolation experiments. Bold denotes the spray region.
M1 M3
Section QS,i 1
q QS,i q
% kJ/mkgDS % kJ/mkgDS
Ib0.7D 81.0 ±0.1 - 13.9 ±1.6
-II0.7-3.6D 86.1±1.6 161.9±0.4
III3.6-6.0D 8.3 ±0.1 34.3 ±0.2 0.0 0.0
IV6.0-9.5D 10.7±0.1 29.3±0.1 0.0 0.0
M3-i M3-ii M3-iii
Section QS,i q QS,i q QS,i q
% kJ/mkgDS % kJ/mkgDS % kJ/mkgDS Ib0.7D 29.7 ±1.8 - 57.4 ±0.4 - 50.2 ±1.4 -II0.7-3.6D 70.3±1.8 102.9±0.5 31.5±0.3 111.7±0.2 39.5±0.4 135.6±0.2 III3.6-6.0D 0.0 0.0 0.9 ±0.1 4.0 ±0.1 0.6 ±0.1 2.6 ±0.1 IV6.0-9.5D 0.0 0.0 10.3 ±0.1 30.4 ±0.1 9.7 ±0.1 27.6±0.1
1
[image:8.595.40.288.615.693.2]The comparison between the single-level and the multi-level opera-tion condiopera-tions in Parts A and B illustrates the trade off between increas-ing rate and promotincreas-ing particle growth.Fig. 10compares the product obtained from nozzles #1 or #3 under multi-level operation conditions denoted M1and M3(Table 2), to single-level operation conditions,
de-noted S1and S3(Part A[49],MA/MA,M13~ 0.67,TA;IN;M13−TA;IN30 °C). The production from the top nozzle #1 becomes coarser when the air mass rate increases in the multi-level case (the shoulder in S1develops
into a second mode in M1,Fig. 10a). The evolution can be explained by
the increase in particle concentration, which multiplies the particle-par-ticle and parparticle-par-ticle-wall contacts in the top nozzle terminal regionNTR where the air temperature is low and the particles remain sticky. In con-trast, the production from the bottom nozzle #3 becomesfiner under the multi-level operation conditions (the mode in S3narrows in M3and the
plateau disappear,Fig. 10b) because the higher temperature and heat transfer rate at the bottom suppress the agglomeration.
A relevant question for model development is whether the nozzles are in fact independent, i.e. whether one can assume that agglomeration
occurs only between droplets/particles from the same nozzle. If the con-tacts due to the recirculation between both nozzles regions inFig. 4 were negligible, the simple summation of independent productions given by M1+ M3would result in M13(or at least the maximum
amount of agglomerates expected from independent sprays since M1
and M3overpredict particle growth). A simple mass balance
demon-strates that this is not the case. The second size mode generated in M1
[image:9.595.298.554.85.171.2]accounts as a maximum for 63% of the productxpN600µm.
Fig. 11shows the comparison of (a) the product expected from noz-zle #3 if there were no interactions between the sprays i.e. M13- M1and
Table 6
Summary of the initial deposition rates,rd,o, at the inspection areas depicted inFigs. 2 and 8. Bold denotes the slurry projection areas.
Level M13 M1 M3 M3-i M3-ii M3-iii
z / D g/sm2
10.4 - - 0.01 0.01 -
-9.2 0.50 0.03 0 0 0 0
8.1 0.24 0.54 0 0.01 0 0
6.9 1.37 1.87 0 0.01 1.66 0.52
5.7 0 0 0 0 0 0
4.5 0 0 0 0 0 0
3.4 0 0 0 0.01 0 0
2.2 0.06 - 0 0.68 1.49 2.25
[image:9.595.33.284.86.185.2]Fig. 8.Examination of the walls. (a) Deposits due to the projection of nozzle #1 and the elutriation (b) Deposits due to the projection of nozzle #3 and water dual nozzles W1 and W3. Areas with not significant deposits are excluded.
Table 7
Statistics of the product size distribution. Confidence intervals provide one standard deviation.
Case xp,10,µm xp,25,µm xp,50,µm xp,75,µm xp,90,µm M13 163±3 246±6 423±22 1093±61 2023±186
[image:9.595.324.526.313.707.2]M1 220±11 220±11 696±76 696±76 3115±1059 M3 175±13 237±13 334±25 697±392 3482±2167 M3-i 186 ±10 261 ±15 388 ±30 1070 ±500 4447 ±1100 M3-ii 175 ±9 236 ±13 335 ±29 601 ±123 2424 ±1001 M3-iii 179 ±16 240 ±17 335 ±28 529 ±96 1471 ±833 S1[49] 173±4 261±7 413±15 824±64 1724±286 S3[49] 195±12 282±20 456±98 2224±1575 xp,83= 4760µm
[image:9.595.44.273.399.709.2](b) all the experiments that isolate nozzle #3. The powder obtained from nozzle #3 always exhibits the same size distribution: a single mode aligned with the primary mode in M13. The cases M3and M3-i
gen-erate narrower modes and afinal plateau, instead of long tails observed when water is added in M3-iiand M3-iii. When the drying rate is reduced
the plateau rises in M3-iand a wider tail appears in M3-iii, but in every
case the shape and statistics remain very similar (Table 7). However, the product expected from independent nozzles (i.e. M13- M1) shows
a clearly different distribution inFig. 11, which demonstrates thatM13
does not comprises of the simple summation of powder generated by top and bottom nozzles M1+ M3. Consequently, the sprays cannot be
considered independent. The discrepancy in the mass balance (i.e. sec-ond mode of M13- M1inFig. 11) is indicative of the population of
ag-glomerates resulting from particle contacts between different sprays. It can be estimated as the difference between the mass ratexpN600 µmin M13and M1+ M3. One can state that as a minimum, 6-11% of
the the secondary mode in M13was generated by inter-level contacts.
The inter-level agglomeration then represents 3.7% of the overall exit rate of powder, which is consistent with the reduction of the elutriation inTable 2(quantified as 4.3%,Section 3.1). In essence, the size distribu-tions confirm that the powder elutriated from the bottom nozzle has been entirely captured and forms part of coarser granules in M13. The
capture offines and a second size mode are not found particularly
detrimental to the product quality in M13, for the mass median size
xp,50remains similar to a single-level operation (S1or S3inTable 7
[49]). Furthermore,xp,10andxp,90are even reduced versus S3because
the second mode prevents the formation of afinal plateau inFig. 9b. Finally, the distribution of deposits at the walls is known to affect significantly theflow structure in a swirl dryer. To evaluate their effect M13and M1werefirst obtained under initially clean walls and then
rep-licated under heavily built up walls[52,53]. The product size and oper-ation conditions result indistinguishable in all cases, which suggest that the effect of deposits in theflow remains comparable once the wall reaches an equilibrium thickness.
3.5. Product heterogeneity
3.5.1. Redistribution of active components(s) Xs
Separation of liquids and solids during the atomization makes small droplets particularly rich in liquids such as surfactant(s) and those com-parable to the size of the solids suspended in the slurry (50 µmbxpb200µm) particularly poor[49]. In this way, the surfactant(s)
[image:10.595.67.267.51.449.2]distribute preferentially into the smallest particles and the elutriated powder. Larger granules start to include more of the suspended solids and so present a minimum content in surfactant(s), and only when they grow sufficiently they render homogeneous values [49]. The
[image:10.595.334.534.304.701.2]Fig. 10.Evolution of the product size distribution associated to nozzles #1 and #3 from single-level operation conditions S1and S3[49]to multi-level operation conditions M1 and M3(a) nozzle #1, S1[49]and M1and (b) nozzle #3, S3[49]and M3.
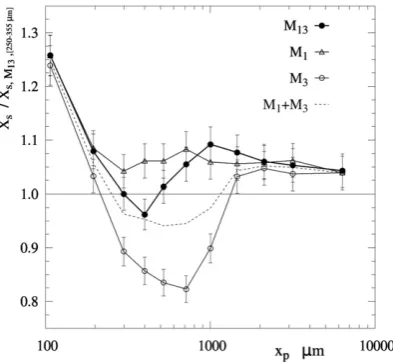
experiments discussed here show the same general trend. The content of surfactant(s) in the productXsis given inFig. 12comparing each
size class to the primary size mode in the reference M13. The effects of
the phase separation are neater in the production of the bottom nozzle M3. Since agglomeration is less significant, the smallest droplets have
not yet been redistributed in coarse granules andXsvaries drastically
with size. The primary size mode shows less surfactant(s) inFig. 12 be-cause it contains fewer agglomerates and more primary particles rich in solids than the coarsest granules. The elutriated powder and the parti-clesxpb450µmrender the same surfactant(s) level that in a
single-level operation S3[49]but in M3the low surfactant(s) affects coarser
particles (up to 1180µm) in an indication of the high rate offines that is being elutriated (M3Table 2) and escaping agglomeration (see the
size reduction inFig. 10b). In a similar way to the single-level case S3
[49]there is a neat correlation between the creation of the coarsest granules that form a plateau in the size distribution, M3Fig. 10b, and
the homogenization ofXsinFig. 12. In contrast, the powder from the
top spray M1, has undergone more agglomeration and the surfactant(s)
have been redistributed across granules of different sizes.
When both levels are used together in M13, the two mode sizes
ex-hibit clearly different surfactant(s) contents. Thefirst mode is mainly formed at the bottom and contains less agglomerates and the second comprises of the coarser granules formed at the top. The primary and secondary mode sizes in M13show respectively ~ 3% lower and ~ 6%
higher surfactant(s) levels than the same size ranges in single-level op-eration S1[49].Fig. 12includes a comparison between M13and the
ex-pectation from the summation of independent sprays (M1+ M3). M13
shows more surfactant(s) in agglomerates between 450-600µmin evi-dence of the effect of capturing thefine elutriated powder when the sprays operate together. Note in Fig. 12 that every size class in M1+M3contains less surfactant(s) than M13; this is a consequence of
the higher rate of surfactant(s) that exits with the elutriated powder in M1and M3. A mass balance, including measurements ofXsfor the
elu-triated powder and conservative estimates of uncertainty reveals that the exit rate of surfactant(s) in the three cases in fact differs: inM1the
exit rate of surfactant(s) is ~2% higher than in M13and up to ~7% higher
than in M3where it is below the expectation from the formula. It is a
surprising and important result for it demonstrates that there must be a source of accumulation of surfactant(s) in the chamber that depends on the operation conditions (i.e. varies from M1, M3and M13). It can
only be related to the walls. It would appear that the composition of the deposits can change in time and tend to accumulate surfactant(s). Perhaps the fragility of wall clusters is a function ofXsand those rich
in solids are more easily broken off and re-suspended. It is thefirst ob-servation of such behaviour, which could have important effects in pro-duction and explain quality issues; this phenomenon must be studied further by long term monitoring of the deposits.
[image:11.595.61.258.51.232.2]3.5.2. Particle drying history and water content, Xw
Fig. 13includes the variation ofXwwith the product particle size for
M13and all the isolation experiments. All cases show the general
distri-bution as function of size characteristic of single-level operation[49]: a minimum within 350-450µmperhaps associated to a lower initial water content, and a rise for fractions below and above, which is linked to breakage of large granules and the less efficient drying of coarse particles. It is particularly interesting that the bulk exit water contentXwis not very sensitive to thefinal size of the powder. Xwreduces significantly from M3-ito M3, M3-iiiand M3-iiinFig. 13b
but the size remains fairly constant inFig. 11and Table 7. This trend is inconsistent with the relation between size and drying rate when the powder settles; it may be consequence of the large propor-tion of drying that occurs when particles are resident at the wall, 10-100 times longer than in airborne condition[5]. Furthermore, the lack of any change in the agglomeration pattern (Fig. 11) for such a variation in water content (Fig. 13b) suggests that the growth pro-cess itself is relatively insensitive to the nature of air-borne particles (e.g.Xw) and perhaps more influenced by those at the surface of
de-posits (e.g. interaction of the near wall region with the walls,NTR
andWRinFig. 3). The relative importance of air-borne and
[image:11.595.326.526.51.415.2]wall-Fig. 12.Product surfactant(s) contentXsas function of particle size for the multi-nozzle operation M13, and the isolation of nozzles #1 and #3, M1and M3. The expectation in M13if both sprays were independent is given by M1+M3. Data normalised to value of the mode size class in M13.
borne contacts in agglomeration and drying efficiency shall be subject of future work[54].
[image:12.595.266.550.43.574.2]3.5.3. Product structure
Fig. 14a shows examples of elutriated powder andfine particles to il-lustrate the droplet morphology (Part A[49]includes a more detailed analysis). Droplets are heterogeneous; they contain small spherical drops (e.g.Figs. 14-1 to14-3), spherical particles of varying composition (e.g.Figs. 14-4,14-5,14-8) and ligaments (e.g.Fig. 14-9). Drying leads to hollow structures (Figs. 14-6,14-10) and in vast majority a porous matrix (e.g.Figs. 14-11,14-12). The presence of fragments (e.g.Figs.
[image:12.595.56.355.49.570.2]14-6,14-7) points to certain breakage of the coarsest granules. In gener-al terms, a multi-level arrangement generates similar agglomerate structures and no specific morphological differences to a single nozzle [49].Fig. 15includes some examples and micrographs at a higher mag-nification to illustrate the solid bridges established between the parti-cles and the sources of porosity due to drying or agglomeration. The agglomerates show high aspect ratios and complex shapes because they include heterogeneous primary particles and elongated shapes (e.g.Fig. 15-1). The single-level operation[49]revealed characteristic pore size ranges due to dehydration of the primary particles (micron-range) or the formation of cavities. In a multi-nozzle system the same Fig. 14.Morphology of primary particles. Micrographs show elutriated powder (1 to 5),
fine fractions in the product (6 to 8) and examples of coiled ligaments (9), hollow structures (10) and common porous matrix (11, 12).
sources of porosity appear in a different size range.Fig. 15-7 to15-10 showcase the presence of cracks, bursts and micron pores at the surface of particles and the cavities formed in the agglomerates
Table 8reports the particle porosityεand density as a function of size for M13. Despite the different thermal history, the particle structure
is found, in general terms, comparable to a single-level operation[49]. The intra-particle porosityεshows higher values but it remains in all cases below the volume of water displaced, and no evidence suggest that droplet inflation is a dominant way to generate porosity.Fig. 16 re-ports the pore size distributions for selected size fractions including the entire Hg intrusion cycle (intra and inter particle voids). The product from the multi-level operation is compared to a single-level operation case with a nozzle from position #2 (intermediate between #1 and #3 [49]). When two levels are used the product coming from the top faces higher temperatures only at the bottom of the chamber when it
has already dried to some extent. In turn, the slurry sprayed at the bot-tom spray faces high temperature when it is still very wet and thus it is more prone to boil and generate vapour bursts. The mixture of powder from both sprays renders a more heterogeneous set of structures and makes the pore size due to drying to vary in M13. The coarsest granules
reveal the two sources of porosity. In the multi-level operation, M13, the
cavities formed by agglomeration narrow to 30-40µm, but the micron pores move to larger sizes, perhaps as the result of bursts and faster dry-ing rates,Fig. 16a. The same trend is observed in thefinest and coarsest particles,Fig. 16a and16b. It becomes more obscure as the agglomerates grow inFig. 16c due to the increasing size of pores/cavities that turn comparable to inter-particle voids. In contrast, the porosity of the elutri-ated powder is comparable in both cases inFig. 16d, because at the top of the dryer thefine powder experiences a similar thermal history.
4. Conclusions
The experimental method outlined here allows studying tion in each spray of a large drying chamber. The effects of agglomera-tion in the efficiency and capacity of a multi-level swirl counter-current dryer have been investigated in an example of detergent pro-duction. The contribution of each nozzle to the product was studied in-dependently and correlated to the process conditions and the local heat transfer rates. The following general conclusions can be summarised:
a) Efficiency, capacity and agglomeration:A multi-level arrangement
of detergent nozzles in a swirl drying tower renders slightly lower capacity ratios than single-level operation due to the elutriation of more powder and increased agglomeration. However it allows for operation at higher throughput and improves substantially the heat transfer efficiency from 0.50 to 0.59. The different thermal his-tory of each spray has a great impact in the formation of deposits and agglomerates. In contrast to the use of single nozzles, a two-level ar-rangement generates agglomerates in two size modes. The study of each nozzle independently reveals that the coarse size mode is mainly generated by the top spray. Agglomeration appears relat-ed to the specific heat transfer rate in each nozzle region: growth is heavily inhibited at the bottom and promoted at the top spray leading to creation of a coarse second size mode. In addition, the analysis of the elutriation and the powder composition dem-onstrates that both sprays interact by the capture of the full stream offine powder elutriated from the bottom into the top nozzle region. In the case treated, inter-nozzle interactions ac-count forN6-11% of agglomeratesN600 µm. The product mor-phology is similar for single and multiple nozzle operations but the different thermal history of the sprays makes the product in a multi-level system to present a different porosity profile and larger variations in composition due to the separation of solids and liquids phases at the nozzle.
b) Wall dynamics:The lack of correlation between product size and
water content suggests that the contacts between particles and/ or droplets occurring at the outer layers of deposits may play a substantial role in the formation of agglomerates. Furthermore, analysis of the product composition indicates that the composi-tion of the deposits varies in time as a funccomposi-tion of operating con-ditions. A relation between the resuspension dynamics and the cluster composition may be transferable to other systems and play a significant role in the long term behaviour of spray dryers, which must be studied in future works.
c) Unit compartmentalization.The experimental methodology
de-scribed here provides a powerful tool to facilitate the develop-ment and validation of models based in the subdivision of spray dryers into nozzle regions. It enables the quantification of particle growth in different areas of a chamber and studying how Table 8
Particle density and porosity for M13. Bulk, envelope and skeletal densities,ρbulk,ρenvand ρske. The porosity between the envelope to the absolute or skeletal density thresholds are denotedεabsorεske.
Multi-level operation, M13
Size classμm kg/m3
%
ρbulk ρenv ρske ρabs εske εabs
Elutriated 0.74 1.051
1.90 1.78 45 41
b152 0.65 0.942
1.90 1.79 51 48
152- 250 a a a 1.87 a a
250- 355 a a a 1.93 a a
355- 450 0.58 1.153
1.91 1.96 40 41
450- 600 0.57 1.154
1.86 1.94 38 41
600-850 0.62 1.004
1.85 1.92 46 48
850-1180 0.76 1.144
1.81 1.91 37 40
1180-1800 0.94 1.074
1.78 1.91 40 44
1800-2500 0.86 1.074 1.65 1.91 35 44
2500-4000 1.19 1.274
2.07 1.93 38 34
N4000 1.07 1.104
1.67 1.91 35 43
Average - N1.08 N1.83 1.90 34-41 37-43
1,2,3,4 refer respectively to a pore threshold size to inter-particle cavities of 30.2, 33.0, 60.5, 90.7μm.
a
[image:13.595.34.283.468.703.2]Samples showing reproducibility issues.
agglomeration responds to changes in process conditions. This type of data provide engineers across industries with a new way to correlate experimental growth kinetics in a specific case to the heat transfer rate near a spray, and in this way advance in de-veloping compartmental models.
Nomenclature
A Cross-sectional area of the cylindrical chamber, m2
C Capacity ratio C¼1−ððMEþMRÞ=MEPÞ, -D Diameter of the cylindrical chamber, m
d Diameter of the top exit in the dryer, tubular guard, m erH Equilibrium relative humidity of the product, %
f Normalised size frequency in a probability density function, log (μm)-1
HA Enthalpy rate for the air phase taking ambient temperature as
a reference, J s-1
ΔHDA,sn Enthalpy variation between outlet and inlet air in a dry basis, J
s-1
ΔHP,sn Enthalpy variation between the outlet product, elutriates and
water vapour and the inlet slurry, J s-1
M Mass rate, kg s-1
MS Mass rate of slurry sprayed at the nozzle, kg s-1
ME Mass rate of powder elutriated and collected at the cyclones,
kg s-1
MR Mass rate of oversized product exiting the tower belt, kg s-1 MP Mass rate of the product exiting the tower belt, kg s-1 MEP Overall rate of powder exiting the spray drying chamber, kg s-1 n Particle number concentration, m-3
Oh2 Ohnesorge number,Oh2
¼2μp2=xpρpσ p
QLat Latent enthalpy rate of the water vapour generated in the
chamber, J s-1
QLoss Rate of heat lost to the environment, J s-1 QEx Rate of heat exchanged in the dryer, J s-1 QS Rate of heat transferred to the solid phase, J s-1
q Specific heat transfer rate per m and kg of dry slurry, kJ m-1kg DS -1
rd,o Initial net wall deposition rate, g m-2min-1 rH Relative humidity of the air, %
T Time averaged temperature, °C
TA;av Cross-sectional average air temperature, TA;av¼∫ρAUA;zTAdA=∫ ρAUA;zdA where normalised radial profiles forUA;zare taken
from isothermal cases[46]. U Time averaged velocity, m s-1
Uav Bulk or superficial air velocity. m s-1
Up,sd Particle sedimentation or free falling velocity, m s-1 Up,t Particle terminal velocity, m s-1
Up,w Particle velocity for thefirst wall impact, m s-1 xp Particle/droplet diameter,μm
xpore Pore/cavity/void diameter,μm
Xs Product surfactant(s) mass fraction in a dry basis Xw Product water mass fraction.
z Axial position in the cylindrical chamber measured from the level of the air inlets, m
Greek letters and symbols
εabs Intra-particle porosity in pores below the envelope threshold, % εske Intra-particle porosity, in pores between the envelope and
skeletal thresholds, %
ηt Thermal efficiency in the dryer,ηt= (TA,IN- TA,EX)/(TA,IN- Tamb) ηh Heat transfer efficiency in the dryer,ηh=QS/ HA,IN.
μ Slurry viscosity, kg s-1m-1
ρ Density, kg m-3
ρabs Absolute particle density including no pores in He
pycnometry, kg m-3
ρbulk Bulk particle density including cavities up toxporeb353µmin
Hg porosimetry, kg m-3
ρenv Envelope particle density including pores smaller than the
threshold inTable 8in Hg porosimetry, kg m-3
ρske Skeletal particle density, including pores up toxporeb6nmin
Hg porosimetry, kg m-3
Ωi Design swirl intensity, non-dimensionalflux of angular
mo-mentum[46].
Subscripts, superscripts and caps
A For the air phase.
DA For dry air.
DS For dry slurry.
E For the elutriated fraction of powder.
EP For the full powder exiting the tower (elutriated fraction + product from the bottom)
EX Exhaust conditions.
IN Inlet conditions.
P For the particle/product exiting the tower from the bottom end.
R For the fraction of oversized powder removed from that exiting from the tower belt.
S For surfactant(s) / for the solid phase / for the slurry mix at the nozzle.
Acknowledgments
VF was supported by an Engineering Doctorate Studentship spon-sored by the Engineering and Physical Sciences Research Council (EPSRC) and Procter & Gamble in the Industrial Doctoral Centre in Formulation Engineering, School of Chemical Engineering, Universi-ty of Birmingham. The authors also want to thank Mr Adrien Serout for his valuable advice in experimentation and the studies of atomization.
References
[1] K. Masters, Scale-up of spray dryers, Dry. Technol. 12 (1-2) (1995) 235–257.
[2] P.W. Appel, Modern methods of detergent manufacture, J. Surfactant Deterg. 3 (2000) 3.
[3] D.H. Huntington, The influence of the spray drying process on product properties, Dry. Technol. 22 (6) (2004) 1261–1287.
[4] G. Hassall, Wall build up in spray driers(EngD thesis) Chemical Engineering, Univer-sity of Birmingham, Birmingham, United Kingdom, 2011.
[5] V. Francia, L. Martin, A.E. Bayly, M.J.H. Simmons, The role of wall deposition and re-entrainment in swirl dryers, AIChE J 61 (6) (2015) 1804–1821.
[6] D.E. Oakley, Scale-up of spray dryers with the air of computationalfluid dynamics, Dry. Technol. 12 (1-2) (1994) 217–233.
[7] I.C. Kemp, D.E. Oakley, Modeling of particulate drying in theory and practice, Dry. Technol. 20 (9) (2002) 1699–1750.
[8] L. Huang, A.S. Mujumdar, Simulation of an industrial spray dryer and prediction of off-design performance, Dry. Technol. 25 (4) (2007) 703–714.
[9] M. Mezhericher, A. Levy, I. Borde, Modeling of droplet drying in spray chambers using 2D and 3D computationalfluid dynamics, Dry. Technol. 27 (3) (2009) 359–370.
[10] Y. Jin, X.D. Chen, Numerical study of the drying process of different sized particles in an industrial-scale spray dryer, Dry. Technol. 27 (3) (2009) 371–381.
[11] T.A. Langrish, D.F. Fletcher, Prospects for the Modelling and Design of Spray Dryers in the 21st Century, Dry. Technol. 21 (2) (2003) 197–215.
[12] D.F. Fletcher, B. Guo, D.J.E. Harvie, J.J. Nijdam, J. Williams, What is important in the simulation of spray dryer performance and how do current CFD models perform? Appl. Math. Model. 30 (2006) 1281–1292.
[13] M.W. Woo, W.R.W. Daud, A.S. Mujumdar, S.M. Tasirin, M.Z.M. Talib, Role of rheolog-ical characteristics in amorphous food particle-wall collisions in spray drying, Pow-der Technol. 198 (2010) 252–257.
[14]Y. Jin, X.D. Chen, A Fundamental Model of Particle Deposition Incorporated in CFD Simulations of an In5dustrial Milk Spray Dryer Drying Technology, 28 (8) (2010) 960–971.
[15]S. Keshani, W.R.W. Daud, M.M. Nourouzi, F. Namvar, G. Mostafa, Spray drying: An overview on wall deposition, process and modelling, J. Food Eng. 146 (2015) 152–162.
[16] J. Paiva, R. Romualdo Salcedo, P. Araujo, Impact of particle agglomeration in cy-clones, Chem. Eng. J. 162 (2010) 861–876.
[17] A. Alves, J. Paiva, R. Romualdo Salcedo, Cyclone optimization including particle clus-tering, Powder Technol. 272 (2015) 14–22.
[19]S. Palzer, Influence of material properties on the agglomeration of water-soluble amorphous particles, Powder Technol. 189 (2009) 318–326.
[20] S. Palzer, C. Dubois, A. Gianfrancesco, Generation of Product Structures During dry-ing of food products, Dry. Technol. 30 (1) (2012) 97–105.
[21] M. Sommerfeld, Validation of a stochastic Lagrangian modeling approach for inter-particle collisions in homogeneous isotropic turbulence, Int. J. Multiphase Flow 27 (2001) 1829–1858.
[22] R.E.M. Verdurmen, P. Menn, J. Ritzert, S. Blei, G.C.S. Nhumaio, T.S. Sørensen, M. Gunsing, J. Straatsma, M. Verschueren, M. Sibeijn, G. Schulte, U. Fritsching, K. Bauckhage, C. Tropea, M. Sommerfeld, A.P. Watkins, A.J. Yule, H. Schønfeldt, Simula-tion of agglomeraSimula-tion in spray drying installaSimula-tions: The EDECAD project, Dry. Technol. 22 (6) (2004) 1403–1461.
[23] B. Guo, D.F. Fletcher, T.A. Langrish, Simulation of the agglomeration in a spray using Lagrangian particle tracking, Appl. Math. Model. 28 (2004) 273–290.
[24]M. Mezhericher, A. Levy, I. Borde, Probabilistic hard-sphere model of binary parti-cle–particle interactions in multiphaseflow of spray dryers, Int. J. Multiphase Flow 43 (2012) 22–38.
[25] L. Malafronte, L. Ahrné, F. Innings, A. Jongsma, A. Rasmuson, Prediction of regions of coalescence and agglomeration along a spray dryer-Application to skim milk pow-der, Chem. Eng. Res. Des. 104 (2015) 703–712.
[26] C. Focke, M. Kuschel, M. Sommerfeld, D. Bothe, Collision between high and low vis-cosity droplets: Direct Numerical Simulations and experiments, Int. J. Multiphase Flow 56 (2013) 81–92.
[27] M. Kuschel, M. Sommerfeld, Investigation of droplet collisions for solutions with dif-ferent solids content, Exp. Fluids 54 (2013) 1440.
[28]T.A. Langrish, Multi-scale mathematical modelling of spray dryers, J. Food Eng. 93 (2009) 218–228.
[29] S. Palzer, Agglomeration of pharmaceutical, detergent, chemical and food powders. Similarities and differences of materials and processes, Powder Technol. 206 (2011) 2–17.
[30]J.R. Paris, P.N. Ross, S.P. Dastur, R.L. Morris, Modeling of the Air Flow Pattern in a Counter current Spray-Drying Tower, Ind. Eng. Chem. Process. Des. Dev. 10 (2) (1971) 157–164.
[31] Davis, R.P.; Haines, M.S. and Sagel, J.A. 1971. Multilevel Spray-Drying Apparatus. US Patent 3629951. December 28 1971, The Procter & Gamble Company. Cincinnati, Ohio.
[32] Chamberlain, H.R. Production of detergent compositions by spray drying. US Patent 4963226. August 1st 1990. The Procter & Gamble Company. Cincinnati, Ohio. [33] S. Sharma, Spray dryer simulation and airflow pattern studies(Ph.D thesis) The
Uni-versity of Aston, Birmingham, United Kingdom, 1990.
[34] A.E. Bayly, P. Jukes, M. Groombridge, C. McNally, Airflow Patterns in a Counter-Cur-rent Spray Drying Tower - Simulation and Measurement, International drying sym-posium, Sao Paulo, Part B, 22-25 2004, pp. 775–781.
[35] I. Zbiciński, L. Xuanyou, Conditions for Accurate CFD Modeling of Spray-Drying, Dry. Technol. 24 (9) (2006) 119–1114.
[36]G. Place, K. Ridgway, P.V. Danckwerts, Investigation of air-flow in a spray-drier by tracer and model techniques, Trans. IChemE 37 (1959) 269–276.
[37] V. Moshkin, A.V. Desyatov, N.P. Kakurkin, Hydrodynamic stability of the two-phase nonisothermalflow in a countercurrent spray dryer, Theor. Found. Chem. Eng. 41 (6) (2007) 816–821.
[38] P. Wawrzyniak, M. Podyma, I. Zbicinski, Z. Bartczak, J. Rabaeva, Modeling of airflow in an industrial counter-current spray drying tower, Dry. Technol. 30 (2012) 217–224.
[39]V. Francia, L. Martin, A.E. Bayly, M.J.H. Simmons, An experimental investigation of the swirlingflow in a tall-form counter-current spray dryer, Exp. Thermal Fluid Sci. 65 (2015) 52–64.
[40]I. Zbicinski, Development and experimental verification of momentum, heat and mass transfer model in spray drying, Chem. Eng. J. 58 (1995) 123–133.
[41]D.J.E. Harvie, T.A.G. Langrish, D.F. Fletcher, Numerical simulations of the gasflow patterns within a tall form spray dryer, Trans. IChemE 79 (2001) 235–248.
[42] D.J.E. Harvie, T.A.G. Langrish, D.F. Fletcher, A computationalfluid dynamics study of a tall-form spray dryer, Trans. IChemE C 80 (2002) 163–175.
[43]M. Ali, Numerical modelling of a counter-current spray drying tower(PhD thesis) University of Leeds, Leeds, United Kingdom, 2014.
[44]I. Zbicinski, A. Delag, C. Strumillo, J. Adamiec, Advanced experimental analysis of drying kinetics in spray drying, Chem. Eng. J. 86 (2002) 207–216.
[45]I. Zbicinski, C. Strumillo, A. Delag, Drying kinetics and particle residence time in spray drying, Dry. Technol. 20 (9) (2002) 1751–1768.
[46] I. Zbicinski, M. Piatkowski, Continuous and discrete phase behavior in counter cur-rent spray drying, Dry. Technol. 27 (12) (2009) 1353–1362.
[47]I. Zbicinski, R. Zietara, CFD model of counter-current spray drying process, Drying, São Paulo, Brazil, A 2004, pp. 169–176.
[48]G. Fieg, G. Wozny, K. Buick, L. Jeromin, Estimation of the drying rate and moisture profiles in an industrial spray dryer by means of experimental investigations and a simulation study, Chem. Eng. Technol. 17 (1994) 235–241.
[49] V. Francia, L. Martin, A.E. Bayly, M.J.H. Simmons, Agglomeration in counter-current spray drying towers, Part A: Particle interactions and the effect of the nozzle height, 2016,http://dx.doi.org/10.1016/j.powtec.2016.05.011.
[50]L. Ozmen, T.A.G. Langrish, An experimental investigation of the wall deposition of milk powder in a pilot-scale spray dryer, Dry. Technol. 21 (7) (2003) 1235–1252.
[51] K. Kota, T.A.G. Langrish, Fluxes and patterns of wall deposits for skim milk in a pilot-scale spray dryer, Dry. Technol. 24 (8) (2006) 993–1001.
[52] V. Francia, L. Martin, A.E. Bayly, M.J.H. Simmons, Influence of wall friction onflow re-gimes and scale up of swirl spray dryers, Chem. Eng. Sci. 134 (2015) 399–413.
[53] V. Francia, Spray drying of detergents in counter current towers: A study of turbu-lent swirlingflows, fouling and agglomeration(EngD thesis) School of Chemical En-gineering, University of Birmingham, Birmingham, UK, 2015.


![Fig. 10. Evolution of the product size distribution associated to nozzles #1 and #3 fromsingle-level operation conditions S1 and S3 [49] to multi-level operation conditions M1and M3 (a) nozzle #1, S1 [49] and M1 and (b) nozzle #3, S3 [49] and M3.](https://thumb-us.123doks.com/thumbv2/123dok_us/7836456.175801/10.595.67.267.51.449/evolution-distribution-associated-fromsingle-operation-conditions-operation-conditions.webp)