White Rose Research Online URL for this paper:
http://eprints.whiterose.ac.uk/118939/
Version: Published Version
Article:
Joyce, Vilija R., Sun, Huiying, Barnett, Paul G. et al. (9 more authors) (2017) Mapping
MOS-HIV to HUI3 and EQ-5D-3L in Patients With HIV. MDM Policy Practice.
https://doi.org/10.1177/2381468317716440
[email protected] https://eprints.whiterose.ac.uk/ Reuse
This article is distributed under the terms of the Creative Commons Attribution-NonCommercial (CC BY-NC) licence. This licence allows you to remix, tweak, and build upon this work non-commercially, and any new works must also acknowledge the authors and be non-commercial. You don’t have to license any derivative works on the same terms. More information and the full terms of the licence here:
https://creativecommons.org/licenses/
Takedown
If you consider content in White Rose Research Online to be in breach of UK law, please notify us by
Mapping MOS-HIV to HUI3 and EQ-5D-3L in
Patients With HIV
Vilija R. Joyce, MS, Huiying Sun, PhD, Paul G. Barnett, PhD, Nick Bansback, PhD,
Susan C. Griffin, MSc, Ahmed M. Bayoumi, MD, Aslam H. Anis, PhD,
Mark Sculpher, PhD, William Cameron, MD, Sheldon T. Brown, MD,
Mark Holodniy, MD, Douglas K. Owens, MD, MS
Objectives: The Medical Outcomes Study HIV Health Survey (MOS-HIV) is frequently used in HIV clinical trials; however, scores generated from the MOS-HIV are not suited for cost-effectiveness analyses as they do not assign utility values to health states. Our objective was to estimate and externally validate several mapping algo-rithms to predict Health Utilities Index Mark 3 (HUI3) and EQ-5D-3L utility values from the MOS-HIV. Methods: We developed and validated mapping algo-rithms using data from two HIV clinical trials. Data from the first trial (n = 367) formed the estimation data set for the HUI3 (4,610 observations) and EQ-5D-3L (4,662 observations) mapping algorithms; data from the second trial (n = 168) formed the HUI3 (1,135 observations) and EQ-5D-3L (1,152 observations) external validation data set. We compared ordinary least squares (OLS) models of increasing complexity with the more flexible two-part, beta regression, and finite mixture models. We assessed model performance using mean absolute error (MAE)
and mean squared error (MSE). Results:The OLS model that used MOS-HIV dimension scores along with squared terms gave the best HUI3 predictions (mean observed 0.84; mean predicted 0.80; MAE 0.0961); the finite mix-ture model gave the best EQ-5D-3L predictions (mean observed 0.90; mean predicted 0.88; MAE 0.0567). All models produced higher prediction errors at the lower end of the HUI3 and EQ-5D-3L score ranges (\0.40).
Conclusions: The proposed mapping algorithms can be used to predict HUI3 and EQ-5D-3L utility values from the MOS-HIV, although greater error may pose a problem in samples where a substantial proportion of patients are in poor health. These algorithms may be useful for esti-mating utility values from the MOS-HIV for cost-effective-ness studies when HUI3 or EQ-5D-3L data are not avail-able. Key words: AIDS; HIV; health-related quality of life; health utilities; preference-based measures; MOS-HIV; HUI3; EQ-5D; mapping. (MDM Policy & Practice XXXX:XX:xx–xx)
S
ince the advent of modern antiretroviral therapy (ART), HIV has transformed into a chronic and manageable disease.1–3 Coupled with the ongoing release of new effective treatments,4–6 the goal of therapy is to extend survival to levels near that of the general population while maximizing quality of life.7 To that end, researchers have used health sta-tus instruments to assess HIV’s impact on function-ing and quality of life, thus addfunction-ing useful informa-tion to clinical trials.8–13The Medical Outcomes Study HIV Health Survey (MOS-HIV) is one of the most frequently used instruments in HIV quality-of-life research and is
well-established in terms of its reliability, construct validity, and responsiveness.11,14,15 However, MOS-HIV scores are not suited for calculating quality-adjusted life years (QALYs) for use in cost-effectiveness analysis (CEA) as the instrument does not assign preference-based values to health states. The QALY, generated from preference-based values or utilities, provides a generic health outcome com-parable across disease areas and is the preferred mea-sure where CEA is used to inform national health care resource allocation.16 In practice, preference-based measures, such as the Health Utilities Index Mark 3 (HUI3) or EQ-5D-3L, are infrequently included along with other quality-of-life instruments in trials, thus limiting the ability to assess the cost-effectiveness of HIV interventions from such data.
Mapping, sometimes referred to as cross-walking, may help researchers who wish to conduct CEAs,
This Creative Commons Non Commercial CC-BY-NC: This article is distributed under the terms of the Creative Commons Attribution-NonCommercial 3.0 License (http://www.creativecommons.org/licenses/by-nc/4.0/) which permits non-commercial use, reproduction and distribution of the work without further permission provided the original work is attributed as specified on the SAGE and Open Access pages (https://us.sagepub.com/en-us/nam/open-access-at-sage).
ÓThe Author(s) 2017 Reprints and permission:
http://www.sagepub.com/journalsPermissions.nav DOI: 10.1177/2381468317716440
but are lacking utility values. The fundamental assumption underlying this approach is that the impacts on quality of life captured by the disease-specific health status measure overlap with those captured in the target utility measure. Mapping algorithms can be derived by specifying a regression model that uses the ‘‘target’’ utility measure as the dependent variable and includes the disease-spe-cific health status measure as an independent vari-able. Parameters from this regression can then be used to predict utility values based on the health status measure gathered in a different population.17 Bansback and others,18for example, developed
sev-eral models in which either the preference-based
EQ-5D-3L or Short Form-6D (SF-6D) were regressed on the domain scores from the Health Assessment Questionnaire Disability Index (HAQ-DI) in patients with rheumatoid arthritis (RA). These algorithms were then applied to studies that measured the HAQ-DI but not utility values. Predicted utility val-ues were used to assess the cost-effectiveness of numerous interventions in RA.19 Similar mappings have been developed using data from patients with Parkinson’s disease,20 cystic fibrosis,21 depres-sion,22and from other cohorts.17,23
Huang and others24 mapped the MOS-HIV onto the EQ-5D-3L, but to our knowledge, there are no studies that map the MOS-HIV onto the HUI3.
Our objective was to estimate and validate map-ping algorithms to predict HUI3 and EQ-5D-3L util-ity values from the MOS-HIV in patients with HIV. We built upon the work by Huang and others24 by comparing a series of ordinary least squares (OLS) models of increasing complexity with two-part, beta regression-based, and finite mixture models25 and assessing model performance using external valida-tion tests.
METHODS
Data
Data from the VA Cooperative Studies Program Options in Management with Antiretrovirals (OPTIMA) trial formed the estimation data sets. The design and main findings have been reported previously.26,27
Briefly, OPTIMA was a 2 3 2 factorial randomized clinical trial that randomized 368 multidrug-resistant HIV-infected patients to an intended 12-wk treat-ment interruption or no interruption and to ART intensification (five or more antiretroviral drugs) or standard ART (four or fewer antiretroviral drugs). Patients were eligible for enrollment if they had evi-dence of serial treatment failure or antiretroviral resistance, were receiving ART, had low CD4 counts (300 cells/mm3), and had HIV-1 viral load levels
5,000 copies/mL. The OPTIMA study was con-ducted at more than 70 clinical sites throughout the United Kingdom, Canada, and the United States between 2001 and 2006, with a median follow-up time of 3.2 years. We collected health status (MOS-HIV) and health-related quality-of-life (HRQoL) data (HUI3 and EQ-5D-3L) at baseline; weeks 6 and 12; and every 12 weeks thereafter.
Data from the CIHR Canadian HIV Trials Network Micronutrients and Antioxidants in HIV
Received 14 September 2016 from VA Palo Alto Health Care System, VA Cooperative Studies Program Coordinating Center, VA HSR&D Health Economics Resource Center, Menlo Park, California (VRJ, PGB); Centre for Health Evaluation and Outcome Sciences, St. Paul’s Hospital, Vancouver, British Columbia, Canada (HS, NB, AHA); Canadian HIV Trials Network, Vancouver, British Columbia, Canada (HS); School of Population and Public Health, University of British Columbia, Vancouver, British Columbia, Canada (NB, AHA); Centre for Health Economics, University of York, York, UK (SCG, MS); Centre for Urban Health Solutions, Li Ka Shing Knowledge Institute and Division of General Internal Medicine, St. Michael’s Hospital, Toronto, Ontario, Canada (AMB); Departments of Medicine and Health Policy, Management and Evaluation, University of Toronto, Ontario, Canada (AMB); Division of Infectious Diseases, University of Ottawa at The Ottawa Hospital, Ottawa, Ontario, Canada (WC); James J. Peters VA Medical Center, Bronx, New York (STB); VA Palo Alto Health Care System, Palo Alto, California (MH, DKO); Center for Primary Care and Outcomes Research, Stanford University, Stanford, California (DKO). This material is based on work supported by the Department of Veterans Affairs, Veterans Health Administration, Office of Research and Development, Cooperative Studies Program; the UK Medical Research Council; and the Canadian Institutes for Health Research. Options in Management with Antiretrovirals is the initial trial of the tri-national program involving the aforementioned three agencies. The views expressed in this article are those of the authors and do not necessarily reflect the position or policy of the Department of Veterans Affairs or the US government. The primary funding sources were the Department of Veterans Affairs Cooperative Studies Program, the United Kingdom Medical Research Council, and the Canadian Institutes for Health Research. Supported by the Cooperative Studies Program of the US Department of Veterans Affairs Office of Research and Development, the Canadian Institutes for Health Research, and the UK Medical Research Council. Revision accepted for publication 10 May 2017.
The online appendixes for this article are available on the Medical Decision Making Policy & PracticeWeb site at http://journals.sagepub. com/home/mpp.
Infection (MAINTAIN) study formed the external validation data sets for the HUI3 and EQ-5D-3L mapping models.28,29MAINTAIN was a multicenter randomized double-blind clinical trial evaluating micronutrient supplementation that randomized 171 HIV-infected patients to receive either a micro-nutrients and antioxidants preparation or multivita-mins and minerals for 2 years. Participants were eli-gible if they were asymptomatic adults with baseline CD4 counts375 and750 mm3and were ART naı¨ve. MAINTAIN, which enrolled patients between 2009 and 2012, was conducted at 16 sites throughout Canada. Follow-up concluded in 2014. Data on HRQoL, including MOS-HIV, HUI3, and EQ-5D-3L, were collected at baseline and at quar-terly intervals through study termination (week 96).
While there are several recommendations cur-rently available for use,30,31we chose to follow the MApping onto Preference-based measures reporting Standards (MAPS).32,33 The US Department of Veterans Affairs, the UK Medical Research Council, and the Canadian Institutes for Health Research approved the design and conduct of the OPTIMA clinical trial. The Canadian Institutes for Health Research approved the use of MAINTAIN data for the purposes of this study. None of the agencies listed had a role in the writing of this article. The authors have no competing interests.
Instruments
The MOS-HIV is a 30-item descriptive disease-specific questionnaire assessing 10 dimensions of health focused on capturing health impairments that are unique to patients with HIV.15 The sub-scales for the dimensions range from 0 to 100 with higher scores indicating better health.
The HUI3 includes 17 questions used to calculate 8 attributes each with 5 or 6 levels for a total of 972,000 possible health states.34 Preference weights were estimated with valuation data from a random sample of the general population in Hamilton, Ontario, Canada, and were used in a multiplicative model to compute utility values ranging from 20.36 to 1. For all preference-based instruments used in the primary and validation data sets, a score of 0 is equiv-alent to death and a score of 1 represents full health.
The EQ-5D-3L is a five-item questionnaire cover-ing five dimensions of health.35 Each dimension contains three levels for a total of 245 possible health states. Value sets for the EQ-5D-3L have been developed for many countries, which enable the
estimation of an index for each possible health state.36 We used Shaw and colleagues’37 US population–based EQ-5D-3L preference weights to calculate the EQ-5D-3L index (range: 20.11 to 1). All instruments were in English and paper-based.
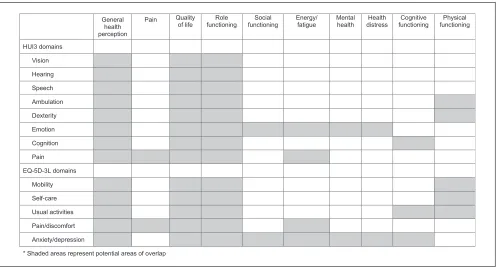
In order to assess conceptual overlap between the MOS-HIV and either the HUI3 or EQ-5D-3L, we dia-grammed the overlap between HUI3 or EQ-5D-3L domains and MOS-HIV dimensions (Figure 1) and analyzed Spearman correlations between HUI3 or EQ-5D-3L domains and MOS-HIV dimensions or summary scores (Appendix Table 1).
Statistical Analysis
All surveys with complete responses to the HUI3 or EQ-5D-3L were included. Per developer guide-lines, we substituted missing MOS-HIV values with mean values if more than 2 items in a subscale were missing and if the number of missing items was
50%.15 Given that the relationship between the utility measure (either the HUI3 or EQ-5D-3L) and the MOS-HIV is unlikely to change over time, we pooled data from all time points for the estimation or external validation data sets. We calculated robust cluster-corrected standard errors to take into account multiple observations per subject. All anal-yses were performed using STATA version 13.1 (StataCorp, College Station, TX) and SAS 9.4 (SAS Institute, Cary, NC).
We reported descriptive statistics as means (stan-dard deviation [SD]) for continuous data and per-centages for categorical data, unless noted other-wise, by study.
We applied four different statistical techniques in building our mapping models, OLS, two-part regression, beta regression, and finite mixture, to map to either the HUI3 or EQ-5D-3L index scores. OLS is the most common mapping approach17,23 and has been shown to predict mean values with reasonable accuracy. We evaluated several OLS regression models.Models 1a and 2a: HUI3 or EQ-5D-3L index regressed on 10 MOS-HIV dimensions of health;Models 1b and 2b: same as1aand2awith the addition of squared terms; Models 1c and 2c: same as 1band2b with the addition of all possible two-way interaction terms. We added squared terms to address potential nonlinear associations between MOS-HIV dimension scores and either the HUI3 or EQ-5D-3L utility values. Interaction terms were sub-sequently added given evidence that dimensions are not additive.34
MAPPING MOS-HIV TO HUI3 AND EQ-5D-3L
Two-part models have also been used in previous mapping studies38 as a way to accommodate those with EQ-5D-3L (HUI3) scores of one (perfect health) and any differences they have compared to those with less than perfect health.Models 1d and 2duse a logistic regression to estimate the probability of full health, as well as an OLS regression using the 10 MOS-HIV dimensions of health to predict the EQ-5D-3L (HUI3) index score for those in less than full health. The predicted EQ-5D-3L (HUI3) index score is the product of the predicted probability from the logistic regression and the predicted expected value from the OLS regression. We used the STATAtwopm
module, which required that we transform our index values (e.g.,Y= 12 EQ-5D-3L) prior to running the models.
Basu and Manca25 explored several regression models based on the beta distribution. The authors sought to address the characteristics typical of HRQoL data, including negative skew, upper and lower bounds to observed values (truncated sup-ports), and spikes at 1 (perfect health). They found that one- and two-part beta regression models are more robust in estimating covariate effects than OLS. The HUI3 and the EQ-5D-3L data possess many of these typical characteristics including long
left tails, an upper bound at 1, and a lower bound determined by tariffs. As such, we evaluated beta regression based on quasi likelihood estimation (Beta QMLE) using the STATA programbetafitdeveloped by Basu and Manca in which we used transformed HUI3 or EQ-5D-3L index scores regressed on 10 MOS-HIV dimensions of health (Models 1e and 2e; transformation and prediction methods described in Appendix Table 2; full method detailed in Basu and Manca25).
Finite mixture models have been used to address the often multimodal distribution of utilities. These types of models allow for unobserved heterogeneity for different classes of individuals by assuming a combination of two or more distributions mixed with unknown probabilities. Previous studies have used finite mixture models to map the Roland Morris Questionnaire and Parkinson’s Disease Questionnaire to the EQ-5D-3L20,39and estimate the HUI3.40 Coca Perraillon and others mapped the
SF-12 to the EQ-5D-3L and found that finite mixture models outperformed OLS and two-part models. The authors noted that finite mixture model predic-tions were best at the tails of the distribution.41 We used the authors’zicen STATA module to map the 10 MOS-HIV dimensions onto the EQ-5D-3L.Model
[image:5.594.49.546.92.359.2]2fcharacterizes the EQ-5D-3L index as a mixture of three distributions: two censored normal (Tobit) distributions and a third distribution with a mass of values at 1 (perfect health). We attempted to map the 10 dimensions onto the HUI3, but our finite mixture models, either with three or two classes, would not converge. Model 1f maps the physical health summary and mental health summary scores onto the HUI3 using a mixture of two distributions: one censored normal distribution and one with a mass of values at 1 (perfect health). Similar to our two-part models, we transformed the EQ-5D-3L and HUI3 val-ues prior to running the models (e.g.,Y= 12HUI3).
We fit our models using the OPTIMA data set as our estimation cohort. The models were also applied to the MAINTAIN data set to explore the external validity of the algorithms. Parameters from these models were then applied to the MOS-HIV values to predict the utility values that would have been estimated by either HUI3 or EQ-5D-3L. We com-pared the predicted values to the actual values obtained in the MAINTAIN trial. We explored the models’ goodness of fit by examining the mean and range of predicted values. We also reviewed the dif-ference between predicted values and the values observed in the OPTIMA and MAINTAIN trials by reporting the mean squared error (MSE), which is the mean of squared differences between observed and predicted utility value scores, and mean absolute error (MAE), which is the mean of the absolute differ-ences between observed and predicted utility value scores. A priori, we used MAE to choose the preferred model. We also reviewed the pattern of MAE across the range of utility values for HUI3 and EQ-5D-3L by reporting predicted values for subsets of the indices.
RESULTS
Study Cohort
OPTIMA collected 4,783 HUI3 surveys, 4,852 EQ-5D-3L surveys, and 4,787 MOS-HIV surveys over a maximum of 6.25 years (median, 3.2 years) for 367 patients. One patient did not complete any HRQoL surveys. Of those surveys, 4,610 included data on both the HUI3 and all MOS-HIV dimensions of health, while 4,662 had data on both the EQ-5D-3L and all MOS-HIV dimensions. MAINTAIN col-lected 1,163 HUI3 surveys, 1,182 EQ-5D-3L surveys, and 1,163 MOS-HIV surveys over 30.7 months (med-ian, 10.9 months) for 168 patients. Of those, 1,135 included data on both the HUI3 and all 10 MOS-HIV dimensions of health; 1,152 had data on both
the EQ-5D-3L and all MOS-HIV dimensions. Three patients failed to complete any HRQoL surveys.
OPTIMA subjects, who made up the estimation sample, were on average older (48 years v. 38 years), included more men (98% v. 83%), were more racially diverse (51% non-White v. 29%), and had a lower median CD4+ cell count (108 v. 494 cells/mm3) than MAINTAIN subjects (external validation sample).
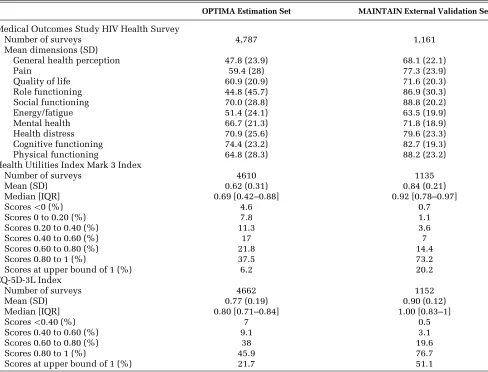
There were also differences in HRQoL data recorded in the estimation and validation data sets (Table 1). For example, the MOS-HIV score for phys-ical functioning was 64.8 (SD 28.3) in the OPTIMA cohort versus 88.2 (SD 23.2) in the MAINTAIN cohort. Preference-based scores also varied, with a mean HUI3 index score of 0.62 (SD 0.31) in OPTIMA and 0.84 (SD 0.21) in the MAINTAIN data set. The mean EQ-5D-3L index score was 0.77 (0.19) in the OPTIMA data set and 0.90 (SD 0.12) in the MAINTAIN data set. As expected, EQ-5D-3L scores were skewed at the upper bound; approximately 22% of OPTIMA surveys and 51% of MAINTAIN surveys had scores of 1.
Model Estimation
Results from all models are shown in Appendix Tables 3 and 4; results from our preferred models are shown in Table 2. Across the OLS (1a-1c), two-part (1d), and beta QMLE (1e) HUI3 models, improvements in almost all MOS-HIV dimension scores were significantly associated with improve-ments in preference-based quality of life. Squared terms for pain and social functioning in Models 1b and 1c are always negative and significant (P \
0.05); several interaction terms in Model 1c are also significant with mixed signs.
Most main coefficients in the EQ-5D-3L Models 2a (OLS), 2d (two-part), 2e (Beta QMLE) had the expected sign and were significant, indicating that improvements in MOS-HIV dimensions were asso-ciated with higher EQ-5D-3L utility value scores. Across all EQ-5D-3L models, improvements in pain and physical functioning were significantly associ-ated with an improvement in EQ-5D-3L index score. As with the HUI3 models, squared terms for pain and social functioning in Models 2b and 2c are neg-ative and significant, as is quality of life (P\0.05);
some interaction terms in Model 2c are significant.
Model Validation and Performance
All models performed similarly in their ability to predict the mean observed HUI3 utility value score
MAPPING MOS-HIV TO HUI3 AND EQ-5D-3L
in the validation sample 0.84 (SD 0.21) with means of 0.80 or 0.81 (SD 0.18–0.21) (Table 3). Most mod-els predicted negative values with Model 1c pre-dicting the value closest to the observed minimum value (20.05 v. 20.14). Ranked by MSE and MAE, the OLS model with squared terms (1b) gave the best predictions (MSE 0.0197 and MAE 0.0961).
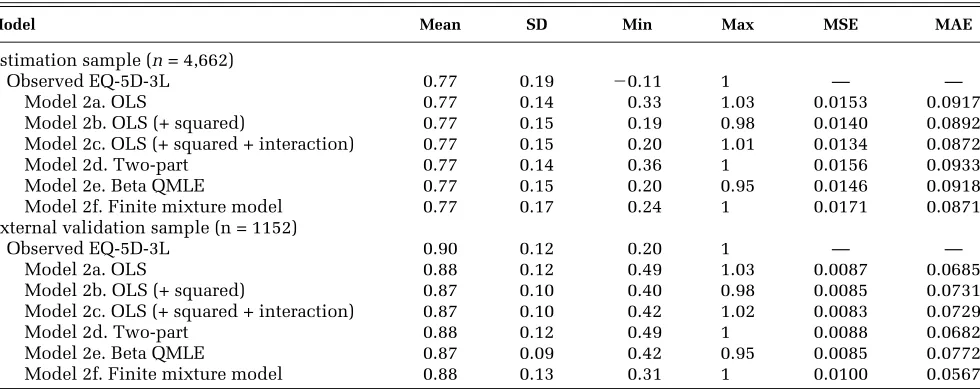
Also, all models were similar in their ability to predict mean EQ-5D-3L in the external validation data set (0.90, SD 0.12) with means of 0.87 or 0.88 (SD 0.09–0.13) (Table 4). The finite mixture model (2f) came closest to predicting the lowest observed EQ-5D-3L utility value score of 0.20 with a lowest predicted score of 0.31. The two-part model (2d), along with the finite mixture model (2f), came
closest to predicting the maximum EQ-5D-3L utility value score without exceeding 1. The model with the lowest MSE (0.0083) was the OLS model with squared and interaction terms (2c). If ranked by MAE, however, the finite mixture model (2f) gave the best predictions (0.0567).
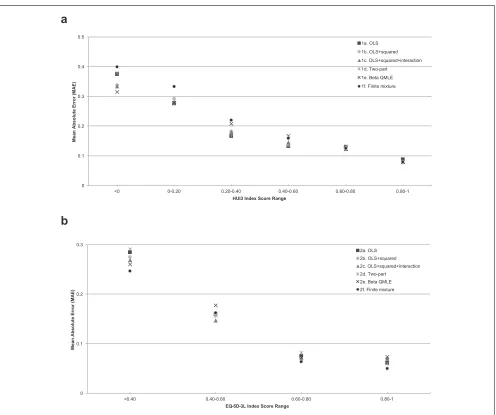
[image:7.594.53.541.124.496.2]Mean absolute error, regardless of model, was much greater at the lower ends of the utility mea-sure ranges, which indicate poorer health, than at the upper ends (Figure 2a and b). For example, in the Beta QMLE model, for HUI3 utility value scores below 0.40, the mean absolute errors in the external validation sample ranged from 0.21 to 0.31. An observed HUI3 score of, for example, 0.40, might have a complementary predicted score of anywhere
Table 1 Health-Related Quality-of-Life Scores for the OPTIMA Estimation Sample and MAINTAIN External Validation Sample
OPTIMA Estimation Set MAINTAIN External Validation Set
Medical Outcomes Study HIV Health Survey
Number of surveys 4,787 1,161
Mean dimensions (SD)
General health perception 47.8 (23.9) 68.1 (22.1)
Pain 59.4 (28) 77.3 (23.9)
Quality of life 60.9 (20.9) 71.6 (20.3)
Role functioning 44.8 (45.7) 86.9 (30.3)
Social functioning 70.0 (28.8) 88.8 (20.2)
Energy/fatigue 51.4 (24.1) 63.5 (19.9)
Mental health 66.7 (21.3) 71.8 (18.9)
Health distress 70.9 (25.6) 79.6 (23.3)
Cognitive functioning 74.4 (23.2) 82.7 (19.3) Physical functioning 64.8 (28.3) 88.2 (23.2) Health Utilities Index Mark 3 Index
Number of surveys 4610 1135
Mean (SD) 0.62 (0.31) 0.84 (0.21)
Median [IQR] 0.69 [0.42–0.88] 0.92 [0.78–0.97]
Scores\0 (%) 4.6 0.7
Scores 0 to 0.20 (%) 7.8 1.1
Scores 0.20 to 0.40 (%) 11.3 3.6
Scores 0.40 to 0.60 (%) 17 7
Scores 0.60 to 0.80 (%) 21.8 14.4
Scores 0.80 to 1 (%) 37.5 73.2
Scores at upper bound of 1 (%) 6.2 20.2
EQ-5D-3L Index
Number of surveys 4662 1152
Mean (SD) 0.77 (0.19) 0.90 (0.12)
Median [IQR] 0.80 [0.71–0.84] 1.00 [0.83–1]
Scores\0.40 (%) 7 0.5
Scores 0.40 to 0.60 (%) 9.1 3.1
Scores 0.60 to 0.80 (%) 38 19.6
Scores 0.80 to 1 (%) 45.9 76.7
Scores at upper bound of 1 (%) 21.7 51.1
Table 2 Parameter Estimates for the Preferred Models Used to Estimate HUI3 Index (Model 1b) and EQ-5D-3L Index (Model 2f)
Model 2f—EQ-5D-3LFinite Mixture;s1 = .022626,s2 = .155041
Model 1b—HUI3; OLS EQ1 EQ2 IMLOGIT1 IMLOGITP2
b SE b SE b SE b SE b SE
Intercept 20.439103* 0.058571 0.26825464* .0036095 0.70584905* .0149963 11.076029* .5285108 16.555844* 0.6236399 MOS-HIV dimensions
General health perception 0.001869* 0.000630 20.000001813 .0000329 0.00016097 .0002595 20.00695022* .0030701 20.00862315* 0.0043556 Pain 0.007183* 0.000671 20.00030894* .0000255 20.00413961* .0002044 20.0406544* .0025694 20.06313058* 0.0036435 Quality of life 0.001779* 0.000816 20.00013865* .0000412 20.00091289* .0002921 20.00382105 .0040006 20.01298886* 0.0054761 Role functioning 0.000156 0.000417 20.00007279* .0000142 0.0010807* .0001904 20.00666376* .0014582 20.01995899* 0.0021132 Social functioning 0.003304* 0.000703 20.000005094 .000031 20.00082791* .0002063 20.00350141 .0035252 20.00687216 0.0042682 Energy/fatigue 0.002787* 0.000912 0.00002412 .0000382 0.00049648 .0002774 20.00635364 .0035594 20.01552923* 0.0048987 Mental health 0.002948* 0.001285 20.00029687* .0000455 20.00040869 .0003335 20.028013* .0045861 20.03206664* 0.0061638 Health distress 20.001440 0.000786 20.00004191 .0000363 20.00030816 .0002361 20.01162153* .0040871 20.0167202* 0.0050887 Cognitive functioning 0.003267* 0.001260 20.00010271* .0000353 0.00000712 .0002322 20.02148051* .004639 20.03952272* 0.0058227 Physical functioning 0.000591 0.000736 20.00017095* .0000292 20.00097572* .0002179 20.00523421* .0023961 20.02822543* 0.0035124 MOS-HIV squared dimensions
General health perception_sq 20.000015* 0.000006 Pain_sq 20.000037* 0.000005 Quality of life_sq 20.000005 0.000007 Role functioning_sq 0.000005 0.000004 Social functioning_sq 20.000020* 0.000006 Energy/fatigue_sq 20.000016* 0.000008 Mental health_sq 20.000012 0.000010 Health distress_sq 0.000008 0.000006 Cognitive functioning_sq 0.000006 0.000009 Physical functioning_sq 0.000004 0.000006
Note: HUI3 = Health Utilities Index Mark 3 survey; MOS-HIV = Medical Outcomes Study HIV Health Survey; OLS = ordinary least squares. *P\0.05.
between 0.19 and 0.61. In contrast, for HUI3 utility scores above 0.40, the MAE ranged from 0.17 to 0.08. The Beta QMLE HUI3 mapping model per-formed best (lowest MAE) at the lowest end of the score ranges (\0); the finite mixture EQ-5D-3L
model performed best for those with EQ-5D-3L scores\0.40.
Applying the Mapping Algorithm
[image:9.594.52.545.111.306.2]We have illustrated how to calculate utility value scores from the MOS-HIV by providing an example below as well as examples in an online supplement. Here we have calculated HUI3 scores based on the parameter estimates from the HUI3 OLS+squared
Table 3 Performance of Mapping Models to Predict HUI3 Utilities From MOS-HIV Data
Model Mean SD Min Max MSE MAE
Estimation sample (n= 4,610)
Observed HUI3 0.62 0.31 20.35 1 — —
Model 1a. OLS 0.62 0.26 20.25 1.10 0.0304 0.1332 Model 1b. OLS (+ squared) 0.62 0.26 20.44 1.02 0.0283 0.1261 Model 1c. OLS (+ squared + interaction) 0.62 0.27 20.40 1.01 0.0271 0.1224 Model 1d. Two-part 0.62 0.26 20.25 1.07 0.0302 0.1315 Model 1e. Beta QMLE 0.62 0.27 20.24 0.95 0.0291 0.1277 Model 1f. Finite mixturea 0.63 0.26 20.18 1.14 0.0349 0.1431 External validation sample (n= 1,135)
Observed HUI3 0.84 0.21 20.14 1 — —
Model 1a. OLS 0.81 0.21 0.08 1.09 0.0215 0.1040 Model 1b. OLS (+ squared) 0.80 0.19 20.004 1.01 0.0197 0.0961 Model 1c. OLS (+ squared + interaction) 0.80 0.20 20.05 1.01 0.0206 0.0981 Model 1d. Two-part 0.81 0.21 0.08 1.05 0.0209 0.0993 Model 1e. Beta QMLE 0.80 0.18 20.003 0.95 0.0199 0.0988 Model 1f. Finite mixture 0.80 0.18 0.05 0.97 0.0209 0.1015
Note: HUI3 = Health Utilities Index Mark 3 survey; MOS-HIV = Medical Outcomes Study HIV Health Survey; MSE = mean squared error; MAE = mean absolute error; OLS = ordinary least squares; Beta QMLE = beta regression based on quasi likelihood estimation.
a
Model 1f maps the physical health summary (PHS) and mental health summary (MHS) scores onto the HUI3. A previous model which mapped the 10 MOS-HIV dimensions onto the HUI3 failed to converge.
Table 4 Performance of Mapping Models to Predict EQ-5D-3L Utilities From MOS-HIV Data
Model Mean SD Min Max MSE MAE
Estimation sample (n= 4,662)
Observed EQ-5D-3L 0.77 0.19 20.11 1 — —
Model 2a. OLS 0.77 0.14 0.33 1.03 0.0153 0.0917 Model 2b. OLS (+ squared) 0.77 0.15 0.19 0.98 0.0140 0.0892 Model 2c. OLS (+ squared + interaction) 0.77 0.15 0.20 1.01 0.0134 0.0872 Model 2d. Two-part 0.77 0.14 0.36 1 0.0156 0.0933 Model 2e. Beta QMLE 0.77 0.15 0.20 0.95 0.0146 0.0918 Model 2f. Finite mixture model 0.77 0.17 0.24 1 0.0171 0.0871 External validation sample (n = 1152)
Observed EQ-5D-3L 0.90 0.12 0.20 1 — —
Model 2a. OLS 0.88 0.12 0.49 1.03 0.0087 0.0685 Model 2b. OLS (+ squared) 0.87 0.10 0.40 0.98 0.0085 0.0731 Model 2c. OLS (+ squared + interaction) 0.87 0.10 0.42 1.02 0.0083 0.0729 Model 2d. Two-part 0.88 0.12 0.49 1 0.0088 0.0682 Model 2e. Beta QMLE 0.87 0.09 0.42 0.95 0.0085 0.0772 Model 2f. Finite mixture model 0.88 0.13 0.31 1 0.0100 0.0567
[image:9.594.54.544.382.577.2]terms model (Table 2, Model 1b); the online supple-ment calculates EQ-5D-3L scores from the finite mixture model estimates (Table 2, Model 2f).
HUI3 = –0.439103 + (0.001869*GeneralHealth Perception) + (0.007183*Pain) + (0.001779*QualityOfLife) + (0.000156*RoleFunctioning) + (0.003304*SocialFunctioning) + (0.002787*EnergyFatigue) + (0.002948*MentalHealth) + (–0.001440*HealthDistress) + (0.003267*CognitiveFunctioning) + (0.000591*PhysicalFunctioning) + (–0.000015*GeneralHealthPerception_sq) + (–0.000037*Pain_sq) +
(–0.000005*QualityOfLife_sq) + (0.000005*RoleFunctioning_sq) + (–0.000020*SocialFunctioning_sq) + (–0.000016*EnergyFatigue_sq) + (–0.000012*MentalHealth_sq) + (0.000008*HealthDistress_sq) + (0.000006*CognitiveFunctioning_sq) + (0.000004*PhysicalFunctioning_sq)
DISCUSSION
In accordance with the MAPS statement,32,33we
developed and compared the performance of several regression models mapping MOS-HIV dimension scores onto HUI3 or EQ-5D-3L utility values. The OLS model with squared terms (1b) is the preferred model with the best goodness of fit (MAE 0.0961) among the HUI3 mapping models; the finite mixture model (2f) is the preferred model among the EQ-5D-3L mapping models with a MAE of 0.0567. To our knowledge, this study is the first to map the MOS-HIV onto the HUI3.
Previous mapping models have reported MAEs at the individual level ranging from 0.0011 to 0.1917; the models presented here performed well within that range with external validation MAEs ranging from 0.0567 (EQ-5D-3L, Model 2f) to 0.1040 (HUI3, Model 1a). We also found that, similar to other map-ping studies, there was considerable mean absolute error variation across the range of either HUI3 or EQ-5D-3L index scores. This phenomenon has been found in previous studies.16,17 Hawton and oth-ers,16 for example, mapped the Multiple Sclerosis Impact Scale onto the EQ-5D-3L and found that MAEs for predicted utility value scores increased as EQ-5D-3L scores decreased, with MAE values greater than 0.25 for EQ-5D-3L utility values less
than 0.249. It is important to note that variation in MAE at the lower end of the range may be related to smaller sample sizes. Only 5.4% of all of the EQ-5D-3L values collected in the validation sample fell below 0.40.
To date, only Huang and others24 have mapped the MOS-HIV onto the EQ-5D-3L. Their preferred models included a latent class model and a two-part model with a log-transformed dependent vari-able. We were unable to compare model perfor-mance since the authors did not report estimates of mean absolute error or mean standard error and did not report the parameters for the intercept needed to apply the mapping algorithms to our external vali-dation data set. However, in comparing parameter estimates from Huang’s basic OLS model and our basic OLS model (2a), we found that physical func-tioning, pain, health distress, and mental health were all statistically significant predictors for both models. Differences between our mapping algo-rithms may be explained by the fact that Huang’s cohort was younger, had a slightly higher mean base-line CD4 cell count, and was less racially diverse than the OPTIMA sample used to derive our map-ping algorithm. The percentage of EQ-5D-3L scores at the ceiling may also play a part; over 40% of patients had the maximum EQ-5D-3L score of 1 in Huang’s cohort compared to just 22% in OPTIMA.
Our study had several limitations. First, we did not include sociodemographic or clinical variables into any of our models. Including these variables would control for more factors that would influence quality of life; however, it would also restrict the application of our mapping algorithms to only those trials that recorded the same information along with the MOS-HIV. However, adding basic sociodemo-graphic characteristics such as age may allow for the fact that measures of HRQoL often do not per-form equally across different age groups. Second, we applied US tariffs when calculating EQ-5D-3L scores regardless of the country of origin for the individual quality of life surveys in the estimation and validation data sets. Most scores (78%) in our estimation sample came from US study partici-pants. Choosing a single tariff allowed us to focus on internal validity, despite the loss of some gener-alizability. We expect the mappings to behave simi-larly for other tariffs, but we leave this topic to future research. Finally, we found that predictions were less accurate at the lower range of EQ-5D-3L utility values. These problems may limit the applic-ability of this mapping algorithm for studies with cohorts in very poor health.
MAPPING MOS-HIV TO HUI3 AND EQ-5D-3L
Regardless of the HIV cohort, prospective direct or indirect elicitation of utility values is important and is preferred to mapped utility values as it avoids introducing additional uncertainty into the estimates.30However, when preference-based meth-ods are not feasible or not available, our externally validated mapping algorithms allow clinicians and researchers to obtain reliable estimates of mean HUI3 and EQ-5D-3L scores from studies that only collected the MOS-HIV. These predicted utility val-ues can be useful in populating health states in eco-nomic models.
ACKNOWLEDGMENTS
We thank Adam Chow for his assistance with data clean-ing and Manisha Desai, PhD, for her assistance with data analysis.
TRIAL REGISTRATION
http://clinicaltrials.gov, Number NCT00050089.
COORDINATING CENTERS
UK and Ireland: MRC Clinical Trials Unit (CTU), London (B. Angus, A. Babiker, J. Darbyshire, Y. Collaco-Moraes,
[image:11.594.50.546.89.504.2]R. Goodall, M. Hooker, F. Hudson, K. Taylor, and J. Wait).
Canada: Canadian HIV Trials Network (CTN), Vancouver, British Columbia (J. Singer, M. Schechter, and M. Piaseczny).
USA: Cooperative Studies Program Coordinating Center (CSPCC), West Haven, CT (T. C. Kyriakides, P. Peduzzi, P. Guarino, M. Antonelli, J. Russo, J. Poulton, S. Stratton, and T. Roy); Cooperative Studies Program Clinical Research Pharmacy, Albuquerque, NM (K. Swanson). Coordination of the trial was carried out by each country’s coordinating center. The merged databases were held and maintained at the CTN, Vancouver, British Columbia, Canada; the MRC CTU, London, UK; and the CSPCC, West Haven, CT, USA.
+OPTIMA STUDY GROUP
Department of Veterans Affairs Investigators
Sandro Cinti, MD (Ann Arbor VAMC); David Rimland, MD (Atlanta VAMC); Anthony Amoroso, MD, Kris Ann Oursler, MD, SCM (Baltimore VAMC); David Johnson, MD, Tiffany Surles, PharmD (Bay Pines VAMC); David Thornton, MD, Judith Strymish, MD, Catherine Fleming, MD (Boston VAMC); Juan Bandres, MD, Catherine Martyn, MS, FNP (Bronx VAMC); Alan George Smulian, MD (Cincinnati VAMC); Robert Bonomo, MD, Gopal Yadavalli, MD, Janet M. Briggs, RN, MSN (Cleveland VAMC); Stephan Hawes, MD (Columbia VAMC); Roger Bedimo, MD, David Margolis, MD (Dallas VAMC); Kenneth Wilson, MD (Durham VAMC); Lisa Dever (East Orange VAMC); Bradley S. Bender, MD (Gainesville VAMC); Constance Pachucki, MD (Hines VAMC); Maria Rodriguez-Barradas, MD (Houston VAMC); Matthew B. Goetz, MD (Los Angeles VAMC); Rodney Wishnow, MD, Stephan Berman, MD, PhD (Long Beach VAMC); Nancy Klimas, MD, Gordon Dickinson, MD (Miami VAMC); Mark Holodniy, MD, Victoria Faria, RN (Palo Alto VAMC); Joel Maslow, MD (Philadelphia VAMC); Chris Reust, MD (Phoenix VAMC); Thomas T. Ward, MD, Melissa Murphy, MD (Portland VAMC); Gregory Anstead, MD, Raymond Chung, MD (San Antonio VAMC); David Looney (San Diego VAMC); Sonia Saavedra, MD, Carlos R. Rivera-Vazquez, MD (San Juan VAMC); Cynthia Gibert, MD (Washington, DC VAMC); Michael Kozal, MD, Michael O. Rigsby, MD (West Haven VAMC).
UK Investigators
Professor Brian Gazzard, Chris Higgins, Charlotte Mahuma (Chelsea & Westminster Hospital, London); Professor Margaret Johnson, Dr. Mike Youle, Zoe Cuthbertson (Royal Free Hospital, London); Dr. Alan Winston, Dr. John Walsh, Norman Gariwa (St Mary’s Hospital, London); Dr. Ranjababu Kulasegaram, Isabelle Jendrulek (St Thomas’ Hospital, London); Dr. Brian
Angus (Churchill Hospital, Oxford); Dr. Jean Tobin, Linda Tucker (St Mary’s Hospital, Portsmouth); Dr. George Kinghorn, Dr. David Dockrell, Chris Care (Royal Hallamshire Hospital, Sheffield); Dr. Ian Williams, David Cornforth (University College London, Mortimer Market Centre); Dr. Chloe Orkin, James Hand (St Bartholomew’s Hospital, London).
Canada Investigators
Alain Piche´ (Centre Hospitalier Universitaire de Sherbrooke, Sherbrooke, Quebec), Sylvie Trottier (Le Centre Hospitalier de l’Universite´ Laval, Quebec, Quebec), Robert O’Brien (Clinique Me#dicale l’Actuel, Montreal, Quebec), Alain Martel (Le Centre Hospitalier de l’Universite´ Laval, Quebec, Quebec), D. William Cameron (The Ottawa Hospital, Ottawa, Ontario), Bill Thompson, Edward Ralph (St. Joseph’s Hospital, London, Ontario), Sharon Walmsley (University Health Network, Toronto, Ontario), Peter Ford, Wendy Wobeser (Kingston General Hospital, Kingston, Ontario), Don Kilby (University of Ottawa Heath Services, Toronto, Ontario), Walter Schlech (Victoria General Hospital, Halifax, Nova Scotia), Brian Conway (Downtown Immunodeficiency Clinic, UBC, Vancouver, British Columbia), John Gill (Southern Alberta Clinic, Calgary, Alberta), Stephen Shafran (University of Alberta Hospital, Edmonton, Alberta).
REFERENCES
1. Hammer SM, Squires KE, Hughes MD, et al. A controlled trial of two nucleoside analogues plus indinavir in persons with human immunodeficiency virus infection and CD4 cell counts of 200 per cubic millimeter or less. AIDS Clinical Trials Group 320 Study Team. N Engl J Med. 1997;337(11):725–33.
2. Hogg RS, Heath KV, Yip B, et al. Improved survival among HIV-infected individuals following initiation of antiretroviral therapy. JAMA. 1998;279(6):450–4.
3. Palella FJ Jr, Delaney KM, Moorman AC, et al. Declining mor-bidity and mortality among patients with advanced human immunodeficiency virus infection. HIV Outpatient Study Investigators. N Engl J Med. 1998;338(13):853–60.
4. Cahn P, Villacian J, Lazzarin A, et al. Ritonavir-boosted tipra-navir demonstrates superior efficacy to ritotipra-navir-boosted protease inhibitors in treatment-experienced HIV-infected patients: 24-week results of the RESIST-2 trial. Clin Infect Dis. 2006;43(10): 1347–56.
5. Madruga JV, Cahn P, Grinsztejn B, et al. Efficacy and safety of TMC125 (etravirine) in treatment-experienced HIV-1-infected patients in DUET-1: 24-week results from a randomised, double-blind, placebo-controlled trial. Lancet. 2007;370(9581):29–38. 6. Molina JM, Cohen C, Katlama C, et al. Safety and efficacy of darunavir (TMC114) with low-dose ritonavir in treatment-experi-enced patients: 24-week results of POWER 3. J Acquir Immune Defic Syndr. 2007;46(1):24–31.
MAPPING MOS-HIV TO HUI3 AND EQ-5D-3L
7. Wu AW. Quality of life assessment comes of age in the era of highly active antiretroviral therapy. AIDS. 2000;14(10):1449–51. 8. Wilson D, Goggin K, Williams K, et al. Consumption of Sutherlandia frutescens by HIV-seropositive South African adults: an adaptive double-blind randomized placebo controlled trial. PLoS One. 2015;10(7):e0128522.
9. Guwatudde D, Wang M, Ezeamama AE, et al. The effect of standard dose multivitamin supplementation on disease progres-sion in HIV-infected adults initiating HAART: a randomized dou-ble blind placebo-controlled trial in Uganda. BMC Infect Dis. 2015;15:348.
10. Langebeek N, Sprenger HG, Gisolf EH, et al. A simplified combination antiretroviral therapy regimen enhances adherence, treatment satisfaction and quality of life: results of a randomized clinical trial. HIV Med. 2014;15(5):286–90.
11. Wu AW, Hanson KA, Harding G, et al. Responsiveness of the MOS-HIV and EQ-5D in HIV-infected adults receiving antiretro-viral therapies. Health Qual Life Outcomes. 2013;11:42.
12. McDonald C, Uy J, Hu W, et al. Clinical significance of hyper-bilirubinemia among HIV-1-infected patients treated with ataza-navir/ritonavir through 96 weeks in the CASTLE study. AIDS Patient Care STDS. 2012;26(5):259–64.
13. Joyce VR, Barnett PG, Chow A, et al. Effect of treatment inter-ruption and intensification of antiretroviral therapy on health-related quality of life in patients with advanced HIV: a rando-mized, controlled trial. Med Decis Making. 2012;32(1):70–82. 14. Holmes WC. HIV/AIDS, utilities, and cost-effectiveness anal-ysis: stepping toward the future. Med Decis Making. 2002;22(6): 522–5.
15. Wu AW, Revicki DA, Jacobson D, Malitz FE. Evidence for reliability, validity and usefulness of the Medical Outcomes Study HIV Health Survey (MOS-HIV). Qual Life Res. 1997;6(6): 481–93.
16. Hawton A, Green C, Telford C, Zajicek J, Wright D. Using the Multiple Sclerosis Impact Scale to estimate health state utility values: mapping from the MSIS-29, version 2, to the EQ-5D and the SF-6D. Value Health. 2012;15(8):1084–91.
17. Brazier JE, Yang Y, Tsuchiya A, Rowen DL. A review of stud-ies mapping (or cross walking) non-preference based measures of health to generic preference-based measures. Eur J Health Econ. 2010;11(2):215–25.
18. Bansback N, Marra C, Tsuchiya A, et al. Using the health assessment questionnaire to estimate preference-based single indices in patients with rheumatoid arthritis. Arthritis Rheum. 2007;57(6):963–71.
19. Brennan A, Bansback N, Nixon R, et al. Modelling the cost effectiveness of TNF-alpha antagonists in the management of rheumatoid arthritis: results from the British Society for Rheumatology Biologics Registry. Rheumatology (Oxford). 2007; 46(8):1345–54.
20. Kent S, Gray A, Schlackow I, Jenkinson C, McIntosh E. Mapping from the Parkinson’s Disease Questionnaire PDQ-39 to the Generic EuroQol EQ-5D-3L: the value of mixture models. Med Decis Making. 2015;35(7):902–11.
21. Acaster S, Pinder B, Mukuria C, Copans A. Mapping the EQ-5D index from the cystic fibrosis questionnaire-revised using multiple modelling approaches. Health Qual Life Outcomes. 2015;13:33.
22. Mihalopoulos C, Chen G, Iezzi A, Khan MA, Richardson J. Assessing outcomes for cost-utility analysis in depression: com-parison of five multi-attribute utility instruments with two depression-specific outcome measures. Br J Psychiatry. 2014; 205(5):390–7.
23. Dakin H, Petrou S, Haggard M, Benge S, Williamson I. Mapping analyses to estimate health utilities based on responses to the OM8-30 Otitis Media Questionnaire. Qual Life Res. 2010; 19(1):65–80.
24. Huang IC, Frangakis C, Atkinson MJ, et al. Addressing ceiling effects in health status measures: a comparison of techniques applied to measures for people with HIV disease. Health Serv Res. 2008;43(1 Pt 1):327–39.
25. Basu A, Manca A. Regression estimators for generic health-related quality of life and quality-adjusted life years. Med Decis Making. 2012;32(1):56–69.
26. Holodniy M, Brown ST, Cameron DW, et al. Results of antire-troviral treatment interruption and intensification in advance multi-drug resistant HIV infection from the OPTIMA trial. PLoS One. 2011;6(3):10.
27. Kyriakides TC, Babiker A, Singer J, et al. An open-label ran-domized clinical trial of novel therapeutic strategies for HIV-infected patients in whom antiretroviral therapy has failed: ratio-nale and design of the OPTIMA Trial. Control Clin Trials. 2003; 24(4):481–500.
28. Balfour L, Spaans JN, Fergusson D, et al. Micronutrient defi-ciency and treatment adherence in a randomized controlled trial of micronutrient supplementation in ART-naive persons with HIV. PLoS One. 2014;9(1):e85607.
29. Singhal N, Fergusson D, Huff H, et al. Design and methods of the MAINTAIN study: a randomized controlled clinical trial of micronutrient and antioxidant supplementation in untreated HIV infection. Contemp Clin Trials. 2010;31(6):604–11.
30. Longworth L, Rowen D. Mapping to obtain EQ-5D utility val-ues for use in NICE health technology assessments. Value Health. 2013;16(1):202–10.
31. Wailoo AJ, Hernandez Alava M, Manca A, et al. Use of map-ping to estimate utility values from non-preference based out-come measures for cost per QALY economic analysis: Good Research Practices Task Force. Available from: https://www. ispor.org/TaskForces/
Mapping-to-Estimate-Cost-per-QALYEconomicAnalysisTF-Draft-forReview.pdf
32. Petrou S, Rivero-Arias O, Dakin H, et al. Preferred reporting items for studies mapping onto preference-based outcome mea-sures: the MAPS statement. Pharmacoeconomics. 2015;33(10): 985–91.
33. Petrou S, Rivero-Arias O, Dakin H, et al. The MAPS reporting statement for studies mapping onto generic preference-based out-come measures: explanation and elaboration. Pharmacoeconomics. 2015;33(10):993–1011.
34. Feeny D, Furlong W, Torrance GW, et al. Multiattribute and single-attribute utility functions for the health utilities index mark 3 system. Med Care. 2002;40(2):113–28.
36. Szende A, Schaefer C. A taxonomy of health utility assess-ment methods and the role for uncertainty analysis. Eur J Health Econ. 2006;7(2):147–51.
37. Shaw JW, Johnson JA, Coons SJ. US valuation of the EQ-5D health states: development and testing of the D1 valuation model. Med Care. 2005;43(3):203–20.
38. Dakin H. Review of studies mapping from quality of life or clinical measures to EQ-5D: an online database. Health Qual Life Outcomes. 2013;11:151.
39. Khan KA, Madan J, Petrou S, Lamb SE. Mapping between the Roland Morris Questionnaire and generic preference-based mea-sures. Value Health. 2014;17(6):686–95.
40. Austin P, Escobar M. The use of finite mixture models to esti-mate the distribution of the health utilities index in the presence of a ceiling effect. J Appl Stat. 2003;30(8):909–23.
41. Coca Perraillon M, Shih YC, Thisted RA. Predicting the EQ-5D-3L Preference Index from the SF-12 Health Survey in a national US sample: a finite mixture approach. Med Decis Making. 2015;35(7):888–901.
MAPPING MOS-HIV TO HUI3 AND EQ-5D-3L