RESEARCH
Evaluation of four clinical laboratory
parameters for the diagnosis of myalgic
encephalomyelitis
Kenny L. De Meirleir
1†, Tatjana Mijatovic
2†, Krishnamurthy Subramanian
3, Karen A. Schlauch
4and Vincent C. Lombardi
5*Abstract
Background: Myalgic encephalomyelitis (ME) is a complex and debilitating disease that often initially presents with flu-like symptoms, accompanied by incapacitating fatigue. Currently, there are no objective biomarkers or laboratory tests that can be used to unequivocally diagnosis ME; therefore, a diagnosis is made when a patient meets series of a costly and subjective inclusion and exclusion criteria. The purpose of the present study was to evaluate the utility of four clinical parameters in diagnosing ME.
Methods: In the present study, we utilized logistic regression and classification and regression tree analysis to con-duct a retrospective investigation of four clinical laboratory in 140 ME cases and 140 healthy controls.
Results: Correlations between the covariates ranged between [− 0.26, 0.61]. The best model included the serum levels of the soluble form of CD14 (sCD14), serum levels of prostaglandin E2 (PGE2), and serum levels of interleukin 8, with coefficients 0.002, 0.249, and 0.005, respectively, and p-values of 3 × 10⁻⁷, 1
× 10−5, and 3
× 10−3, respectively. Conclusions: Our findings show that these parameters may help physicians in their diagnosis of ME and may addi-tionally shed light on the pathophysiology of this disease.
Keywords: ME/CFS, Diagnostic, IL-8, PGE2, sCD14, CD57, Chronic fatigue
© The Author(s) 2018. This article is distributed under the terms of the Creative Commons Attribution 4.0 International License (http://creat iveco mmons .org/licen ses/by/4.0/), which permits unrestricted use, distribution, and reproduction in any medium, provided you give appropriate credit to the original author(s) and the source, provide a link to the Creative Commons license, and indicate if changes were made. The Creative Commons Public Domain Dedication waiver (http://creat iveco mmons .org/ publi cdoma in/zero/1.0/) applies to the data made available in this article, unless otherwise stated.
Background
Myalgic encephalomyelitis is a heterogeneous illness often characterized by a number of physical symptoms and comorbid conditions such as systemic inflammation, neurocognitive abnormalities, innate immune activation, and gastrointestinal issues [1]. Current estimates indicate that up to 4 million individuals in the U.S. are afflicted with ME [2], with an annual productivity loss in excess of $23 billion in the United States alone [3], underscor-ing the significant impact of ME as a major public health concern both economically and socially.
Little is known regarding the etiology of ME; how-ever, a number of potential triggers or stressors are typi-cally reported to coincide with the onset of the disease including viral or flu-like symptoms, chemical exposure, physical trauma, or emotional distress [4–6]. Based on genome-wide association studies (GWAS) and familial studies, a genetic predisposition has also been suggested to play a role in the disease [7–10]. With the exception of perhaps exercise intolerance and general inflammation, no ubiquitous physical symptoms or diagnostic biomark-ers have been identified; therefore, a diagnosis is primar-ily based on meeting a number of inclusion and exclusion criteria [11, 12]. As such, ME is often considered a “het-erogenous” disease and this limitation has hindered the identification of nonsubjective biomarkers [13]. Com-pounding this issue, current research suggests that previ-ously described potential biomarkers, such as cytokines,
Open Access
*Correspondence: [email protected]
†Kenny L. De Meirleir and Tatjana Mijatovic contributed equally to this
work
5 Department of Microbiology and Immunology, University of Nevada,
Reno, School of Medicine, Reno, NV, USA
change over time [14] and may vary depending on illness duration [15] and severity [16].
In light of the heterogenous nature of ME, a biomarker that separates patients into more homogenous sub-groups, based on clinical presentation would be useful; albeit, some progress has been made in this area. For instance, Naviaux and coworkers conducted a metabo-lomics study of ME cases and controls and identified a profile, characterized by decreased circulating ceramides [17]. A later study by Nagy-Szakal et al. elaborated that the subset of ME cases who present with irritable bowel syndrome (IBS) comorbidity have increased plasma cera-mides [18]. When taken together, these studies imply that serum or plasma ceramides may have the necessary sen-sitivity to subgroup ME cases based on gastrointestinal (GI) comorbidity, although these observations will need to be evaluated against diseases with overlapping symp-tomology to show specificity.
While not universally prevalent, a small number of immunological parameters have been frequently reported to associate with subgroups of ME cases includ-ing natural killer (NK) cell dysfunction and inflamma-tory cytokine production. For these reasons, as well as other, it is generally accepted that ME has immunologi-cal underpinnings [19–23]. Currently, the mechanisms responsible for these observations remain elusive, but if identified, this knowledge would provide a greater under-standing of ME pathology, potentially leading to effective treatment options.
In the present study, we investigated four immunologi-cal parameters that were chosen based on the following rationale: Subjects with ME are often characterized by coinfections; therefore, we analyzed the chemotactic factor interlerukin-8 (IL-8), which is produced by mac-rophages and, to a lesser extent, by other cells in response to infection. In light of the GI comorbidity, commonly associated with ME we measured the soluble form of CD14 (sCD14); a surrogate marker of bacterial translo-cation in the gut [48]. Orthostatic intolerance and atypi-cally cerebral vasoconstriction following orthostatic challenge are often observed in subjects with ME [24,
25]. Additionally, females commonly report exasperated symptoms of premenstrual syndrome and Th1 suppres-sion is commonly observed as well, all of which are asso-ciated with prostaglandin E2 (PGE2) production [26–28]. Lastly, CD57 expression on natural killer (NK) cells is an end-stage marker for their maturation [29]. Previous studies suggest that circulating CD57+/CD3− NK cells
are increased in association with chronic infections but are downregulated in several autoimmune diseases [29]. Mounting evidence suggests that ME may have an “auto-immune-like” etiology [30–35]; therefore, we included circulating CD57+/CD3− NK cells in our analysis.
Methods
Study design
Retrospective analyses of existing clinical data were con-ducted under a HIPAA authorization waiver, as deter-mined by the University of Nevada, Reno Institutional Review Board (IRB) [Protocol 1213405-1]. From these data, four clinical parameters were chosen for investiga-tion based on their potential diagnostic utility and their ability to subgroup ME cases, given their common symp-toms and medical anamnesis. In the present study, the following data were collected: absolute counts of periph-eral CD57+/CD3− lymphocytes; serum levels of IL-8,
(also known as CXCL8); serum levels of the soluble form of CD14 (sCD14) and serum levels of prostaglandin E2 (PGE2). Age and gender were also recorded to address potential age- and gender-related contributions.
Clinical data
Whole blood (K2EDTA anticoagulant) and serum was collected by venipuncture from ME cases at the Him-munitas Foundation clinic (Brussels, Belgium), and transported the same day to R.E.D. Laboratories (Zellik, Belgium) for clinical analysis. These analyses were con-ducted as part of the patient’s initial clinical work-up. Laboratory results were search from a sequential acces-sion series starting in 2013. From these data the first 70 female and 71 male cases who met the following inclu-sion criteria were selected: all four parameters were eval-uated for each subject using blood drawn on the same day; and each subject had received a diagnosis of ME according the Canadian Consensus Criteria for ME [11]. Data from these 70 female cases (age median 44 years; age range 16–68 years) and 71 male cases (age median 43 years; age range 15–67 years) were used in the analy-sis, as well as data from 70 female (age median 44.5 years; age range 14–86 years) and 70 male (age median 43.5 years; age range 18–70 years) healthy subjects. Con-trol subjects met the following inclusion criteria: Normal white blood cell count, no inflammation, (C-reactive pro-tein < 1 mg/L), and no clinical history of chronic immune disease or diabetes.
PGE2 quantitative determination in human serum
de-identified samples from 42 female and 37 male healthy subjects referred to the laboratory for a general check-up screening. Statistical analyses established that no differ-ences in PGE2 were linked to age; however, noticeable differences were linked to gender. Therefore, gender-spe-cific median values were established. These median val-ues were used to standardize all valval-ues in the format of a ratio. The control range was established using the 10th (P10) and 90th (P90) percentile of the healthy popula-tion as references values, i.e. P10 ratio to median as lower limit and the P90 ratio to median as upper limit (Table 1).
Quantification of IL‑8 and sCD14 serum levels
Serum levels of IL-8 were assessed as part of a multi-plex cytokine panel using the BD Cytometric Bead Array Human Inflammatory Cytokines Kit on a BD FACS Canto II™ flow cytometer (Becton–Dickinson Biosciences, San José, CA, USA). Absolute values were calculated from a standard curve using FCAP Array™ software and inter-assay controls were used for each batch. Similarly, serum levels of sCD14 were assessed using BD Cytometric Bead Array Human Soluble CD14 Flex Set on the same cytom-eter, according to the manufacturer’s instructions. Posi-tive controls and inter-assay controls were run for each batch, and unknown values were calculated from a stand-ard curve generated using protein standstand-ards of known concentrations.
Quantification of peripheral CD57+/CD3− lymphocytes
Absolute CD57+/CD3− lymphocytes counts were
evalu-ated with a BD FACS Canto II™ flow cytometer on anti-coagulated (K2EDTA) whole blood using a clinically validated lyse no wash protocol. Briefly, 50 µL of whole blood was added to BD Trucount™ absolute count-ing tubes, with 10 µL of PerCP-anti-CD45 (clone 2D1), 10 µL of PE-anti-CD3e (clone UCHT1) and 10 µL of FITC-anti-CD57 (clone HNK-1) antibody and incubated for 10 min in the dark. The samples where then and lysed with 0.5 mL of BD FACS™ lysing solution and analyzed promptly. Lymphocytes were gated based on forward and side scatter, collecting a minimum of 1000 counting
beads, and the cells of interested were identified as the CD57+/CD3− population. Counting beads in the
Tru-count™ tubes were used to calculate the absolute number of CD57+/CD3− lymphocytes per ml of blood.
Statistical methods
Our dataset consisted of the four variables measured for 70 female controls, 70 male controls, 70 female cases, and 71 male cases. One instance of the IL-8 measure (22,595,208 pg/mL) was 700-fold greater than the next highest IL-8 measure (32,717 pg/mL), and almost 12 standard deviations above the mean case IL-8 measure. This outlier was excluded from the dataset, leaving 69 female cases and 71 male cases. The data were prelimi-nary analyzed using a logistic regression model. Addi-tionally, in order to explore if a diagnostic algorithm could be established, we performed a classification analy-sis using the respective clinical variables in combination with age and gender as the covariates and subject status (case or control) as the target variable.
Results
Distributions of the four variables were log-transformed and tested for normality. As none of the four distributions were normal, non-parametric statistical tests were per-formed. A simple forward and backward logistic regres-sion was performed on the four biochemical parameters and the covariates age and gender. None of the four bio-chemical parameters were found to be in high correla-tion with each other, ranging between [− 0.26, 0.61]. The best model included the sCD14, PGE2, IL-8 measures with coefficients 0.002, 0.249, and 0.005, respectively, and p-values of 3 × 10⁻⁷, 1 × 10⁻⁵, and 3 × 10⁻³, respectively.
In order to establish if a potential diagnostic algorithm was feasible, we conducted a classification and regression tree (CART) analysis using sCD14, PGE2, IL-8 as predic-tive variables and subject status as the target variable. CART analysis utilizes recursive partitioning of these clinical variables into increasingly smaller sets of the dependent variable (case or control in our analysis). Dur-ing each recursion, the binary splits for each dependent
Table 1 Demographic information and clinical values for the respective study groups
* PGE2 values are given as a ratio to a reference range median; ranges are for females (top) and males (bottom)
Age range Age mean CD57 (cells/mL) sCD14 (ng/mL) PGE2 IL‑8 (pg/mL)
Reference range: 60–360 1430–2800 0.1–2.81*
0.17–6.45 0–15
[image:3.595.58.539.101.193.2]variable is examined and the split that optimizes the homogeneousness of the two resulting groups, with respect to the dependent variable is chosen [36]. CART analysis is well-suited for this investigation, as it pro-duces an algorithm that is amenable for diagnostic data purposes. It is also able to classify systems that differ due to natural causes and determine the relative importance of different variables for identifying homogeneous groups within a data set [37].
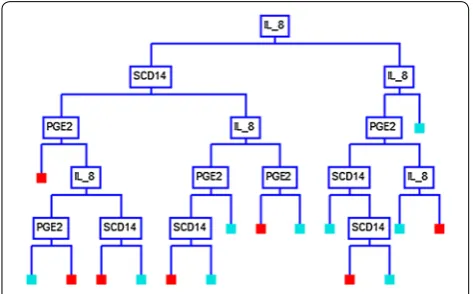
Using the CART analysis with the Gini splitting method, a 16-node decision tree produced a set of “if– then” logical (split) conditions, based on the biochemical parameters, that yielded approximately 90% specificity and sensitivity in distinguishing ME cases from controls (Table 2). Each node of the decision tree provided a deci-sion metric based on the subject values of one of the three clinical parameters (Fig. 1). A detailed analysis of each node with the respective split values are given in Additional file 1: Figure S1.
We additionally conducted a CART analysis with all four clinical variables, as well as the demographic vari-ables of age and gender; however, this analysis did not significantly improve the predictive outcome (data not shown).
Discussion
Diagnosing ME is problematic in that no disease-specific biological markers have been described; therefore, a diag-nosis is made when a patient meets a combination of costly and subjective inclusion and exclusion criteria [11,
12, 38]. For this reason, a convenient diagnostic for ME would dramatically improve patient care and decrease medical costs. Such a diagnostic would also allow physi-cians and researchers to objectively follow the efficacy of new therapeutics during the course of clinical trials. With
this in mind, we have conducted a retrospective analysis to assess the utility of four clinical laboratory parameters in diagnosing ME cases. Three of these were ultimately used to conduct a CART analysis in order to identify an algorithm that can assist physicians in the use of these parameters.
When we conducted our analysis, access to similar data from other disease cohorts was not available. These data would be necessary to show that the parameters can be used to distinguish ME from other diseases with overlap-ping comorbidities, and thus, represented the principal limitation to our study. Additionally, because this was a retrospective study that utilized existing data, we were not able to establish subgroups based on clinical presen-tations. The only data available were clinical laboratory data, demographic data and disease diagnosis. Although acquiring and screening specimens representing these other disease cohorts will be the focus of future studies, the data and results presented here are an important first step in the ultimate goal of developing a specific diagnos-tic for ME. This study also provides clear unequivocal evidence of the immunological underpinnings of ME.
In this study, we analyzed data from 140 ME cases and 140 healthy controls subjects, composed of approxi-mately half males and half females in each group. Using the two analytical methods, linear regression and CART, we determined that gender and age did not significantly impact the predictive model, nor did the inclusion of absolute CD57+/CD3− lymphocytes counts. The CD57
antigen is a sulfated glycan carbohydrate epitope and among circulating lymphocytes, is primarily expressed on mature NK cells and terminally differentiated T cells.
Table 2 CART analysis summary of ME cases and healthy controls
Actual class Total class Percent
correct (%) Predicted classes ME case Control N = 139 N = 141
Case 140 89.29 125 15
Control 140 90.00 14 126 Total 280
Average 89.64 Overall correct 89.64 Specificity 90.00 Sensitivity 89.29 Precision 89.93 F1 statistic 89.61
[image:4.595.304.541.88.235.2] [image:4.595.57.293.112.276.2]Although its function on NK cells is still a subject of ongoing research, CD57 expression is also considered a marker for NK cells that are highly mature and terminally differentiated [39], and is also generally believed to reflect their immunosenescence [40]. NK cell dysfunction has been reported to associated with ME by several investiga-tors [41, 42]; however, recent studies have brought into question their diagnostic potential [43]. While differences in CD57+/CD3− lymphocytes counts have been
associ-ated with other neuroimmune diseases [44], their inclu-sion in our study did not significantly improve its overall diagnostic ability. Nevertheless, there may be a number of reasons for this. In the present study, we limited our subjects to those with a confirmed diagnosis of ME, which by definition, implies that other potential causes have been ruled out [11]. Notwithstanding, when inves-tigating diseases with overlapping or similar symptoms, including CD57+/CD3− lymphocyte counts may be
ben-eficial. For instance, Blom et al. reported that tick-borne encephalitis virus-induced NK cell activation is primarily limited to differentiated CD57+/CD56dim+ NK cells [45].
Additionally, CD57+ NK cells are routinely implicated in
herpesvirus infections [46, 47]. Therefore, including this parameter may be of utility when establishing or ruling out an initial diagnosis of ME.
In this study, we utilized classification and regression tree CART analysis to produce a predictive binary deci-sion tree, that defines the optimal values of each param-eter as a branch point. Using serum IL-8 as the first node in the decision tree and with a cut-off value of > 137.5 pg/ mL, 109 of the 140 ME cases subjects were correctly categorized. Moreover, 132 of 140 controls were cor-rectly categorized as having IL-8 values of ≤ 137.5 pg/mL (Additional file 1: Figure S1).
IL-8 is a chemotactic factor that attracts leukocytes, such as neutrophils, basophils, and T-cells to sites of tissue injury and infection. Upregulation of IL-8 has also been reported in association with several chronic diseases such as autoimmune and inflammatory dis-ease [48]. Multiple isoforms of IL-8 are produced through alternate splicing and proteolytic cleavage; a process that is largely cell-specific. For instance, the most common isoform in humans, IL-8(6–77), is produced primarily by monocytes and lymphocytes, while IL-8(1–77), which is produced by fibroblasts and endothelial cells, is likely the second most abundant form [49]. Notwithstanding, a wide variety of other cells express IL-8 including neutrophils, fibroblasts, mast cells, smooth muscle cells and dendritic cells [50–54]. Additionally, posttranslational modification of IL-8, such as citrullination or deamination, is known to lead to altered biological activity [55]. Understand-ing which isoform of IL-8, and which posttranslational
modifications are most prevalent in ME may provide valuable insight into the underlying pathophysiology of the disease.
In our retrospective analysis, we observed IL-8 to be significantly upregulated in a large number of ME sub-jects; however, previous studies have reported inconsist-ent or contradictory results with respect to IL-8 [19, 23,
56–58]. For instance, in one study, no difference in serum IL-8 levels were observed in ME cases when compared to healthy controls [16]; however, another study using the same analytical methods, showed significant differ-ences between short-duration versus long-duration ME cases versus controls [15]. These discrepancies may be the result of patient selection methods, choice of sample matrix (i.e. serum vs. plasma, vs. mRNA) or analytical methods. Indeed, the heterogenous nature of the disease makes patient selection a perennial difficulty when inves-tigating ME and the two aforementioned studies support this assertion, at least with respect to IL-8.
In additional to CD57+/CD3− lymphocytes and
serum IL-8, we also investigated the utility of includ-ing sCD14 and PGE2 in our model. CD14, along with Toll-like receptor (TLR)-4 and lymphocyte antigen 96 (MD-2), forms the receptor complex that bind lipopolysaccharides (LPS) [59], which are found in the outer membrane of Gram-negative bacteria. Pre-vious reports have identified sCD14 as a nonspecific marker of monocyte activation [60] as well as a sur-rogate marker of bacterial translocation in the gut [61]. Therefore, individuals with ME and who present with an upregulation of sCD14 are likely to have a GI comorbidity. Accordingly, sCD14 may be a useful bio-marker for subgrouping ME cases, with irritable bowel syndrome. PGE2, on the other hand, regulates multiple aspects of inflammation and the functions of different immune cells [62]. It is generally acknowledged as a mediator of acute inflammation, stimulating chemo-taxis and activation of mast cells, neutrophils, and macrophages, during the early stages of inflammation [63–65]. It also has the capacity promote the induction of suppressive IL-10 as well as the downregulation of several proinflammatory cytokines, thus suppressing nonspecific inflammation [62]. Although it can mote the activation, maturation and migration of pro-fessional antigen-presenting cells, it has been shown to suppress both innate and antigen-specific immunity at several levels [62, 66]. Therefore, PGE2 has proinflam-matory as well as immunosuppressive properties.
Our model showed that sCD14 can further subgroup ME cases with IL-8 levels that satisfy the following inequality: 22.0 pg/mL < IL-8 ≤ 137.5 pg/mL. We also observed that PGE2 can be used to subgroup ME cases with IL-8 levels that satisfy the following inequality: 137.5 pg/mL < IL-8 ≤ 240.0 pg/mL (Additional file 1: Figure S1). Additional combinations of IL-8, sCD14 and PGE2, as articulated in Additional file 1: Figure S1, can be used to further subgroup ME cases from healthy controls.
Conclusions
In summary, we have conducted a retrospective anal-ysis of four clinical parameters from ME cases and healthy controls and have shown that three of these parameters can be used to delineate ME cases and con-trols with approximately 90% specificity and sensitivity using the analytical methods described herein. Fur-ther studies will be necessary to show if the proposed model will be useful in diagnosing ME from diseases with overlapping comorbidity.
Additional files
Additional file 1: Figure S1. Comprehensive version of the decision tree presented in Fig. 1.
Additional file 2: Table S1. Comparison between three analytical meth-ods. All values are pg/mL.
Abbreviations
CART : classification and regression tree; CXCL8: chemokine (C–X–C motif ) ligand 8; GWAS: genome-wide association studies; HIPAA: Health Insurance Portability and Accountability Act; IL: interleukin; IRB: Institutional Review Board; LPS: lipopolysaccharides; ME: myalgic encephalomyelitis; PGE2:
prosta-glandin E2; sCD14: soluble cluster of differentiation 14; TLR: toll-like receptor.
Authors’ contributions
KDM diagnosed patients and chose laboratory parameters to investigate, TM performed clinical laboratory testing, VCL performed confirmatory labora-tory testing, KS, collected and organized data, KAS and VCL performed data analysis, TM and VCL wrote the manuscript. All authors read and approved the final manuscript.
Author details
1 Himmunitas Foundation, de Tyraslaan 111, 1120 Brussels, Belgium. 2 R.E.D.
Laboratories, Z.1 Research park 100, 1731 Zellik, Belgium. 3 Himmunitas Clinic,
de Tyraslaan 111, 1120 Brussels, Belgium. 4 Desert Research Institute, 2350
Rag-gio Pkwy, Reno, NV 89512, USA. 5 Department of Microbiology and
Immunol-ogy, University of Nevada, Reno, School of Medicine, Reno, NV, USA.
Acknowledgements
We are grateful to Nossa Van den Vonder for her assistance in collecting the data and to Carli Kinne for her assistance with the human subject protocol.
Competing interests
KDM and TM are employees of their respective institutions, which charge for their services. R.E.D. Laboratories is a commercial laboratory which offers the diagnostics used in this report on a fee for service basis.
Availability of data and materials
The datasets used and/or analyzed during the current study are available from the corresponding author on reasonable request.
Consent for publication
Not applicable.
Ethics approval and consent to participate
Retrospective analyses of existing clinical data were conducted under a HIPAA authorization waiver, as determined by the University of Nevada, Reno Institu-tional Review Board (IRB) [Protocol 1213405-1].
Funding
This study was internally funded.
Publisher’s Note
Springer Nature remains neutral with regard to jurisdictional claims in pub-lished maps and institutional affiliations.
Received: 1 September 2018 Accepted: 14 November 2018
References
1. Klimas NG, Koneru AO. Chronic fatigue syndrome: inflammation, immune function, and neuroendocrine interactions. Curr Rheumatol Rep. 2007;9:482–7.
3. Jason LA, Benton MC, Valentine L, Johnson A, Torres-Harding S. The economic impact of ME/CFS: individual and societal costs. Dyn Med. 2008;7:6.
4. Bell KM, Cookfair D, Bell DS, Reese P, Cooper L. Risk factors associated with chronic fatigue syndrome in a cluster of pediatric cases. Rev Infect Dis. 1991;13(Suppl 1):S32–8.
5. Racciatti D, Vecchiet J, Ceccomancini A, Ricci F, Pizzigallo E. Chronic fatigue syndrome following a toxic exposure. Sci Total Environ. 2001;270:27–31.
6. Jason LA, Porter N, Hunnell J, Rademaker A, Richman JA. CFS prevalence and risk factors over time. J Health Psychol. 2011;16:445–56.
7. Albright F, Light K, Light A, Bateman L, Cannon-Albright LA. Evidence for a heritable predisposition to chronic fatigue syndrome. BMC Neurol. 2011;11:62.
8. Schlauch KA, Khaiboullina SF, De Meirleir KL, Rawat S, Petereit J, Rizvanov AA, Blatt N, Mijatovic T, Kulick D, Palotas A, Lombardi VC. Genome-wide association analysis identifies genetic variations in subjects with myalgic encephalomyelitis/chronic fatigue syndrome. Transl Psychiatry. 2016;6:e730.
9. Rajeevan MS, Dimulescu I, Murray J, Falkenberg VR, Unger ER. Pathway-focused genetic evaluation of immune and inflammation related genes with chronic fatigue syndrome. Hum Immunol. 2015;76:553–60. 10. Buchwald D, Herrell R, Ashton S, Belcourt M, Schmaling K, Sullivan P,
Neale M, Goldberg J. A twin study of chronic fatigue. Psychosom Med. 2001;63:936–43.
11. Carruthers BM, van de Sande MI, De Meirleir KL, Klimas NG, Broderick G, Mitchell T, Staines D, Powles AC, Speight N, Vallings R, et al. Myal-gic encephalomyelitis: international consensus criteria. J Intern Med. 2011;270:327–38.
12. Carruthers B, Jain AK, De Meirleir K, Peterson D, Klimas N, Lerner A, Bested A, Flor-Henry P, Joshi P, Powles A, et al. Myalgic encephalomyelitis/chronic fatigue syndrome: clinical working case definition, diagnostic and treat-ment protocols. J Chronic Fatigue Syndrome. 2003;11:1–12.
13. Maclachlan L, Watson S, Gallagher P, Finkelmeyer A, Jason LA, Sunnquist M, Newton JL. Are current chronic fatigue syndrome criteria diagnosing different disease phenotypes? PLoS ONE. 2017;12:e0186885.
14. Stringer EA, Baker KS, Carroll IR, Montoya JG, Chu L, Maecker HT, Younger JW. Daily cytokine fluctuations, driven by leptin, are associated with fatigue severity in chronic fatigue syndrome: evidence of inflammatory pathology. J Transl Med. 2013;11:93.
15. Hornig M, Montoya JG, Klimas NG, Levine S, Felsenstein D, Bateman L, Peterson DL, Gottschalk CG, Schultz AF, Che X, et al. Distinct plasma immune signatures in ME/CFS are present early in the course of illness. Sci Adv. 2015;1:e1400121.
16. Montoya JG, Holmes TH, Anderson JN, Maecker HT, Rosenberg-Hasson Y, Valencia IJ, Chu L, Younger JW, Tato CM, Davis MM. Cytokine signature associated with disease severity in chronic fatigue syndrome patients. Proc Natl Acad Sci USA. 2017;114:E7150–8.
17. Naviaux RK, Naviaux JC, Li K, Bright AT, Alaynick WA, Wang L, Baxter A, Nathan N, Anderson W, Gordon E. Metabolic features of chronic fatigue syndrome. Proc Natl Acad Sci USA. 2016;113:E5472–80.
18. Nagy-Szakal D, Barupal DK, Lee B, Che X, Williams BL, Kahn EJR, Ukaigwe JE, Bateman L, Klimas NG, Komaroff AL, et al. Insights into myalgic encephalomyelitis/chronic fatigue syndrome phenotypes through com-prehensive metabolomics. Sci Rep. 2018;8:10056.
19. Fletcher MA, Zeng XR, Barnes Z, Levis S, Klimas NG. Plasma cytokines in women with chronic fatigue syndrome. J Transl Med. 2009;7:96. 20. Kerr JR, Tyrrell DA. Cytokines in parvovirus B19 infection as an aid to
understanding chronic fatigue syndrome. Curr Pain Headache Rep. 2003;7:333–41.
21. Nakamura T, Schwander SK, Donnelly R, Ortega F, Togo F, Broderick G, Yamamoto Y, Cherniack NS, Rapoport D, Natelson BH. Cytokines across the night in chronic fatigue syndrome with and without fibromyalgia. Clin Vaccine Immunol. 2010;17:582–7.
22. Patarca R. Cytokines and chronic fatigue syndrome. Ann N Y Acad Sci. 2001;933:185–200.
23. Khaiboullina SF, DeMeirleir KL, Rawat S, Berk GS, Gaynor-Berk RS, Mijatovic T, Blatt N, Rizvanov AA, Young SG, Lombardi VC. Cytokine expression provides clues to the pathophysiology of Gulf War illness and myalgic encephalomyelitis. Cytokine. 2015;72:1–8.
24. Reynolds GK, Lewis DP, Richardson AM, Lidbury BA. Comorbidity of postural orthostatic tachycardia syndrome and chronic fatigue syndrome in an Australian cohort. J Intern Med. 2014;275:409–17.
25. He J, Hollingsworth KG, Newton JL, Blamire AM. Cerebral vascular control is associated with skeletal muscle pH in chronic fatigue syndrome patients both at rest and during dynamic stimulation. Neuroimage Clin. 2013;2:168–73.
26. Kalinski P. Regulation of immune responses by prostaglandin E2. J Immu-nol. 2012;188:21–8.
27. Koshikawa N, Tatsunuma T, Furuya K, Seki K. Prostaglandins and premen-strual syndrome. Prostaglandins Leukot Essent Fatty Acids. 1992;45:33–6. 28. Horrobin DF. The role of essential fatty acids and prostaglandins in the
premenstrual syndrome. J Reprod Med. 1983;28:465–8.
29. Nielsen CM, White MJ, Goodier MR, Riley EM. Functional significance of CD57 expression on human NK cells and relevance to disease. Front Immunol. 2013;4:422.
30. Loebel M, Grabowski P, Heidecke H, Bauer S, Hanitsch LG, Wittke K, Meisel C, Reinke P, Volk HD, Fluge O, et al. Antibodies to beta adrenergic and muscarinic cholinergic receptors in patients with chronic fatigue syndrome. Brain Behav Immun. 2016;52:32–9.
31. Maes M, Ringel K, Kubera M, Anderson G, Morris G, Galecki P, Geffard M. In myalgic encephalomyelitis/chronic fatigue syndrome, increased autoim-mune activity against 5-HT is associated with immuno-inflammatory pathways and bacterial translocation. J Affect Disord. 2013;150:223–30. 32. Morris G, Berk M, Galecki P, Maes M. The emerging role of autoimmunity
in myalgic encephalomyelitis/chronic fatigue syndrome (ME/cfs). Mol Neurobiol. 2014;49:741–56.
33. Singh S, Stafford P, Schlauch KA, Tillett RR, Gollery M, Johnston SA, Khai-boullina SF, De Meirleir KL, Rawat S, Mijatovic T, et al. Humoral immunity profiling of subjects with myalgic encephalomyelitis using a random peptide microarray differentiates cases from controls with high specificity and sensitivity. Mol Neurobiol. 2018;55:633–41.
34. Sotzny F, Blanco J, Capelli E, Castro-Marrero J, Steiner S, Murovska M, Scheibenbogen C, European Network on MC. Myalgic encephalomyeli-tis/chronic fatigue syndrome—evidence for an autoimmune disease. Autoimmun Rev. 2018;17:601–9.
35. Blomberg J, Gottfries CG, Elfaitouri A, Rizwan M, Rosen A. Infection elicited autoimmunity and myalgic encephalomyelitis/chronic fatigue syndrome: an explanatory model. Front Immunol. 2018;9:229. 36. De’ath G, Fabricius KE. Classification and regression trees: a powerful yet
simple technique for ecological data analysis. Ecology. 2000;81:3178–92. 37. Prasad AM. Macroscale intraspecific variation and environmental
heterogeneity: analysis of cold and warm zone abundance, mortality, and regeneration distributions of four eastern US tree species. Ecol Evol. 2015;5:5033–48.
38. Fukuda K, Straus SE, Hickie I, Sharpe MC, Dobbins JG, Komaroff A. The chronic fatigue syndrome: a comprehensive approach to its definition and study. International Chronic Fatigue Syndrome Study Group. Ann Intern Med. 1994;121:953–9.
39. Lopez-Verges S, Milush JM, Pandey S, York VA, Arakawa-Hoyt J, Pircher H, Norris PJ, Nixon DF, Lanier LL. CD57 defines a functionally distinct popula-tion of mature NK cells in the human CD56dimCD16+ NK-cell subset. Blood. 2010;116:3865–74.
40. Stricker RB, Winger EE. Decreased CD57 lymphocyte subset in patients with chronic Lyme disease. Immunol Lett. 2001;76:43–8.
41. Brenu EW, van Driel ML, Staines DR, Ashton KJ, Hardcastle SL, Keane J, Tajouri L, Peterson D, Ramos SB, Marshall-Gradisnik SM. Longitudinal investigation of natural killer cells and cytokines in chronic fatigue syn-drome/myalgic encephalomyelitis. J Transl Med. 2012;10:88. 42. Brenu EW, Staines DR, Baskurt OK, Ashton KJ, Ramos SB, Christy RM,
Marshall-Gradisnik SM. Immune and hemorheological changes in chronic fatigue syndrome. J Transl Med. 2010;8:1.
43. Theorell J, Bileviciute-Ljungar I, Tesi B, Schlums H, Johnsgaard MS, Asadi-Azarbaijani B, Bolle Strand E, Bryceson YT. Unperturbed cytotoxic lym-phocyte phenotype and function in myalgic encephalomyelitis/chronic fatigue syndrome patients. Front Immunol. 2017;8:723.
•fast, convenient online submission
•
thorough peer review by experienced researchers in your field
• rapid publication on acceptance
• support for research data, including large and complex data types
•
gold Open Access which fosters wider collaboration and increased citations maximum visibility for your research: over 100M website views per year
•
At BMC, research is always in progress.
Learn more biomedcentral.com/submissions
Ready to submit your research? Choose BMC and benefit from: 45. Blom K, Braun M, Pakalniene J, Lunemann S, Enqvist M, Dailidyte
L, Schaffer M, Lindquist L, Mickiene A, Michaelsson J, et al. NK cell responses to human tick-borne encephalitis virus infection. J Immunol. 2016;197:2762–71.
46. Nerreter T, Zeiss S, Herrmann T, Einsele H, Seggewiss-Bernhardt R. Robust 8-color flow cytometry panel reveals enhanced effector function of NKG2C(+) CD57(+) FcepsilonRgamma(−) NK cells in CMV seropositive human blood donors. Immunobiology. 2017;222:719–25.
47. Saboia-Dantas CJ, Coutrin de Toledo LF, Siqueira JF Jr, Sampaio-Filho HR, Carvalho JJ, Pereira MJ Jr. Natural killer cells and alterations in collagen density: signs of periradicular herpesvirus infection? Clin Oral Investig. 2008;12:129–35.
48. Russo RC, Garcia CC, Teixeira MM, Amaral FA. The CXCL8/IL-8 chemokine family and its receptors in inflammatory diseases. Expert Rev Clin Immu-nol. 2014;10:593–619.
49. Kristensen MS, Paludan K, Larsen CG, Zachariae CO, Deleuran BW, Jensen PK, Jorgensen P, Thestrup-Pedersen K. Quantitative determination of IL-1 alpha-induced IL-8 mRNA levels in cultured human keratinocytes, dermal fibroblasts, endothelial cells, and monocytes. J Invest Dermatol. 1991;97:506–10.
50. Lim CP, Phan TT, Lim IJ, Cao X. Cytokine profiling and Stat3 phosphoryla-tion in epithelial–mesenchymal interacphosphoryla-tions between keloid keratino-cytes and fibroblasts. J Invest Dermatol. 2009;129:851–61.
51. Moller A, Lippert U, Lessmann D, Kolde G, Hamann K, Welker P, Schaden-dorf D, Rosenbach T, Luger T, Czarnetzki BM. Human mast cells produce IL-8. J Immunol. 1993;151:3261–6.
52. Smedman C, Gardlund B, Nihlmark K, Gille-Johnson P, Andersson J, Paulie S. ELISpot analysis of LPS-stimulated leukocytes: human granulocytes selectively secrete IL-8, MIP-1beta and TNF-alpha. J Immunol Methods. 2009;346:1–8.
53. Sandor N, Pap D, Prechl J, Erdei A, Bajtay Z. A novel, complement-medi-ated way to enhance the interplay between macrophages, dendritic cells and T lymphocytes. Mol Immunol. 2009;47:438–48.
54. Vanaudenaerde BM, Wuyts WA, Dupont LJ, Van Raemdonck DE, Demedts MM, Verleden GM. Interleukin-17 stimulates release of interleukin-8 by human airway smooth muscle cells in vitro: a potential role for interleukin-17 and airway smooth muscle cells in bronchiolitis obliterans syndrome. J Heart Lung Transplant. 2003;22:1280–3.
55. Proost P, Loos T, Mortier A, Schutyser E, Gouwy M, Noppen S, Dillen C, Ronsse I, Conings R, Struyf S, et al. Citrullination of CXCL8 by peptidylargi-nine deiminase alters receptor usage, prevents proteolysis, and dampens tissue inflammation. J Exp Med. 2008;205:2085–97.
56. Hardcastle SL, Brenu EW, Johnston S, Nguyen T, Huth T, Ramos S, Staines D, Marshall-Gradisnik S. Serum immune proteins in moderate and severe chronic fatigue syndrome/myalgic encephalomyelitis patients. Int J Med Sci. 2015;12:764–72.
57. Neu D, Mairesse O, Montana X, Gilson M, Corazza F, Lefevre N, Linkowski P, Le Bon O, Verbanck P. Dimensions of pure chronic fatigue: psychophysi-cal, cognitive and biological correlates in the chronic fatigue syndrome. Eur J Appl Physiol. 2014;114:1841–51.
58. Russell L, Broderick G, Taylor R, Fernandes H, Harvey J, Barnes Z, Smylie A, Collado F, Balbin EG, Katz BZ, et al. Illness progression in chronic fatigue syndrome: a shifting immune baseline. BMC Immunol. 2016;17:3. 59. Kitchens RL. Role of CD14 in cellular recognition of bacterial
lipopolysac-charides. Chem Immunol. 2000;74:61–82.
60. Shive CL, Jiang W, Anthony DD, Lederman MM. Soluble CD14 is a nonspe-cific marker of monocyte activation. AIDS. 2015;29:1263–5.
61. Stehle JR Jr, Leng X, Kitzman DW, Nicklas BJ, Kritchevsky SB, High KP. Lipopolysaccharide-binding protein, a surrogate marker of microbial translocation, is associated with physical function in healthy older adults. J Gerontol A Biol Sci Med Sci. 2012;67:1212–8.
62. Phipps RP, Stein SH, Roper RL. A new view of prostaglandin E regulation of the immune response. Immunol Today. 1991;12:349–52.
63. Yu Y, Chadee K. Prostaglandin E2 stimulates IL-8 gene expression in human colonic epithelial cells by a posttranscriptional mechanism. J Immunol. 1998;161:3746–52.
64. Nakayama T, Mutsuga N, Yao L, Tosato G. Prostaglandin E2 promotes degranulation-independent release of MCP-1 from mast cells. J Leukoc Biol. 2006;79:95–104.
65. Weller CL, Collington SJ, Hartnell A, Conroy DM, Kaise T, Barker JE, Wilson MS, Taylor GW, Jose PJ, Williams TJ. Chemotactic action of prostaglandin E2 on mouse mast cells acting via the PGE2 receptor 3. Proc Natl Acad Sci USA. 2007;104:11712–7.